0877
Hemodynamic imaging parameters in brain metastases patients – Agreement between multi-delay ASL and hypercapnic BOLD
Eva Elisabeth van Grinsven1, Marielle Philippens2, Jeroen Siero3,4, and Alex Bhogal3
1Department of Neurology & Neurosurgery, UMC Utrecht, Utrecht, Netherlands, 2Department of Radiation Oncology, UMC Utrecht, Utrecht, Netherlands, 3Department of Radiology, UMC Utrecht, Utrecht, Netherlands, 4Spinoza Center for Neuroimaging, Amsterdam, Netherlands
1Department of Neurology & Neurosurgery, UMC Utrecht, Utrecht, Netherlands, 2Department of Radiation Oncology, UMC Utrecht, Utrecht, Netherlands, 3Department of Radiology, UMC Utrecht, Utrecht, Netherlands, 4Spinoza Center for Neuroimaging, Amsterdam, Netherlands
Synopsis
Keywords: Blood vessels, Neuroscience
This study compared baseline ASL with BOLD cerebrovascular reactivity (BOLD-CVR) parameters in the brain under different hemodynamic circumstances in patients with brain metastases. There was a strong relationship between baseline cerebral blood flow and BOLD-CVR measurements and the temporal metrics of ASL and BOLD-CVR. However, the relationship between baseline ASL and BOLD-CVR does not hold in tissue with exhausted cerebral autoregulation (i.e. vascular steal regions). Thereby, BOLD-CVR may be able to flag at-risk areas with depleted vascular reserve capacity before they become visible on ASL MRI.Introduction:
Arterial spin labeling (ASL) MRI can inform on brain hemodynamics, specifically cerebral blood flow (CBF), without using an external contrast agent.1 A major cerebral auto-regulatory mechanism responsible for maintaining adequate CBF is cerebrovascular reactivity (CVR). Blood oxygenation level-dependent (BOLD) MRI of hypercapnia-induced changes in CBF is a technique to assess CVR. Changes in these different hemodynamic parameters have been found in different populations, including patients with brain tumors.2–4 However, it is unknown how these ASL and BOLD-CVR parameters relate in different tissue types or under different hemodynamic circumstances– especially considering that ASL provides arterial contrast, while BOLD originates primarily in veins. Therefore, the primary aim of the current study was to investigate how ASL parameters measured during a physiological steady state relate to functional vascular parameters as measured using BOLD-CVR in a patient population with brain metastases (BMs). Specifically, CBF and arterial arrival time (AAT) were compared to BOLD-CVR magnitude and lag time.Methods:
Prior to brain irradiation fourteen patients with BMs were scanned on a Philips 3T system with a multi-delay pCASL multi-slice EPI MRI with 5 post-labeling delays (1206-3480 ms, Look-Locker approach) (TR=664.7 ms, TE=13.7ms, flip angle 25°, resolution=3x3x7mm3, 80x80x17 slices, 23 dynamics) and BOLD MRI during hypercapnic breathing (TR=1050ms, TE=30ms, flip angle 65°, resolution=2.292x2.292x2.5mm3, 96x96x51 slices, 1000 dynamics, multi-band factor=3). Additionally, a 3D T1-TFE sequence (TR=8 ms, TE=3.25 ms, flip angle 10°, isotropic resolution 1 mm, matrix: 240x240x180), a 3D T2-weighted FLAIR sequence (TR=4800 ms, TE=240 ms, flip angle 90°, isotropic resolution 1.1 mm, matrix: 256x256x182), as well as a SWI (TR=50 ms, 5 echoes, flip angle 17°, slice thickness 2 mm, matrix: 384x383x63 ) were acquired. Hypercapnic stimuli were delivered using a RespirAct system (Figure 1). Tissue segmentation into grey matter (GM), white matter (WM) and cerebrospinal fluid (CSF) was performed on the T1 image using FSL Automated Segmentation Tool.5 An edema mask was created based on the T1 and T2FLAIR images using the lesion growth algorithm as implemented in the Lesion Segmentation Tool for SPM.6 BOLD data was corrected for motion7 and geometric distortion8,9 and linear spatial co-registered to the T1 image.7,10 Quantitative CBF and AAT maps were generated using the BASIL tool.11 CVR and hemodynamic lag maps were derived using the open-source seeVR toolbox.12 The pipeline compare the BOLD and ASL data is shown in Figure 2. Data obtained from analysis B was used in subsequent correlation analysis. As this process results in 20 binned values per patient, a repeated-measures correlation was performed to account for the within-subject variance in these values.13 This results in a common slope for all subjects. For all statistical tests a p-value of <0.05 was deemed significant.Results & Discussion:
When visually inspecting the MRI data, all vascularly compromised regions visible in the ASL data were also reflected in the BOLD-CVR metrics (Figure 3). Next, for each MRI metric, the group mean values were compared between steal versus non-steal regions and between different tissue types using Kruskal-Walis tests (Figure 4). WM areas were characterized by lower CBF and longer AAT, as well as lower BOLD-CVR and longer BOLD-lag times than GM, as expected based on previous research in healthy subjects. Large variability in the hemodynamic vascular parameters was seen within tissue containing untreated BMs. This was reflected in both the ASL and the BOLD-CVR parameters. Additionally, correlations were performed between each MRI metric using the AAT or CBF binned ROIs (Figure 5). CBF and BOLD-CVR values were strongly correlated within regions with adequately reacting vasculature. That is, regions with lower blood supply also showed lower vascular reactivity within non-steal brain regions (rrm=0.792). Additionally, longer BOLD-lag times were related to lower CBF (rrm=-0.822). In contrast, in the steal regions with higher CBF more negative CVR (rrm=-0.273) was observed. In line with the theory on cerebral circulation responses14, this indicates that the tight coupling between CBF and CVR does not hold in regions with exhausted cerebral reserve. Results also showed that the lag time of the BOLD-CVR was related to the AAT (rrm=0.712). In other words, regions in which AAT of the baseline ASL was longer also showed a longer vascular response delay to a hypercapnic stimulus. However, both the correlation analyses as well as visual inspection of the data show that these temporal measures are not identical. While prolonged AAT might be able to indicate areas with possible increased vascular collateralization and thereby also longer BOLD-lag times, BOLD-CVR gives and indication of the vascular reserve capacity within a region.Conclusion:
The relationship between ASL-CBF and AAT and BOLD-CVR measures seems to be dependent on the vascular status of the underlying tissue. That is, relationships do not hold in tissue with exhausted cerebral autoregulation. Thereby, BOLD-CVR metrics may be able to flag at-risk areas before they become visible on ASL MRI, specifically within vascular steal regions. However, the downside of using BOLD-metrics is that they are influenced by multiple variables, making it difficult to pinpoint the exact mechanisms underlying this vascular risk. Consequently, to fully understand vascular changes within patients with pathology, combining ASL and BOLD-CVR will provide a more complete picture, especially in populations where subtle vascular changes are expected.Acknowledgements
No acknowledgement found.References
- Telischak NA, Detre JA, Zaharchuk G. Arterial spin labeling MRI: Clinical applications in the brain. J Magn Reson Imaging. 2015;41(5):1165-1180. doi:10.1002/jmri.24751
- Cai S, Shi Z, Zhou S, Liang BSY, Wang L, Wang K. Cerebrovascular Dysregulation in Patients with Glioma Assessed with Time-shifted BOLD fMRI. 2022;(12).
- Fierstra J, van Niftrik C, Piccirelli M, et al. Diffuse gliomas exhibit whole brain impaired cerebrovascular reactivity. Magn Reson Imaging. 2018;45:78-83. doi:10.1016/j.mri.2017.09.017
- Sebök M, van Niftrik CHB, Muscas G, et al. Hypermetabolism and impaired cerebrovascular reactivity beyond the standard MRI-identified tumor border indicate diffuse glioma extended tissue infiltration. Neuro-Oncology Adv. 2021;3(1):1-9. doi:10.1093/noajnl/vdab048
- Zhang Y, Brady M, Smith S. Segmentation of brain MR images through a hidden Markov random field model and the expectation-maximization algorithm. IEEE Trans Med Imaging. 2001;20(1):45-57. doi:10.1109/42.906424
- Schmidt P, Gaser C, Arsic M, et al. An automated tool for detection of FLAIR-hyperintense white-matter lesions in Multiple Sclerosis. Neuroimage. 2012;59(4):3774-3783. doi:10.1016/j.neuroimage.2011.11.032
- Jenkinson M, Bannister P, Brady M, Smith SM. Improved optimization for the robust and accurate linear registration and motion correction of brain images. Neuroimage. 2002;17(2):825-841. doi:10.1006/nimg.2002.1132
- Andersson JLR, Skare S, Ashburner J. How to correct susceptibility distortions in spin-echo echo-planar images: Application to diffusion tensor imaging. Neuroimage. 2003;20(2):870-888. doi:10.1016/S1053-8119(03)00336-7
- Smith SM, Jenkinson M, Woolrich MW, et al. Advances in functional and structural MR image analysis and implementation as FSL. Neuroimage. 2004;23:S208-S219. doi:10.1016/j.neuroimage.2004.07.051
- Jenkinson M, Smith SM. A global optimisation method for robust affine registration of brain images. Med Image Anal. 2001;5(2):143-156. doi:10.1016/S1361-8415(01)00036-6
- Chappell MA, Groves AR, Whitcher B, Woolrich MW. Variational Bayesian inference for a nonlinear forward model. IEEE Trans Signal Process. 2009;57(1):223-236. doi:10.1109/TSP.2008.2005752
- Bhogal AA. abhogal-lab/SeeVR: V2.01. Published online 2021:(V2.01). doi:10.5281/zenodo.6532362
- Bakdash JZ, Marusich LR. Repeated measures correlation. Front Psychol. 2017;8(MAR):1-13. doi:10.3389/fpsyg.2017.00456
- Markus HS. Cerebral perfusion and stroke. J Neurol Neurosurg Psychiatry. 2004;75(3):353-361. doi:10.1136/jnnp.2003.025825
Figures
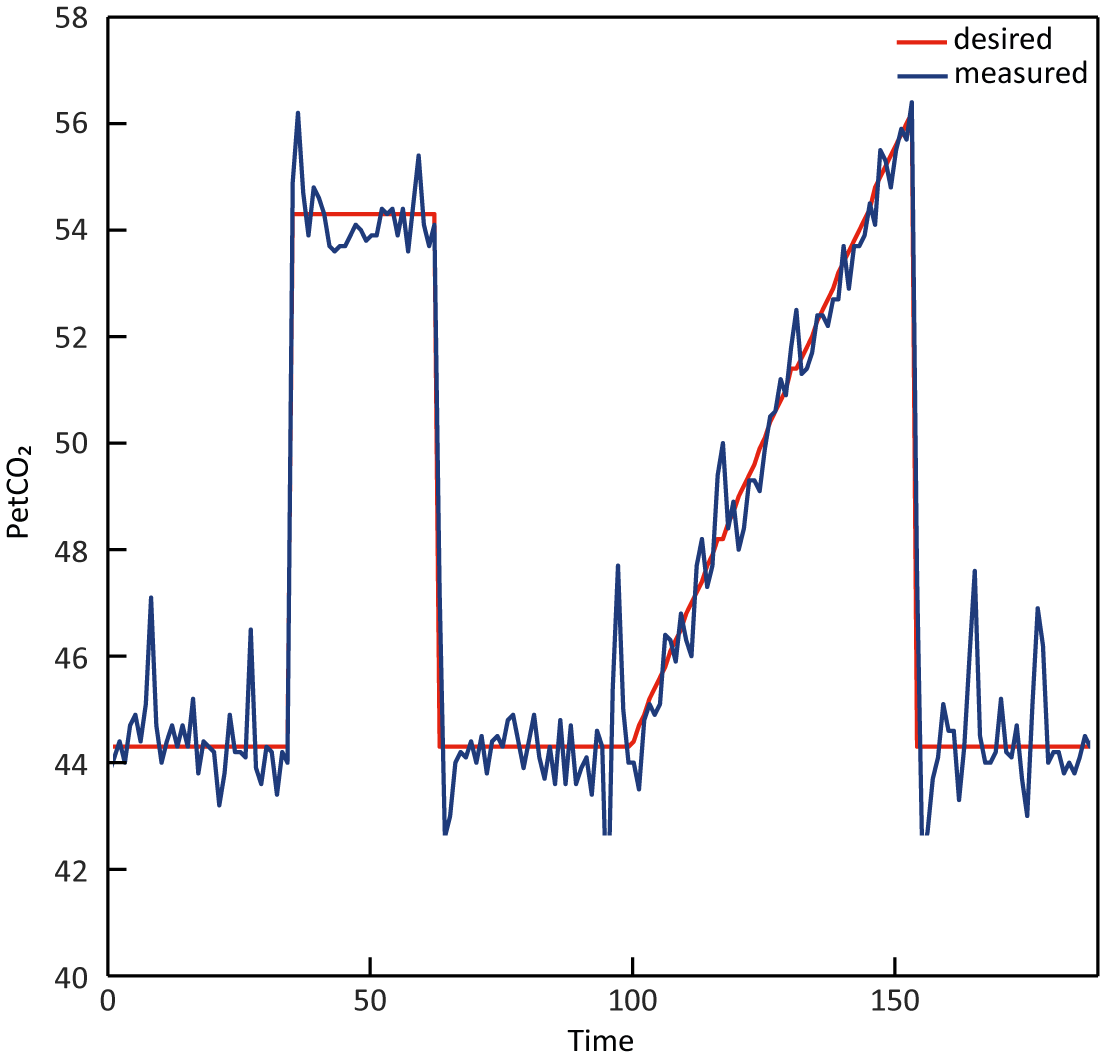
Figure 1. CO2
breathing trace of a representative subject during the breathing challenge.
The red and blue line indicate the desired versus actual measured PetCO2
values, respectively. The breathing challenge started with a block-shaped increase of PetCO2 10 mmHg relative to a
patients’ baseline for 90 seconds. After returning to baseline, a PetCO2
ramp increase of 12 mmHg relative to patients’ baseline was given for 180
seconds.
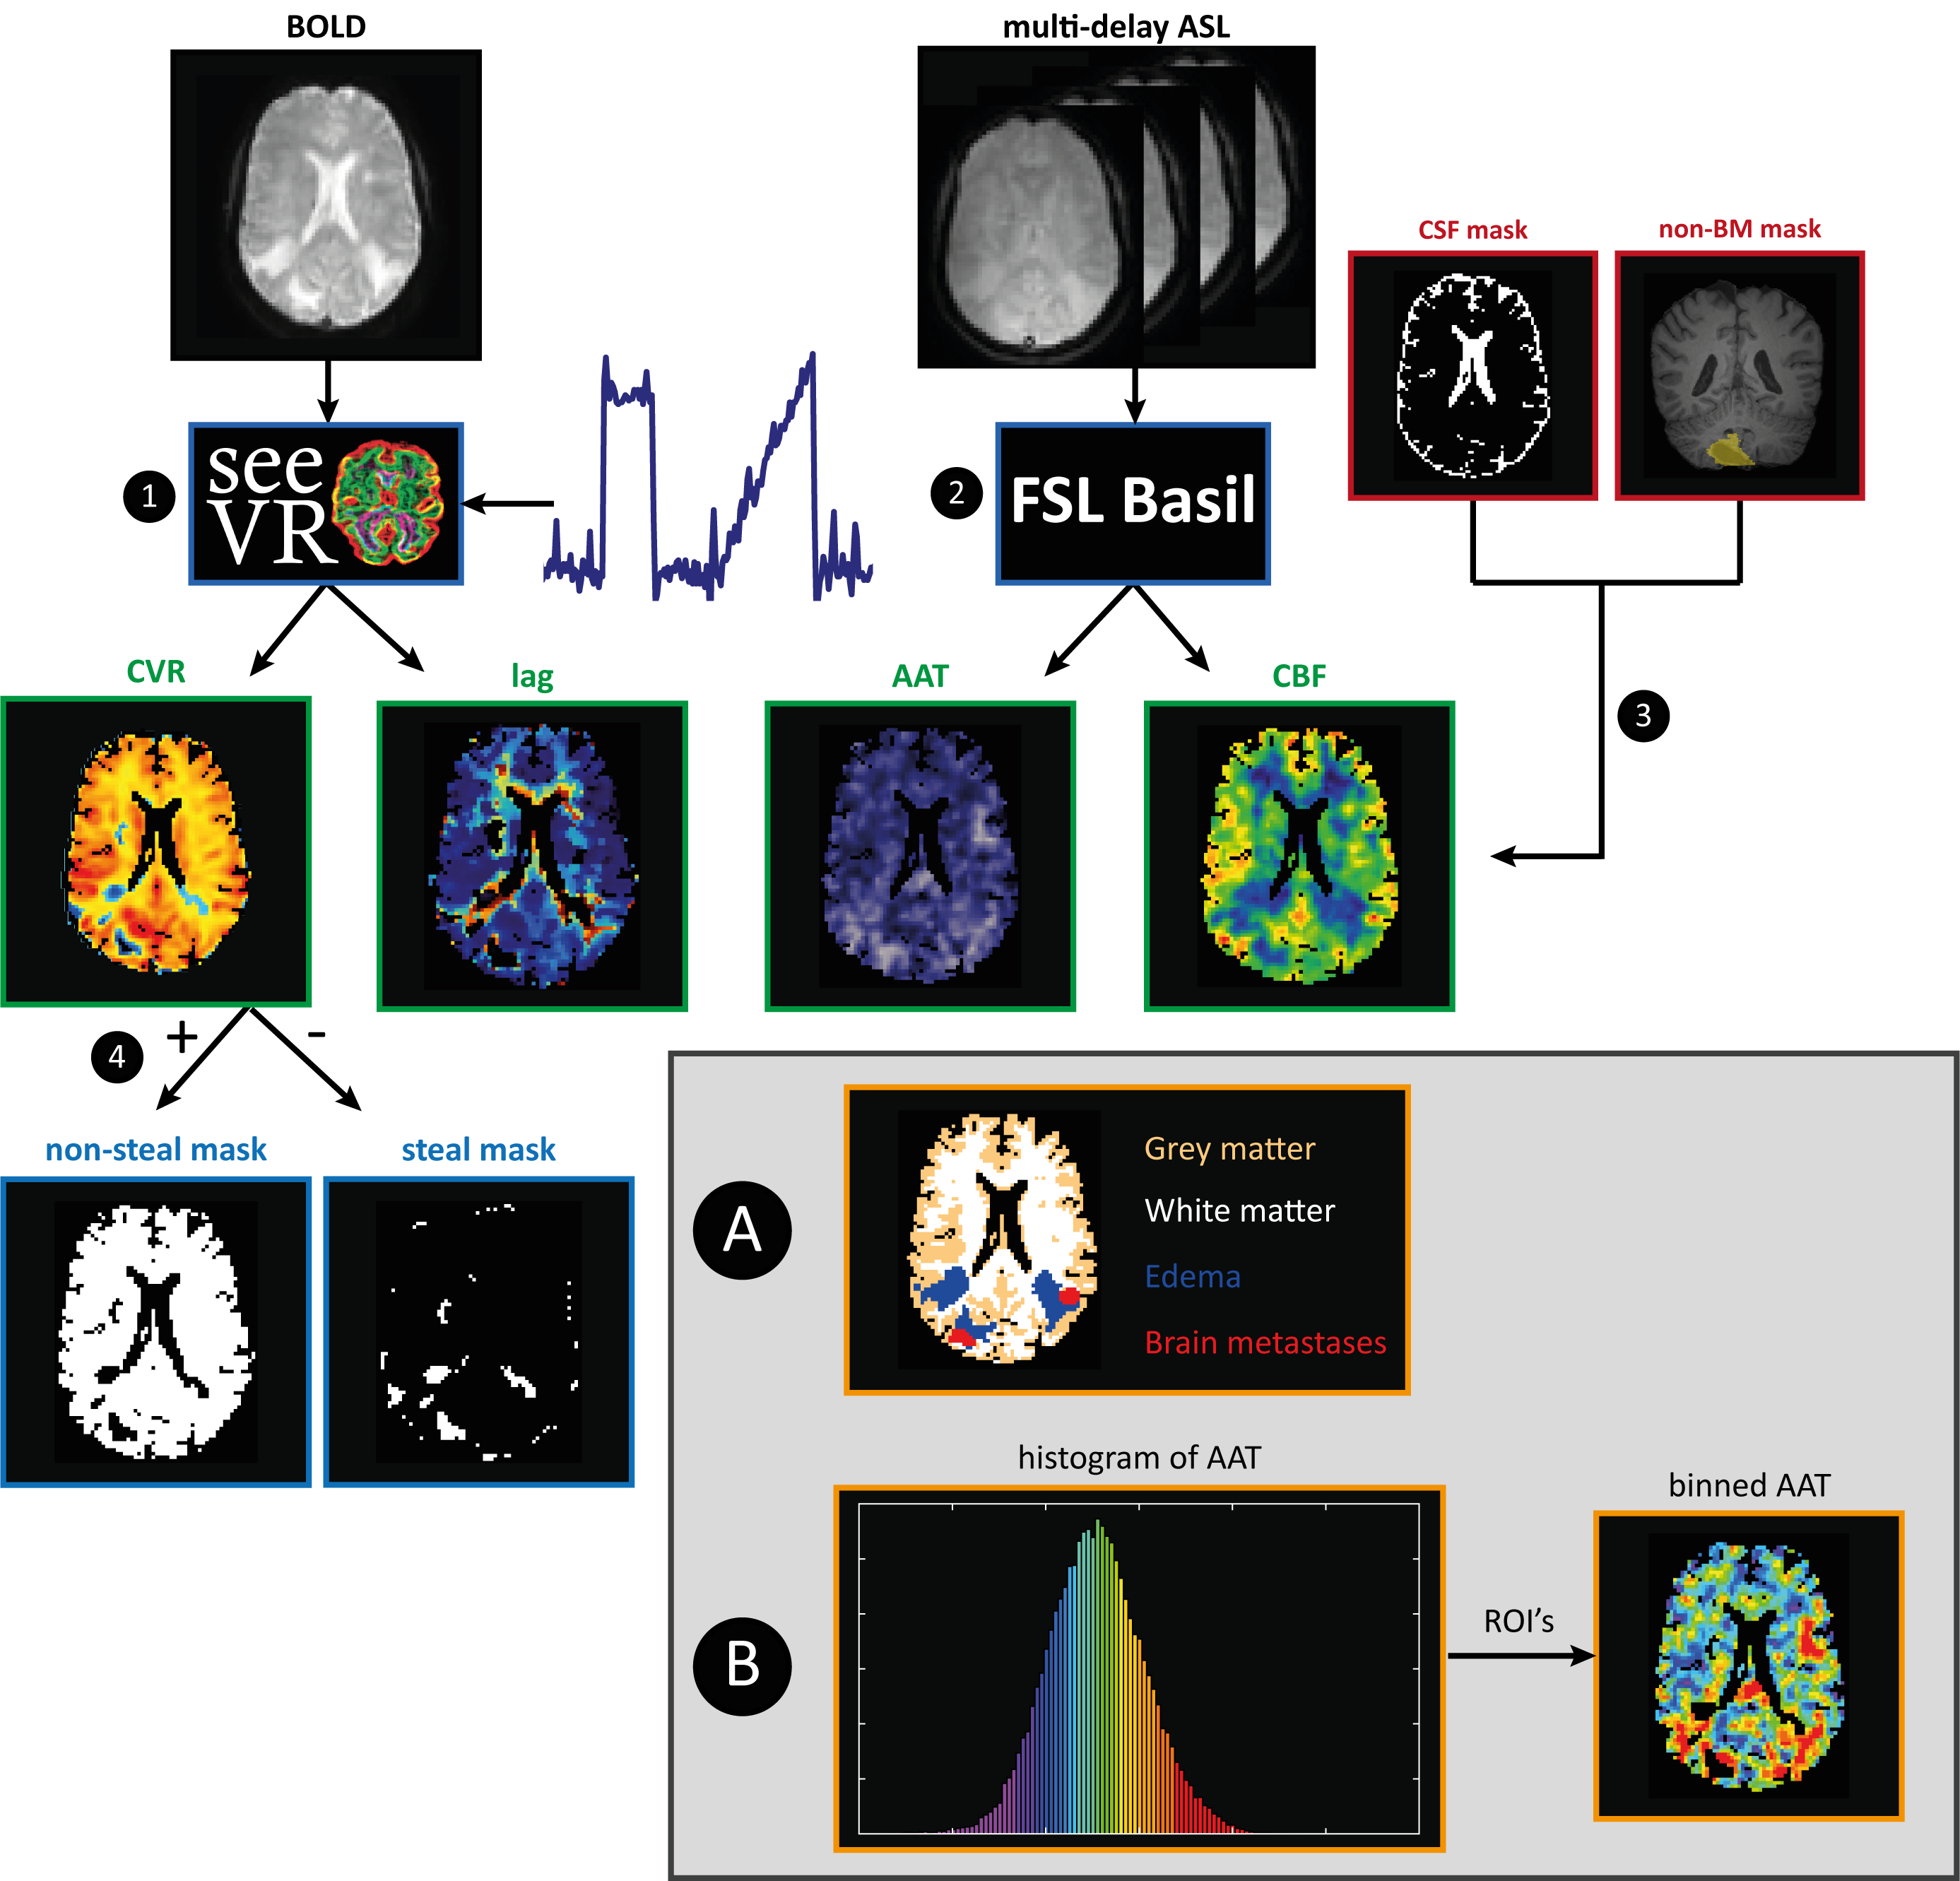
Figure 2. Data analysis steps for the BOLD and ASL data. After processing the BOLD and ASL data(1,2), CSF
and previously resected or irradiated BMs were excluded from all maps(3). The
brain was segmented into non-steal (+CVR) and steal (- CVR) regions of interest
(ROIs)(4). Analysis A: The brain was divided into GM, WM, edema and BMs ROIs,
for which mean and sd were calculated. Analysis B: the AAT data were sorted and
divided into ROIs each containing 5% of the sorted data (‘5%-bins’, visualized
by the histogram). For each hemodynamic parameter map the mean value for each
ROI was calculated.
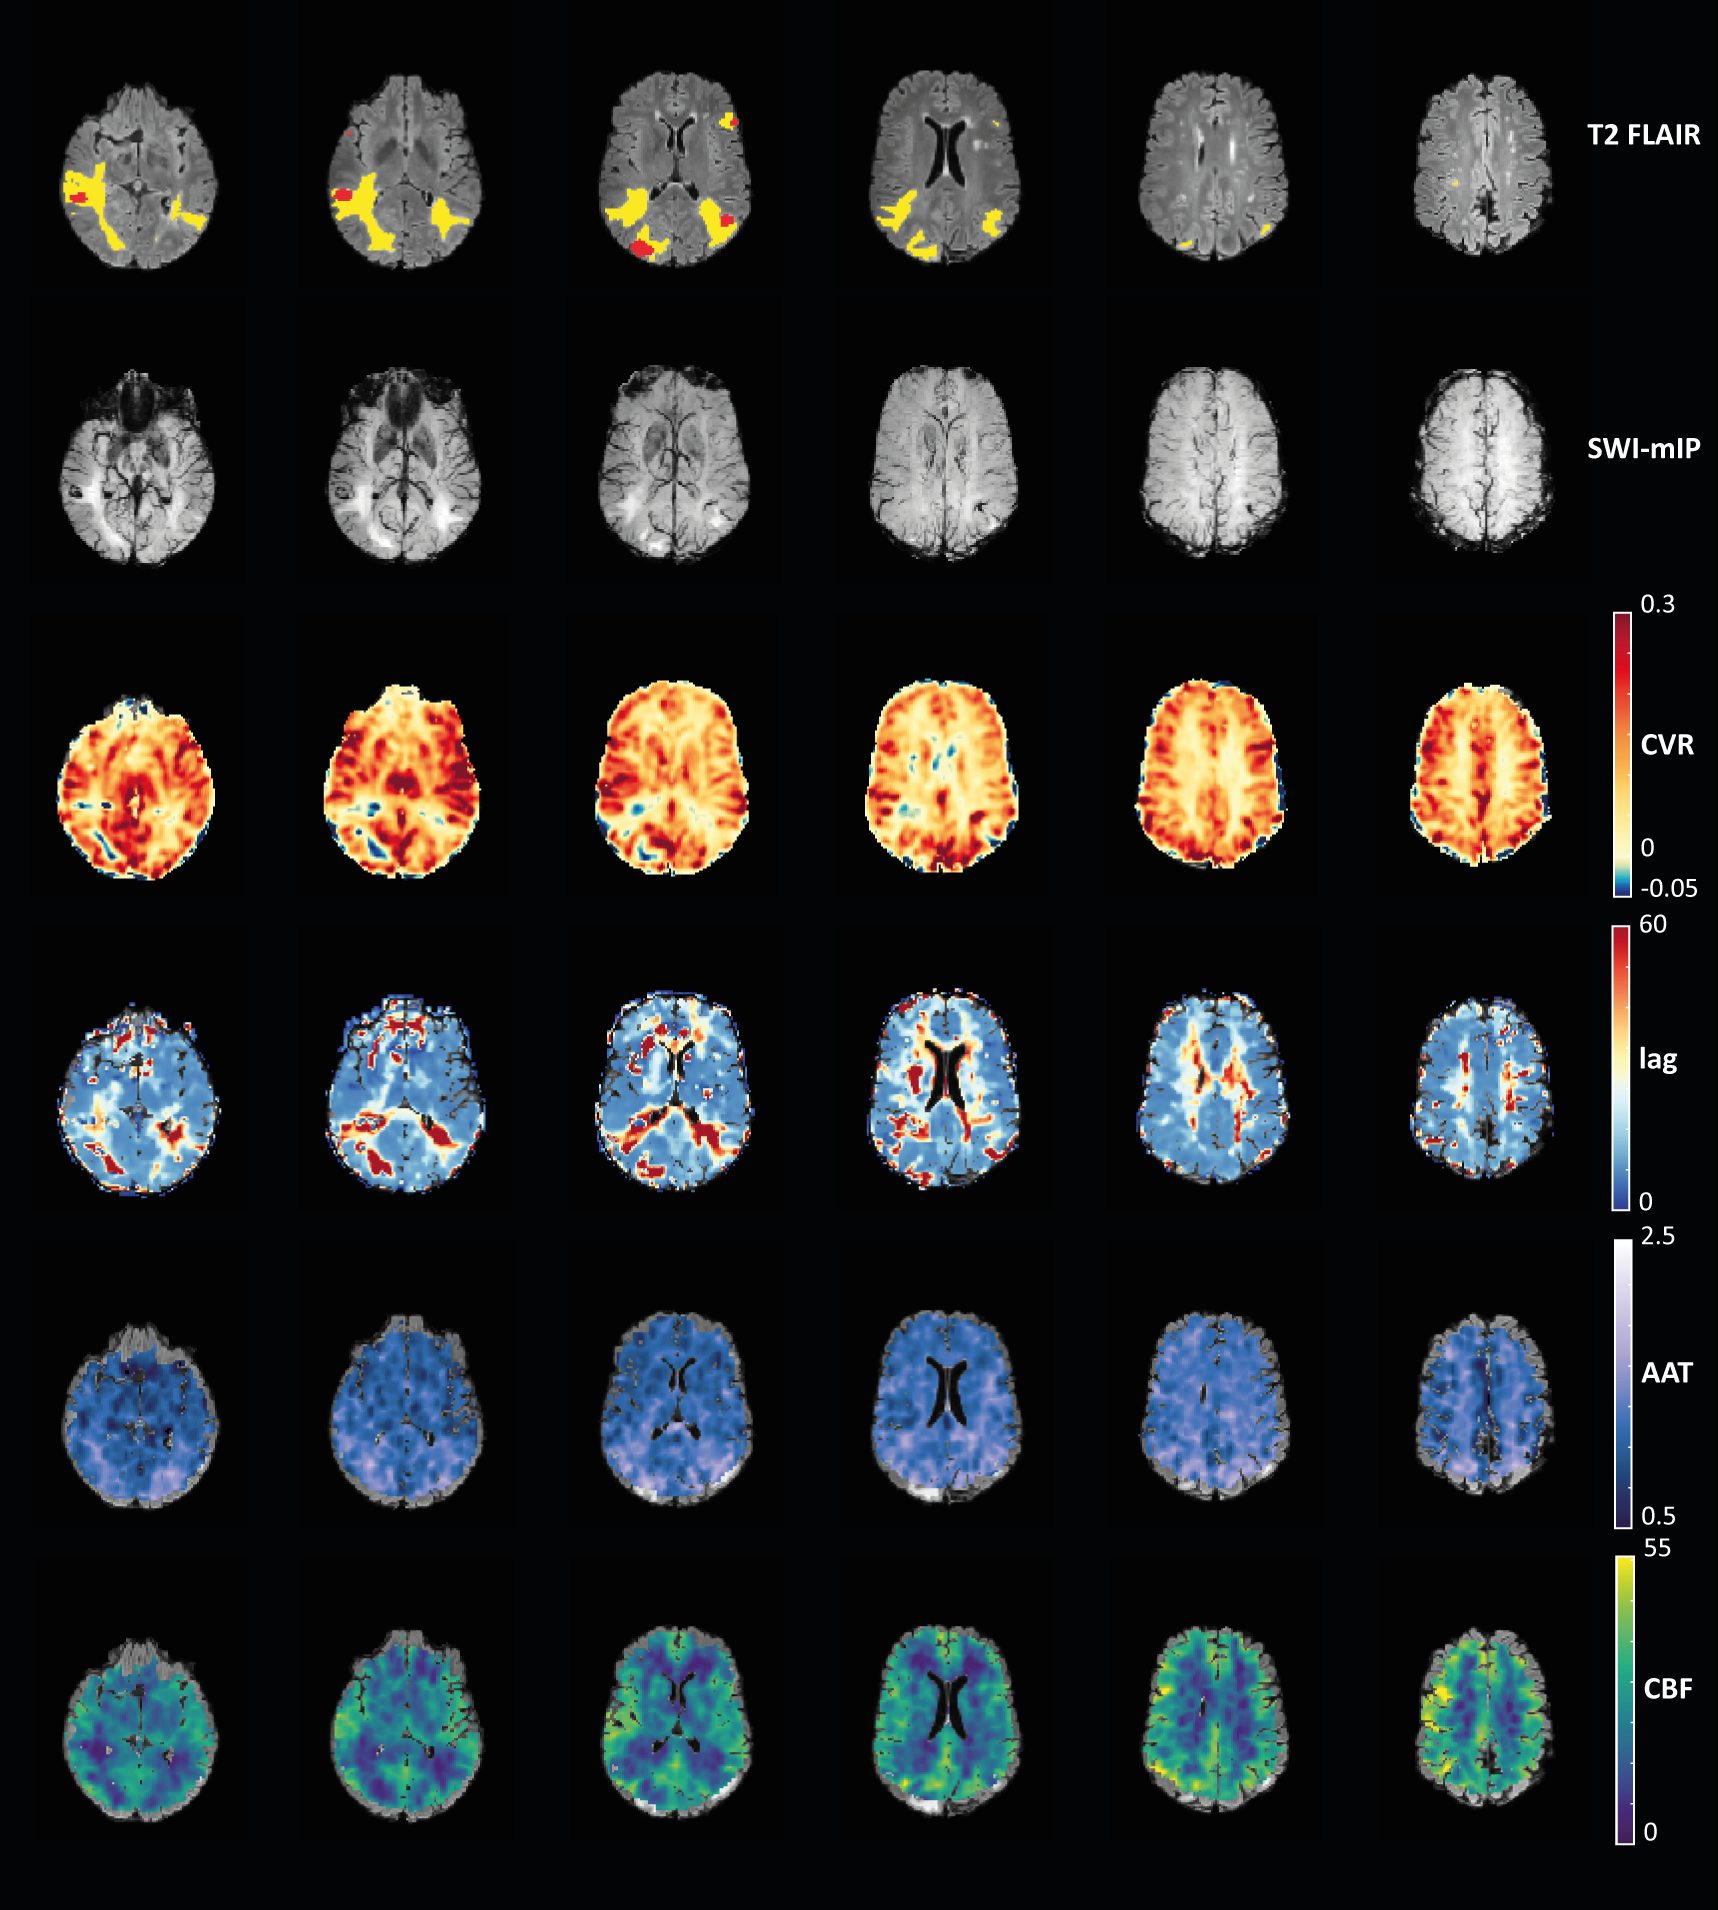
Figure 3. Visual comparison of hemodynamic
parameter maps of a representative subject. Red voxels on the T2
FLAIR represent the location of the BMs, and yellow voxels are regions with
edema. The minimum intensity projection (SWI-mIP) indicates the locations of
larger cerebral venous vessels.
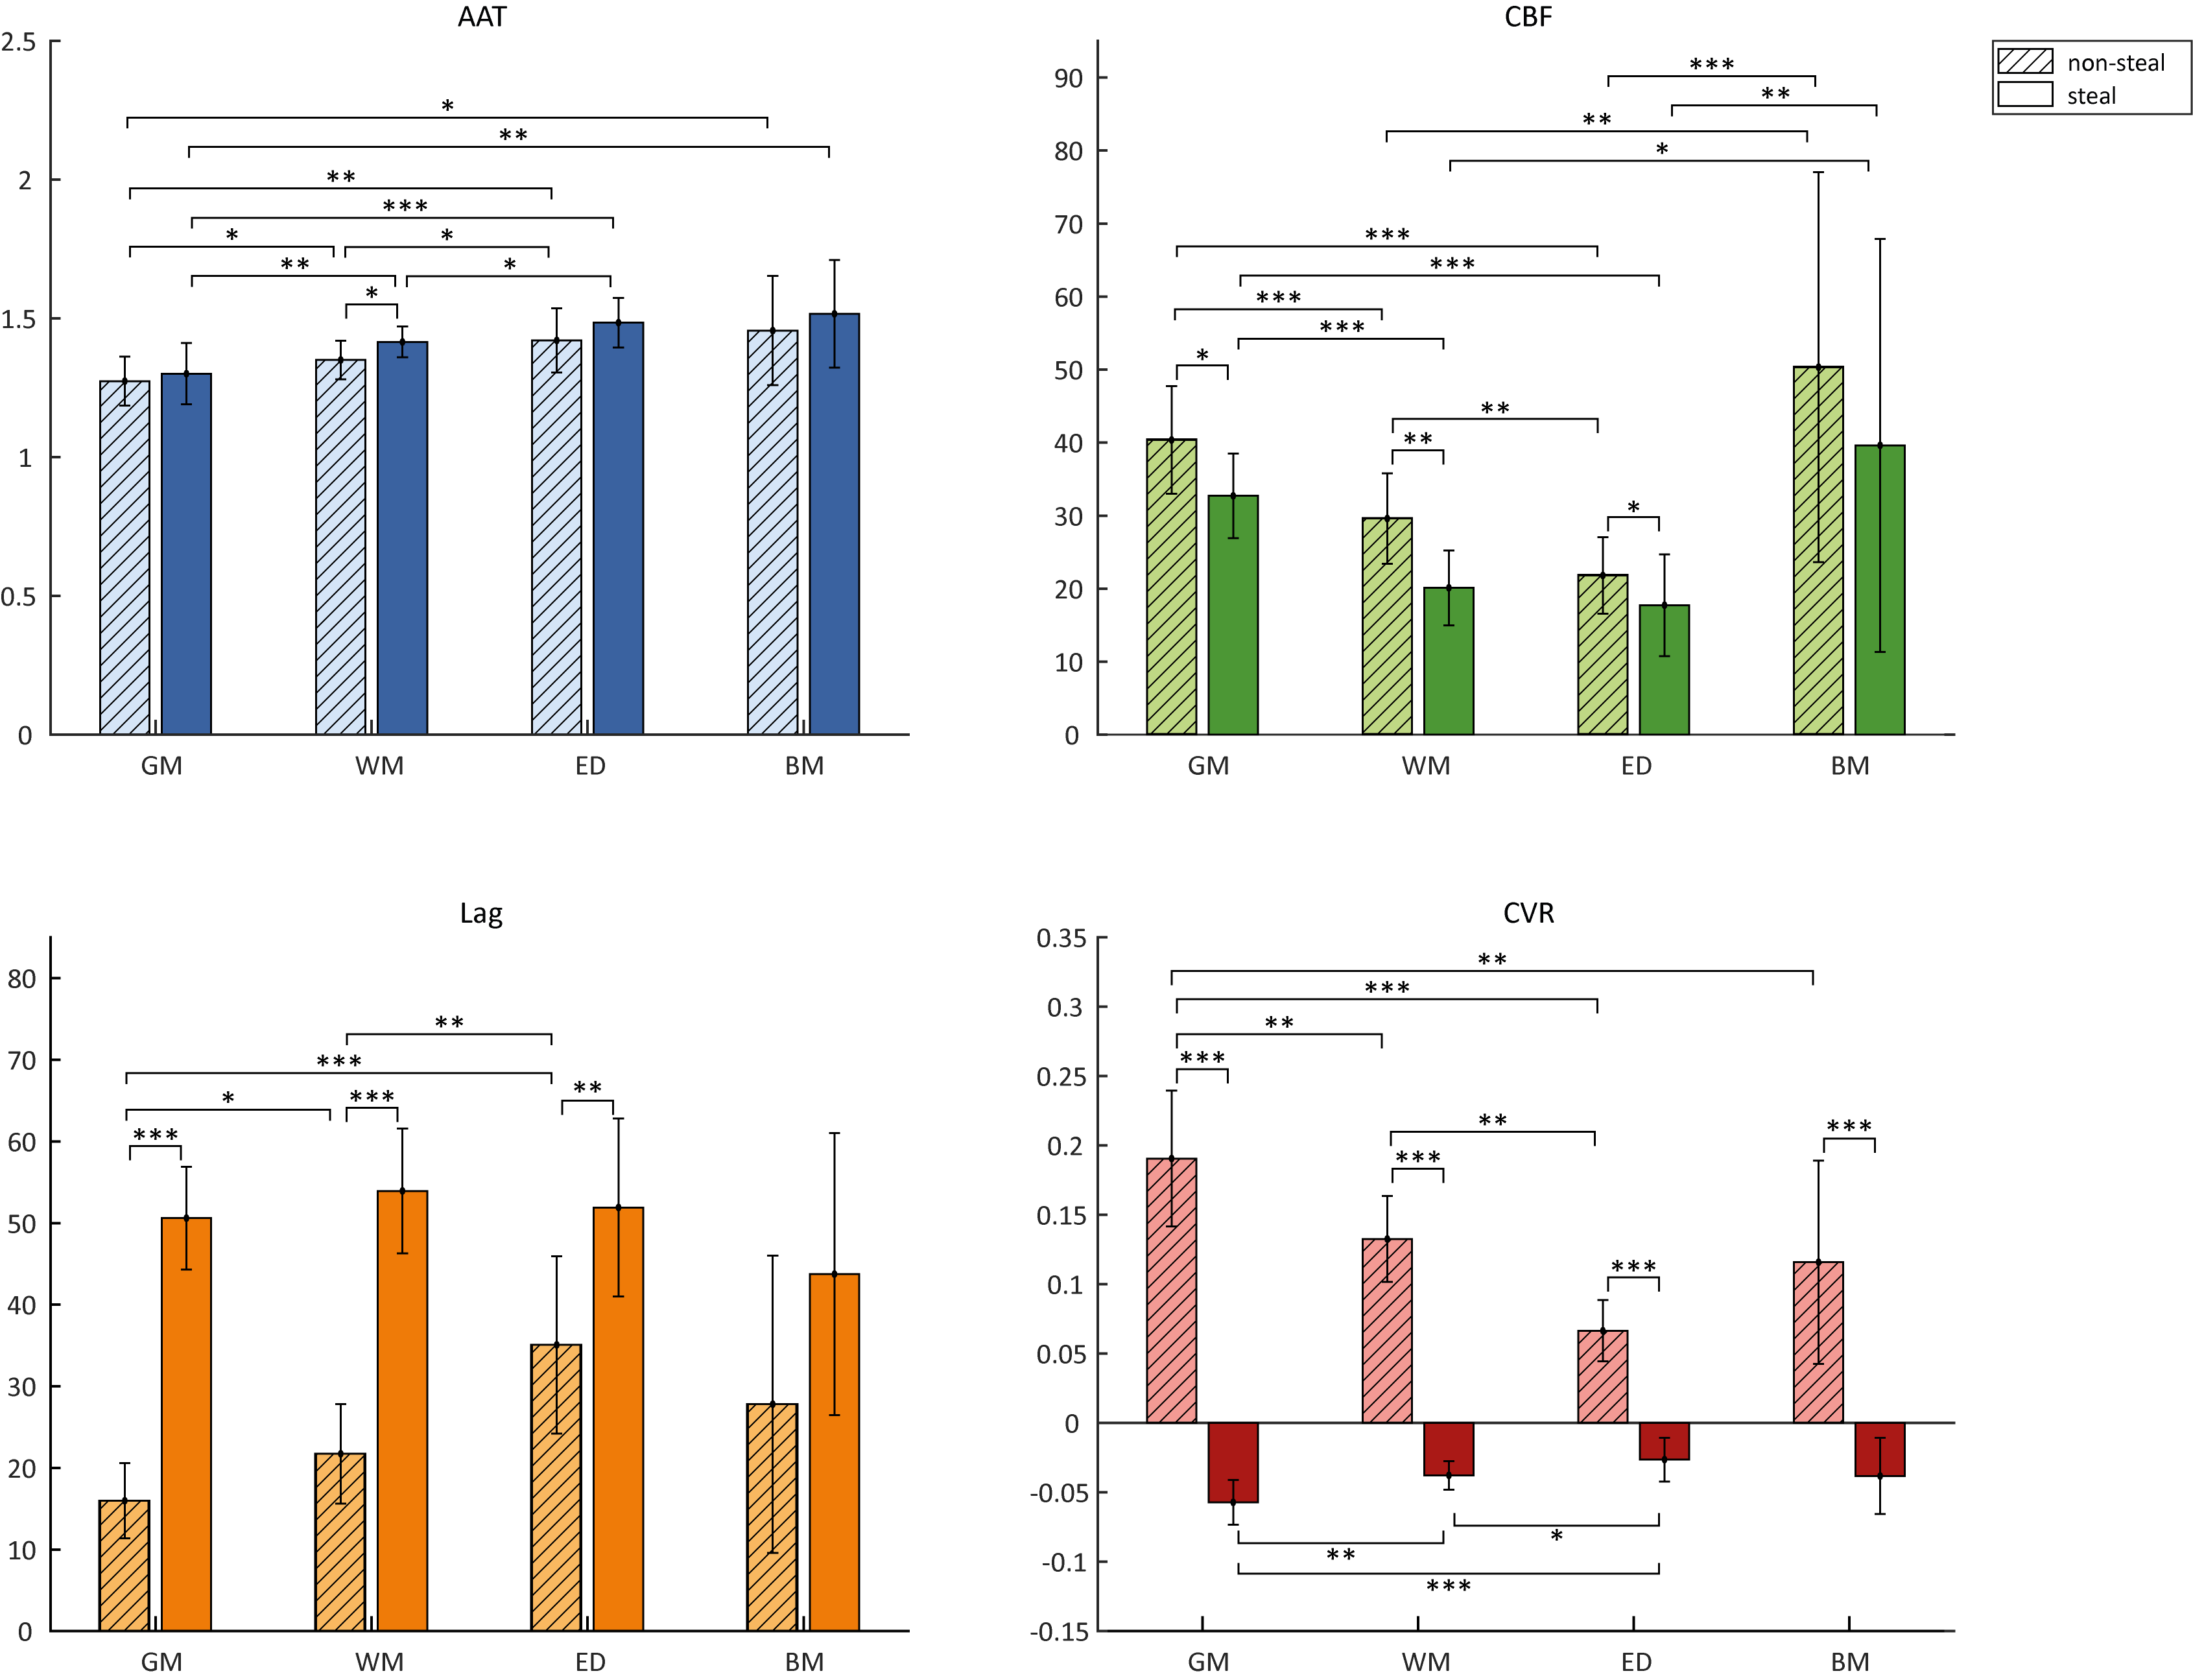
Figure 4. Group mean values per MRI metric (ASL-AAT, ASL-CBF, BOLD-lag and BOLD-CVR) and per tissue type (GM, WM, edema, BMs). Error bars represent the standard deviation. Asterisks indicate significant differences between group values with * p<.05, ** p<.01, *** p<.001.
Abbreviations: ED, edema; GM, grey matter; WM, white matter.
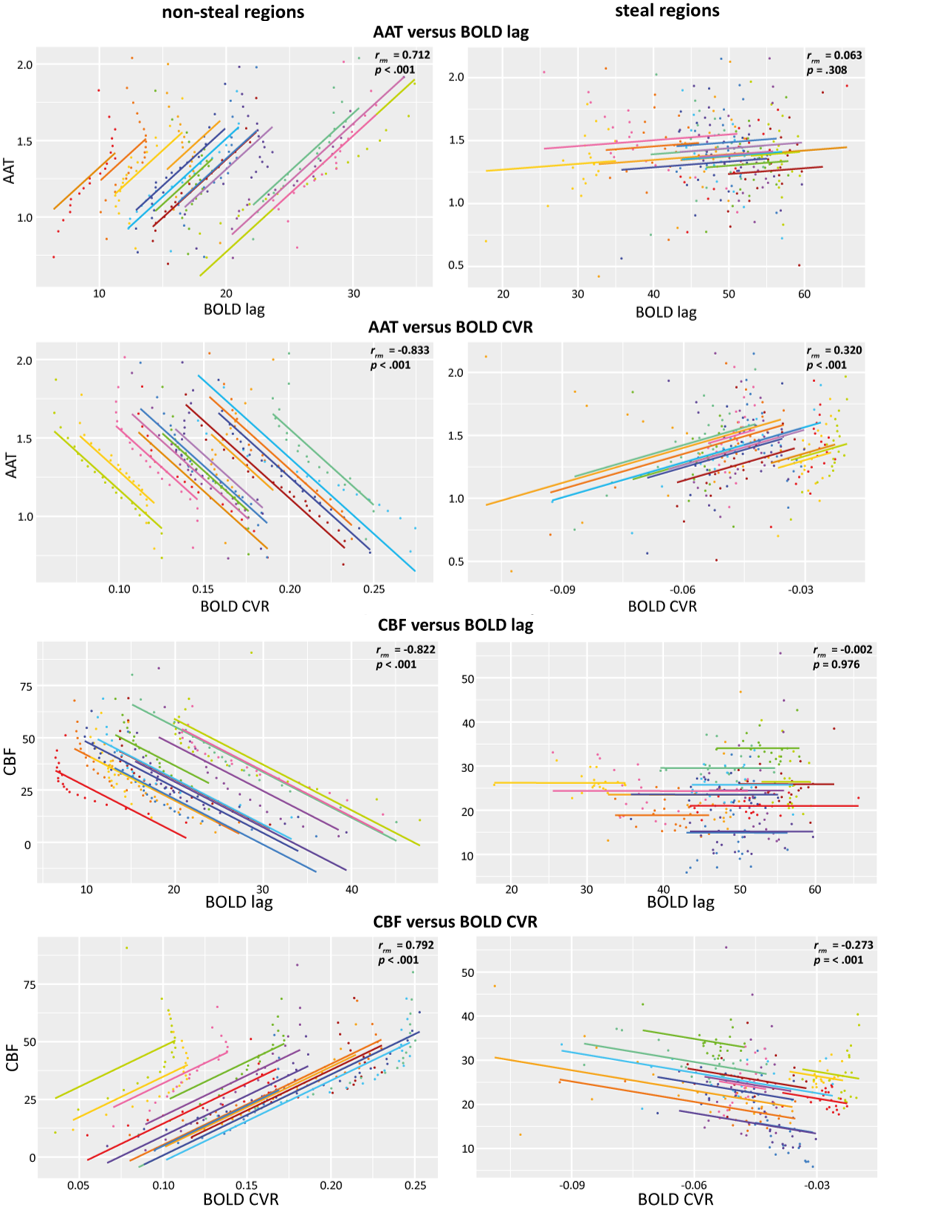
Figure 5. Repeated measures correlation plots
between different MRI metrics, using AAT-binned ROIs (top 4 panels) or
CBF-binned ROIs (lower 4 panels). Each color represents a different patient and the
lines represent the linear relationship between the MRI metrics in all
individuals. Statistics for each relationship are provided for each plot
separately.
DOI: https://doi.org/10.58530/2023/0877