0876
Cerebrovascular reactivity is a predictor of small vessel disease severity after one year in patients with mild stroke1Centre for Clinical Brain Sciences, University of Edinburgh, Edinburgh, United Kingdom, 2UK Dementia Research Institute, University of Edinburgh, Edinburgh, United Kingdom, 3Department of Neurology, West China Hospital of Sichuan University, Chengdu, China, 4Department of Medicine, University of Hong Kong, Hong Kong, Hong Kong, 5Department of Neurology, Shanghai Jiao Tong University, Shanghai, China, 6Edinburgh Imaging Facility RIE, University of Edinburgh, Edinburgh, United Kingdom
Synopsis
Keywords: Stroke, Blood vessels, Cerebrovacular reactivity
Small vessel disease (SVD) causes stroke and dementia, but its pathogenesis remains poorly understood. We measured cerebrovascular reactivity (CVR) in SVD patients with minor stroke using 3T BOLD MRI and investigated its relation to baseline and progression of SVD features after one year adjusting for age and vascular risk factors. Patients with lower CVR had higher baseline white matter hyperintensity (WMH) volume, more lacunes and microbleeds and lower brain volume. After one year, patients with lower baseline CVR had increased WMH burden. In conclusion, CVR impairment in SVD patients is associated with higher SVD burden and predicts worsening of SVD.INTRODUCTION
Impaired cerebrovascular reactivity (CVR) in patients with small vessel disease (SVD) is associated with cross-sectional white matter hyperintensity (WMH) burden.1–3 One study found lower CVR in WMH compared to contralateral normal-appearing white matter (NAWM).4 However, less is known about the relationship between CVR and other SVD features including lacunes, microbleeds and atrophy. Moreover, how baseline CVR impairment relates to longitudinal changes in SVD features has received little attention, although one study reported lower initial CVR in NAWM tissue that progressed into WMH over one year compared with contralateral NAWM.5 Therefore, we analysed cross-sectional and longitudinal relationships between baseline CVR and SVD features in patients with SVD.METHODS
We recruited patients with SVD presenting with mild ischaemic stroke (modified Rankin score ≤ 2) in an on-going longitudinal study (Mild Stroke Study 3: ISRCTN 12113543).6Within three months of index stroke, patients underwent a baseline 3T MRI scan (Siemens Prisma) where we acquired structural images (T1-weighted: TR/TE/TI=2500/4.37/1100ms, 1.0x1.0x1.0mm3; T2-weighted: TR/TE=3200/408ms, 0.9x0.9x0.9mm3; FLAIR: TR/TE/TI=5000/388/1800ms, 1.0x1.0x1.0mm3) and CVR-BOLD images (TR/TE=1550/30ms, 2.5x2.5x2.5mm3).6 The CVR-BOLD scan was acquired during a hypercapnic challenge alternating between medical air and 6% CO2-enriched air (2-3-2-3-2 minutes) while measuring end-tidal CO2 (EtCO2).6,7 Structural scans were repeated one year later.
Tissue segmentations were generated using an in-house processing pipeline that combines FSL8 and FreeSurfer9,10 outputs and were manually corrected.6 WMH and brain volumes were normalised by the intracranial volume (ICV).
We processed CVR in three regions-of-interest (ROIs: subcortical grey matter (SGM), NAWM and WMHs) by computing their mean BOLD signal and modelling them as follows:7,11
$$BOLD_{signal}=B_0+B_t\cdot t+B_{CVR}\cdot EtCO2_{shifted}+\epsilon$$
where the EtCO2 time shift minimised the sum of squared residuals. CVR was computed as:
$$CVR=\frac{B_{CVR}}{BOLD_0}\times 100$$
where BOLD0 is the BOLD baseline signal.
In the cross-sectional analyses, we modelled each SVD feature of interest at baseline as a linear function of baseline CVR. The SVD features considered were WMH and brain volumes and visually-rated number of lacunes and microbleeds. In the longitudinal analyses, we modelled each SVD feature of interest at one-year follow-up as a linear function of CVR and the SVD feature at baseline. All models were adjusted for age, sex and vascular risk factors. To ensure normality of the model residuals, we applied a log10-transform to the WMH volumes. We reported mean regression coefficients between SVD features of interest at one-year follow-up and CVR along with 95% confidence intervals and p-values.
RESULTS
We recruited 208 patients of which 182 had processable CVR data at baseline (1 withdrawal, 15/208 did not undergo the scan, 11/208 excluded from analysis due to visible motion artefacts or poor mask seal). Brain volumes from 8 participants were not final, therefore excluded from analysis. Of 208 patients, 36 did not have available data at one-year follow-up (2 withdrawals, 4 unable to attend visit, 13 declined scans and/or had a phone visit instead, 17 participants not yet acquired/processed). 153 datasets were included in the longitudinal analyses. 4, respectively 5, participants had unprocessed lacunes/microbleeds at follow-up.Participants (n=182, 68% male) had median age [IQR] of 68.2 [56.4, 75.4] years and median baseline CVR of 0.171 [0.135, 0.207], 0.041 [0.032, 0.052] and 0.040 [0.024, 0.066] %/mmHg in SGM, NAWM and WMHs respectively. At baseline, patients had median raw WMH volume of 8.09 ml (0.51 [0.24, 1.14] %ICV), median brain volume of 1069 ml (67.2 [64.4, 70.5] %ICV), 2 [1, 3] lacunes, 0 [0, 0] microbleeds. After one year, we noted median increase in WMH volume of 0.32 ml (0.019 [-0.032, 0.123] %ICV), change in brain volume of -15.8 ml (-1.0 [-1.7, -0.4] %ICV) and no change in number of lacunes or microbleeds (Table 1).
At baseline, patients with lower CVR in all ROIs had greater overall WMH volume (BSGM=-1.58 [-2.75, -0.42] log10(%ICV) per %/mmHg), more lacunes (BSGM=-17.47 [-25.23, -9.72] lacune per %/mmHg), more microbleeds (BSGM=-15.41 [-30.04, -0.78] microbleed per %/mmHg). Patients with lower CVR in WMHs also had lower brain volume (BWMH=34.92 [21.07, 48.78] %ICV per %/mmHg). Excluding patients with low number of WMH voxels resulting in noisy BOLD signal from analysis did not modify this relationship. After one year, patients with lower baseline CVR in all ROIs had greater increase in WMH volume (BNAWM=-1.20 [-2.25, -0.16] log10(%ICV) per %/mmHg) even after adjusting for WMH severity at baseline. We found no relationship between CVR and change in lacune/microbleed numbers or with brain volume change (Table 2, Figures 1&2).
DISCUSSION
CVR impairment in SVD patients was associated with worse SVD features at baseline. Lower baseline CVR in both normal-appearing and damaged white matter predicted further tissue damage after one year. The effect was stronger in NAWM suggesting underlying damages were not visible on structural images at baseline. We did not find associations between CVR at baseline and change in brain volume or change in number of lacunes/microbleeds, though the last observations could be due to the small changes in those features over one year.CONCLUSION
Overall, lower CVR was associated with worse SVD features and predicted worsening of SVD after one year, even after adjusting for age, sex and vascular risk factors. The strength of associations varied between tissue classes and SVD feature metrics. Those results are preliminary as the follow-up visits are still on-going.Acknowledgements
This work was funded by the Medical Research Council (MRC) and UK Dementia Research Institute (UK DRI), which receives its funding from UK DRI Ltd which is funded by the Medical Research Council, Alzheimer’s Society and Alzheimer’s Research UK. This work also received funding from the European Union Horizon 2020 (PHC-03-15, project no. 666881 ‘SVDs@Target’), the Fondation Leducq Transatlantic Network of Excellence for the Study of Perivascular Spaces in Small Vessel Disease (ref. no. 16CVD 05), and the Scottish Chief Scientist Office through the NHS Lothian Research and Development Office (MJT).
We thank the participants, radiographers and professional support staff for their contribution to this work.
References
1. Blair GW, Thrippleton MJ, Shi Y, et al. Intracranial hemodynamic relationships in patients with cerebral small vessel disease. Neurology. 2020;94(21):e2258-e2269. doi:10.1212/WNL.0000000000009483
2. Stringer MS, Blair GW, Hamilton I, et al. A Comparison of CVR Magnitude and Delay Assessed at 1.5 and 3T in Patients With Cerebral Small Vessel Disease. Front Physiol. 2021;12((Stringer, Blair, Shi, Hamilton, Doubal, Marshall, Thrippleton, Wardlaw) Centre for Clinical Brain Sciences, University of Edinburgh, Edinburgh, United Kingdom):644837. doi:10.3389/fphys.2021.644837
3. Atwi S, Shao H, Crane DE, et al. BOLD-based cerebrovascular reactivity vascular transfer function isolates amplitude and timing responses to better characterize cerebral small vessel disease. NMR in Biomedicine. 2019;32(3):e4064. doi:10.1002/nbm.4064
4. Sam K, Crawley AP, Poublanc J, et al. Vascular dysfunction in leukoaraiosis. Am J Neuroradiol. 2016;37(12):2258-2264. doi:10.3174/ajnr.A4888
5. Sam K, Conklin J, Poublanc J, et al. Development of White Matter Hyperintensity Is Preceded by Reduced Cerebrovascular Reactivity. Ann Neurol. 2016;80(2):277-285. doi:10.1002/ana.24712
6. Clancy U, Garcia DJ, Stringer MS, et al. Rationale and design of a longitudinal study of cerebral small vessel diseases, clinical and imaging outcomes in patients presenting with mild ischaemic stroke: Mild Stroke Study 3. European Stroke Journal. Published online June 5, 2020:2396987320929617. doi:10.1177/2396987320929617
7. Thrippleton MJ, Shi Y, Blair G, et al. Cerebrovascular reactivity measurement in cerebral small vessel disease: Rationale and reproducibility of a protocol for MRI acquisition and image processing. International Journal of Stroke. 2018;13(2):195-206. doi:10.1177/1747493017730740
8. Zhang Y, Brady M, Smith S. Segmentation of brain MR images through a hidden Markov random field model and the expectation-maximization algorithm. IEEE Transactions on Medical Imaging. 2001;20(1):45-57. doi:10.1109/42.906424
9. Fischl B, Salat DH, Busa E, et al. Whole Brain Segmentation: Automated Labeling of Neuroanatomical Structures in the Human Brain. Neuron. 2002;33(3):341-355. doi:10.1016/S0896-6273(02)00569-X
10. Fischl B, Salat DH, van der Kouwe AJW, et al. Sequence-independent segmentation of magnetic resonance images. NeuroImage. 2004;23:S69-S84. doi:10.1016/j.neuroimage.2004.07.016
11. Liu P, De Vis JB, Lu H. Cerebrovascular reactivity (CVR) MRI with CO2 challenge: A technical review. NeuroImage. 2019;187:104-115. doi:10.1016/j.neuroimage.2018.03.047
Figures
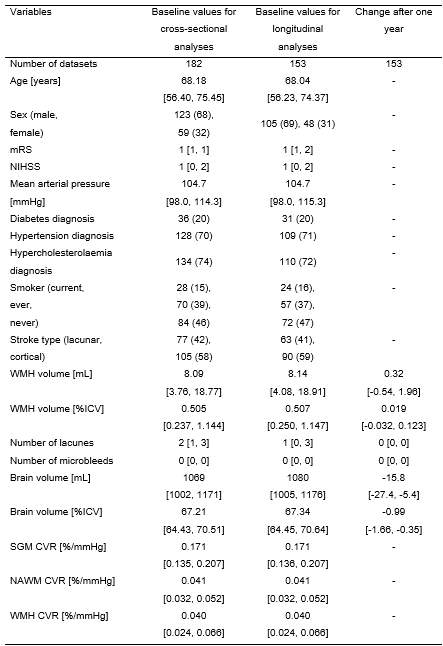
Table 1. Population characteristics for the SGM, NAWM and WMH CVR analyses. The distributions are reported for both cross-sectional and longitudinal analyses along with the changes observed after one year. Non-binary variables are reported as median [IQR] and binary variables and the smoker variable as number (%).

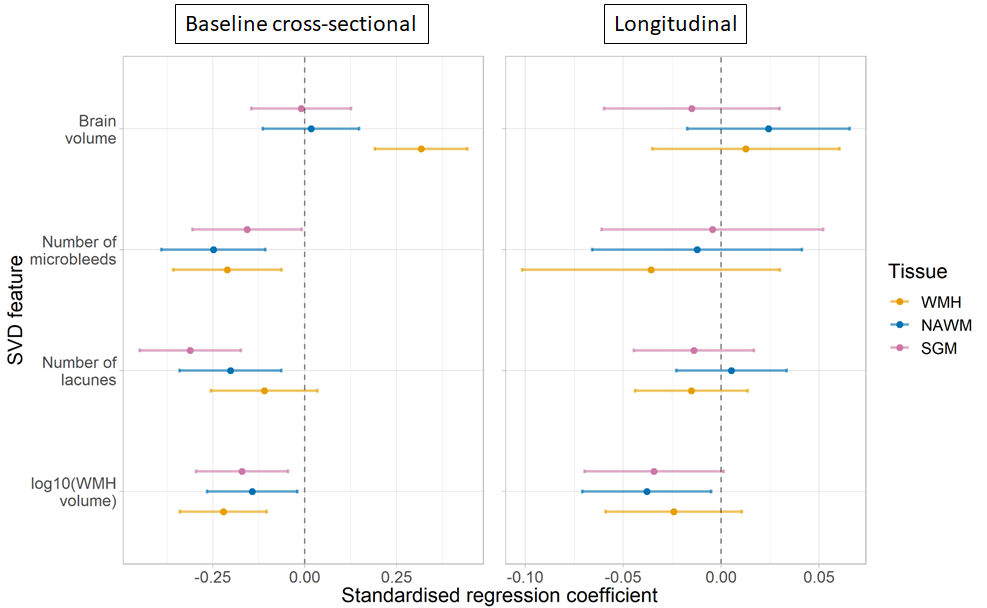
Figure 1. Standardised regression coefficients between CVR and quantitative SVD features. The results are shown for CVR in SGM (pink), NAWM (green) and WMHs (blue) for the cross-sectional and longitudinal analyses. The dots represent the mean standardised coefficients and the horizontal lines the associated 95% confidence intervals. The vertical dashed line emphasises a zero-valued coefficient.
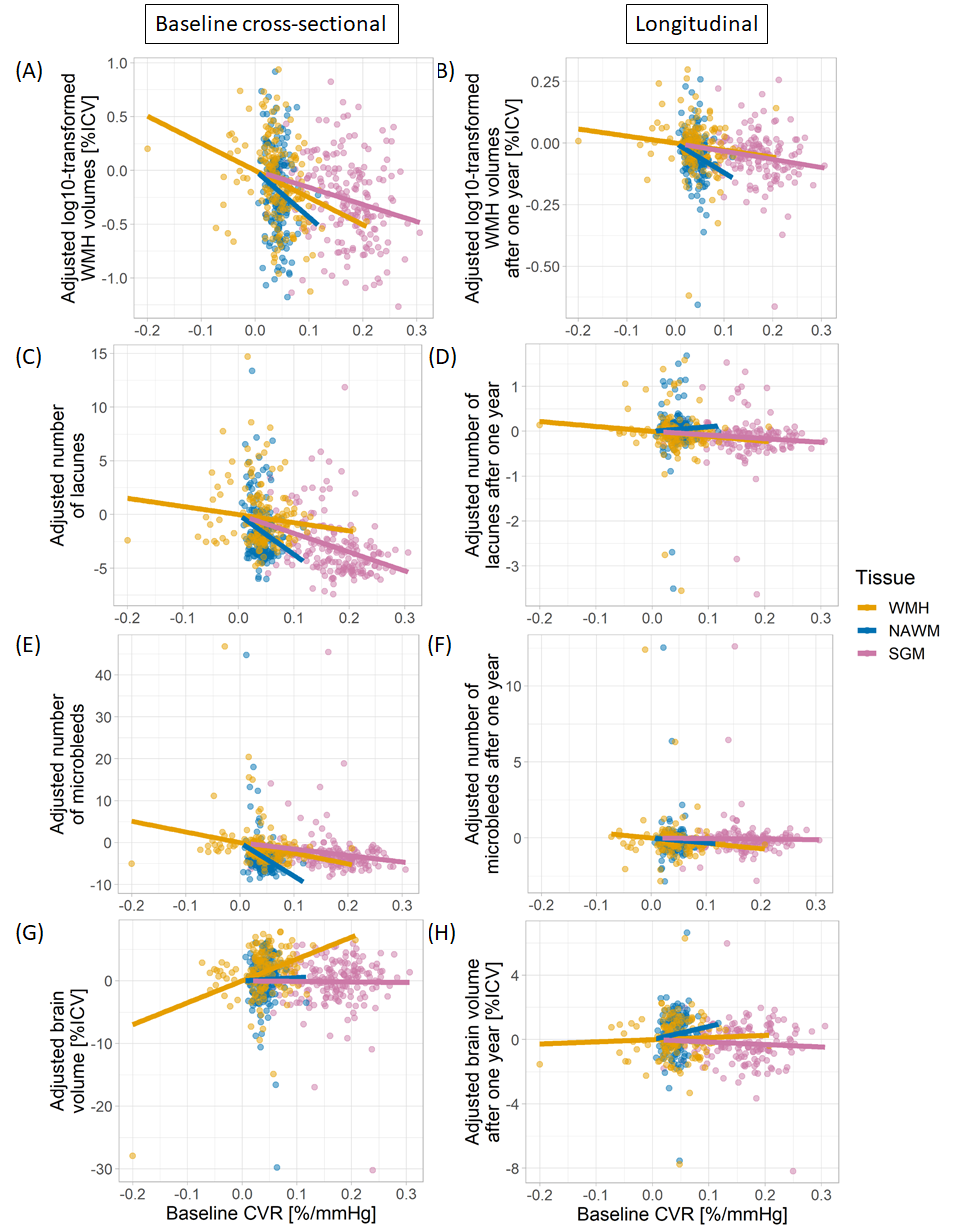
Figure 2. Relationships between CVR and adjusted quantitative SVD features. SVD features were adjusted for age, sex and vascular risk factors. Moreover, for the longitudinal analyses, SVD features after one year were also adjusted for their baseline values. The results are shown for CVR in SGM (pink), NAWM (green) and WMHs (blue) for the cross-sectional (1st column) and longitudinal (2nd column) analyses.