0857
Quantifying Cardiogenic Oscillations of Hyperpolarized 129Xe Gas Exchange MR Spectra in a Healthy Reference Cohort
Anna Costelle1, Junlan Lu1, Aryil Bechtel2, Elianna Bier2, Sakib Kabir3, Joseph Mammarrappallil3, Haoran Dai1, David Mummy3, and Bastiaan Driehuys1,2,3
1Medical Physics, Duke University, Durham, NC, United States, 2Biomedical Engineering, Duke University, Durham, NC, United States, 3Radiology, Duke University, Durham, NC, United States
1Medical Physics, Duke University, Durham, NC, United States, 2Biomedical Engineering, Duke University, Durham, NC, United States, 3Radiology, Duke University, Durham, NC, United States
Synopsis
Keywords: Hyperpolarized MR (Gas), Spectroscopy
Hyperpolarized 129Xe gas exchange MR spectra exhibit cardiogenic oscillations that have been found to distinguish between groups of cardiopulmonary diseases. Specifically, oscillations in the amplitude of the 129Xe red blood cell (RBC) resonance can differentiate pre-capillary and post-capillary pulmonary hypertension. Before diagnostic relevance can be established, these oscillations must be robustly quantified and definitive reference values must be determined. Here, we compare oscillation quantification using a constrained peak-finding algorithm against results from conventional sine fitting. We then employ a well-curated healthy cohort to establish reference values for cardiogenic oscillations in 129Xe RBC spectral parameters, using both methods.Introduction
As hyperpolarized 129Xe diffuses from airspaces in the lungs to membrane tissues, and then to red blood cells (RBCs), it exhibits distinct resonances corresponding to each of these gas exchange compartments. The ratio of the RBC to membrane amplitudes measures gas exchange efficiency, and the RBC chemical shift probes blood oxygenation levels[1]. By repeatedly acquiring 129Xe MR spectra every 15 ms, it is possible to observe cardiogenic oscillations in the RBC resonance, which provides insights into pulmonary hemodynamics[2]. The relationship of RBC oscillations to the cardiac cycle is illustrated in Figure 1. RBC amplitude oscillations are enhanced in patients with post-capillary pulmonary hypertension (PH) and diminished in pre-capillary PH[3]. Therefore, these static and dynamic spectral parameters derived from 129Xe MR spectroscopy may provide a means to non-invasively characterize different cardiopulmonary disease phenotypes. This process requires both a robust means of measurement quantification and established, definitive healthy reference values. Previous quantification methods have used simple sine fitting to characterize oscillations, which effectively captures periodicity but often fails to accurately capture the shape of each oscillation. Here we compare this approach with a peak-finding algorithm that identifies the median peak and trough amplitudes within each cardiac cycle. For each method, we then employ a well-curated healthy cohort (age 18-30) and rigorous exclusion criteria to establish reference values for the static RBC to membrane ratio and RBC chemical shift as well dynamic oscillations in RBC amplitude, chemical shift, linewidth, and phase.Methods
Healthy subjects (n=26) age 18-30 (mean 25.54 ± 3.26) underwent pulmonary function testing (PFT), hemoglobin assessment, and one or more hyperpolarized 129Xe MRS scans according to the consortium protocol (500 FIDs acquired, flip angle≈20°, TR=15 ms ). The dynamic spectra were processed as previously described[2], and oscillations were quantified using conventional sine fitting as well as a peak-finding algorithm that identified each peak and trough within a cardiac cycle and computed their median. An example of each method is shown in Figure 2. Subjects were excluded if any PFTs were below 80% of predicted, to avoid including subjects with undiagnosed cardiopulmonary abnormalities. Moreover, 129Xe MRS scans were required to have an RBC signal to noise ratio (SNR) greater than 118 to ensure sufficient dynamic scan quality[4]. For subjects with multiple scans, each metric was averaged. For each spectral parameter, the interquartile range (IQR) was computed, and outliers were defined as measurements at least 1.5×IQR below the first quartile or above the third quartile . Outlying values were removed if a parameter was not found to be significantly correlated to any other parameters. Application of all exclusion criteria resulted in 19 RBC shift observations, 18 measures of RBC linewidth oscillations for the sine fitting method, and 20 observations of all other parameters. A Shapiro-Wilk test was performed on each parameter and normality was assumed if the test statistic was non-significant at α=0.01. A two-sample t-test (two-tail) was then performed on the dynamic reference values associated with each method to verify that the choice of dynamic fit (sine or peaks) impacts the healthy reference value.Results
Outlying values were found in the static RBC chemical shift, peak-finding RBC chemical shift oscillation, and sine fit RBC linewidth oscillation datasets. Static RBC chemical shift and sine fit RBC linewidth oscillations exhibited no statistically significant correlation to any other metrics. So, outliers were removed from these datasets, but were kept in the peak-finding RBC chemical shift oscillation dataset. No distributions were found to significantly deviate from normality, so healthy reference values were defined by the mean and standard deviation of each distribution, as summarized in Figure 3 and illustrated in Figure 4. The healthy reference values determined with the peak-finding algorithm are notably higher than the sine fit method for every dynamic parameter except RBC phase oscillation. This observation is substantiated by the results of the two-sample t-test between the dynamic reference values from each method, which found significant differences in values of RBC amplitude oscillation (p=0.001), RBC chemical shift oscillation (p<0.001), and RBC linewidth oscillation (p<0.001), but not in values of RBC phase oscillation (p=0.45). However, differences in the standard deviations are less notable, suggesting comparable levels of certainty with each dynamic fit method.Discussion
By establishing rigorous healthy reference values for relevant static and dynamic 129Xe spectral parameters, this work paves the way for more sensitive detection of cardiopulmonary disease and more accurate phenotyping. Notably, the peak finding method yielded significantly higher reference values than sine fitting for all dynamic parameters except RBC phase oscillation. However, there was no substantial difference in the standard deviation between these methods that would suggest one was favored over the other. Such an assessment will require additional studies of their repeatability or sensitivity to disease. Regardless of oscillation characterization method, these values provide a solid foundation for non-invasive identification of unique markers associated with pulmonary hypertension[5].Acknowledgements
R01HL105643, R01HL12677, NSF GRFP DGE-1644868References
- Norquay G, Leung G, Stewart NJ, Wolber J, Wild JM. 129Xe chemical shift in human blood and pulmonary blood oxygenation measurement in humans using hyperpolarized 129Xe NMR. Magnetic resonance in medicine 2017;77(4):1399-1408
- Bier EA, Robertson SH, Schrank G, Rackley C, Mammarappallil J, Rajagopal S, McAdams HP, Driehuys B. A protocol for quantifying cardiogenic oscillations in dynamic 129Xe gas exchange spectroscopy: the effects of idiopathic pulmonary fibrosis. NMR in Biomedicine 2019;32(1)
- Wang Z, Bier EA, Swaminathan A, Parikh K, Nouls J, He M, Mammarappallil JG, Luo S, Driehuys B, Rajagopal S. Diverse cardiopulmonary diseases are associated with distinct xenon magnetic resonance imaging signatures. European Respiratory Journal 2019;54(6)
- Bier EA, Mummy D, Lu J, Driehuys B. Within- session repeatability of pulmonary 129Xe static and dynamic spectroscopy. In Proceedings of the 29th Annual Meeting of ISMRM. Abstract 3792 (May 2021)
- Bier EA, Alenezi F, Lu J, Wang Z, Mammarappallil JG, O’Sullivan-Murphy B, Erkanli A, Driehuys B, Rajagopal S. Noninvasive diagnosis of pulmonary hypertension with hyperpolarized 129Xe magnetic resonance imaging and spectroscopy. European Respiratory Journal Open Research 2022
Figures
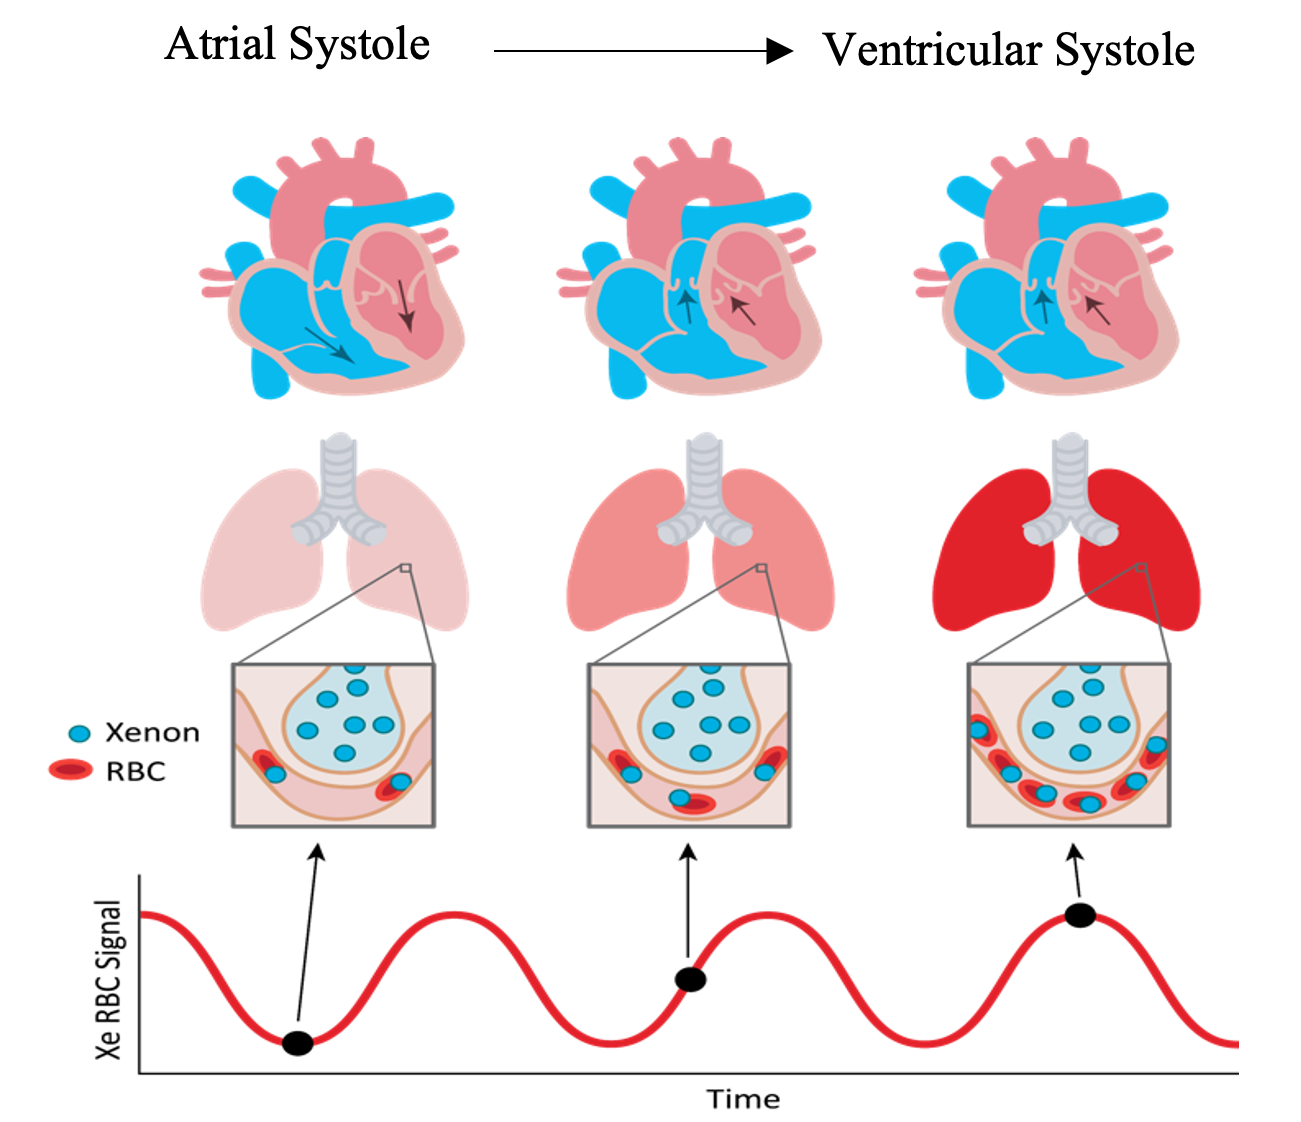
Figure 1. Relationship between the cardiac cycle and oscillations in 129Xe RBC spectral amplitude, shown from atrial systole to ventricular systole and the consequential expulsion of blood from the heart to the pulmonary loop.
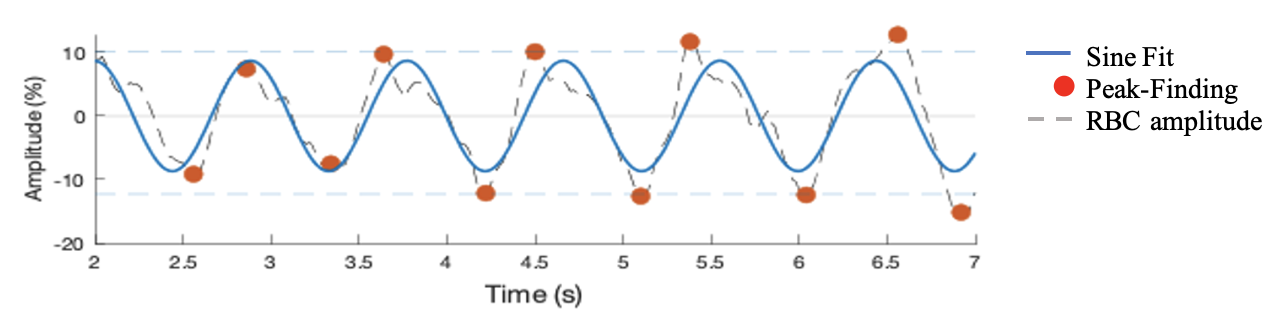
Figure 2. Representative example of RBC amplitude oscillations as a function of time, with both a sine fit (blue line) and peak-finding algorithm (red points). While the sine fit captures general oscillatory dynamics, the peak-finding algorithm more precisely identifies extrema.
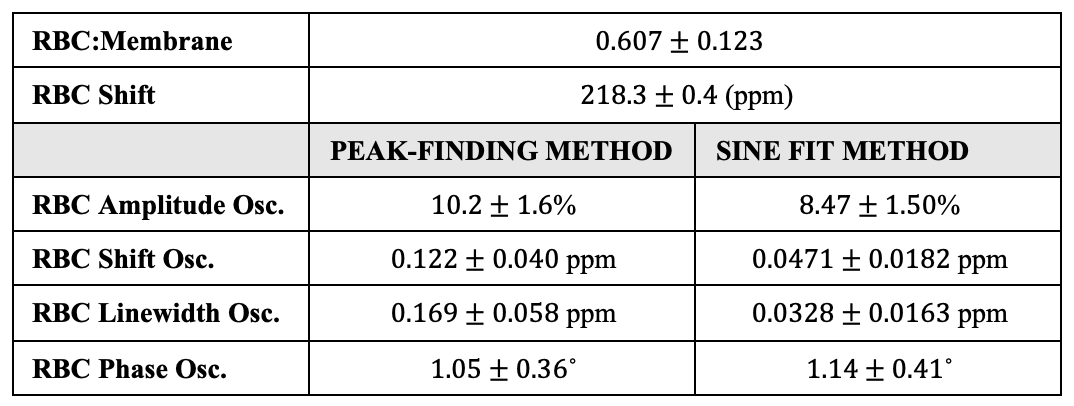
Figure 3. Healthy reference values for all static parameters, without hemoglobin correction, and all dynamic parameters, using both the peak-finding and sine-fit method. All reference values are defined as the mean of the associated dataset plus/minus the standard deviation.
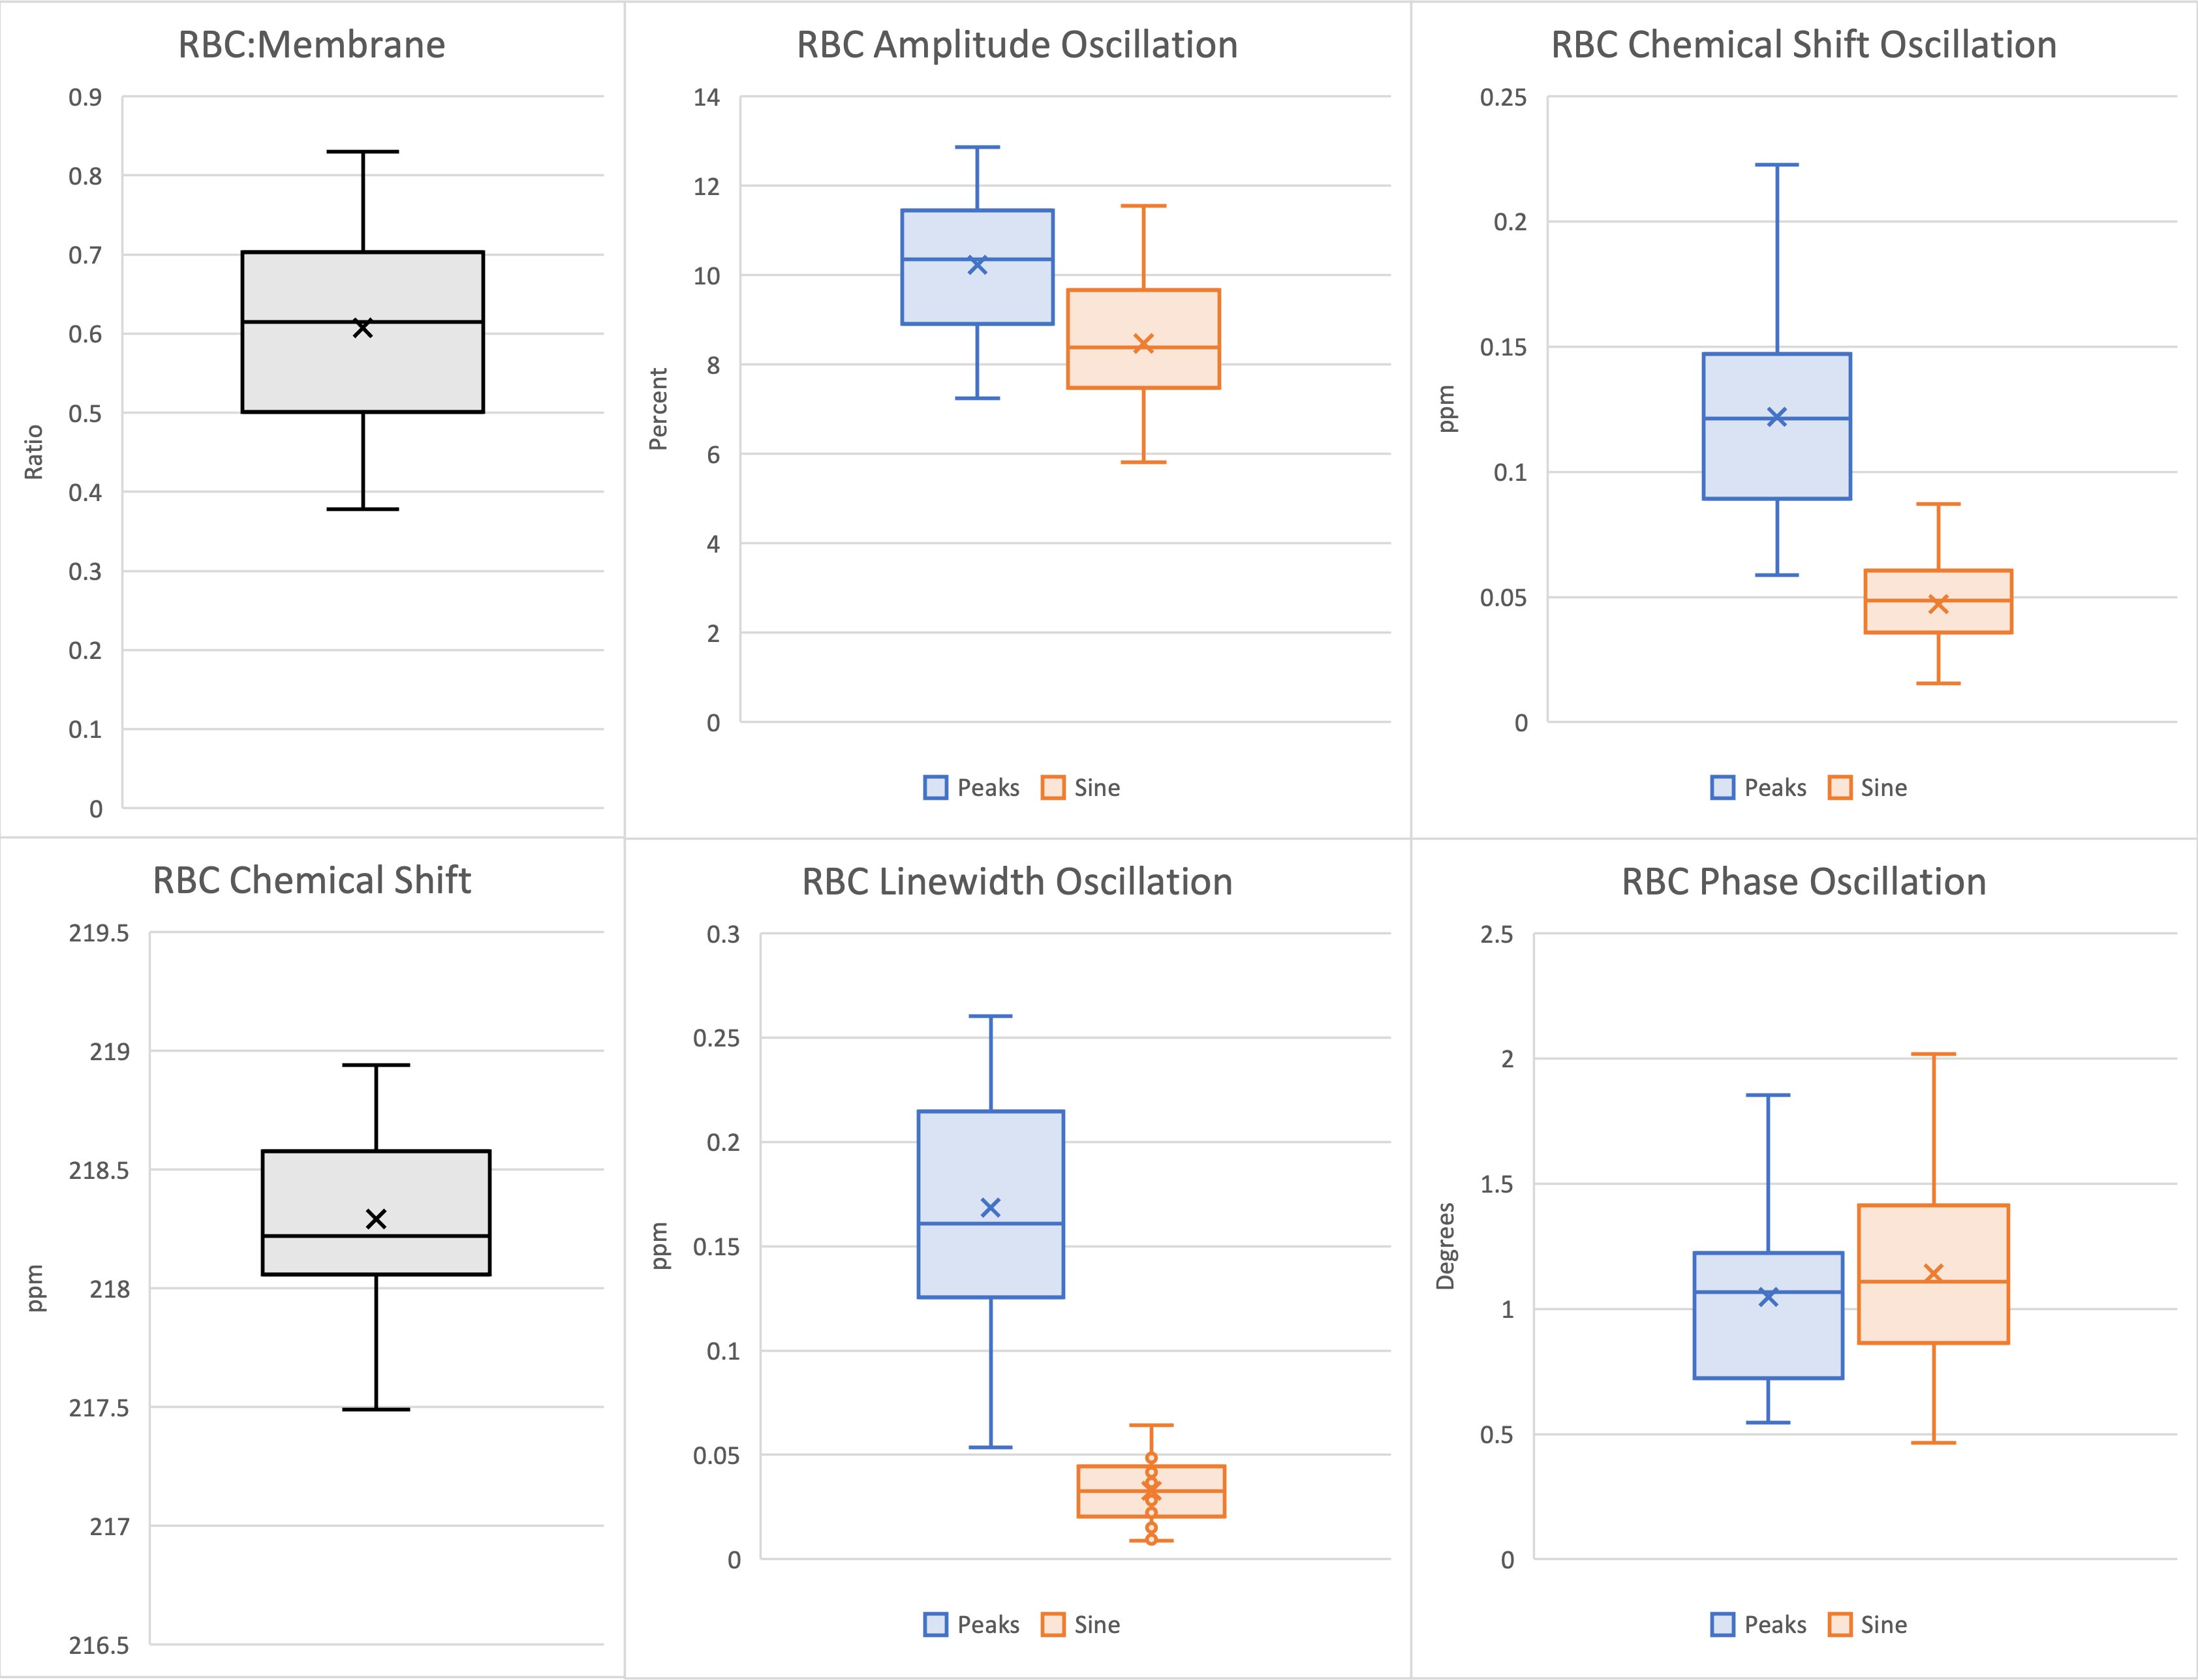
Figure 4. Box plots of static 129Xe spectral parameters (gray), and dynamic 129Xe spectral parameters with both the sine fit (orange) and peak-finding algorithm (blue). Mean values of each distribution are represented by an ‘x’ in the corresponding box plot. Proximity of the mean to the median is indicative of normality.
DOI: https://doi.org/10.58530/2023/0857