0850
3D myocardial perfusion quantification using hyperpolarized HP0011Technical University of denmark, Kongens Lyngby, Denmark, 2Danish Research Centre for Magnetic Resonance, Hvidovre, Denmark, 3MR Research Centre, Aarhus University, Aarhus, Denmark
Synopsis
Keywords: Hyperpolarized MR (Non-Gas), Perfusion
We propose a 3D gradient echo sequence with hyperpolarized HP001 as contrast agent for whole heart myocardial perfusion quantification. The estimated perfusion values are correlated with the perfusion values estimated from dynamic contrast enhanced (DCE)-MRI.Introduction
DCE-MRI using gadolinium (Gd)-based contrast agents is the current MRI standard for myocardial perfusion assessment. Even though Gd-based contrast agents are believed to be safe, concerns about Gd retention in the body have been raised1. As an alternative to gadolinium, hyperpolarized 13C urea and HP001(bis-1,1-(hydroxymethyl)-[1-13C]cyclopropane-d8) have been tested pre-clinically for 2D myocardial perfusion assessment2. 3D techniques allow for whole heart coverage but are challenging due to low myocardium SNR. This work presents methodology for 3D whole heart myocardial perfusion quantification using hyperpolarized HP001. The method was tested in a pig model and results were compared with DCE-MRI.Methods
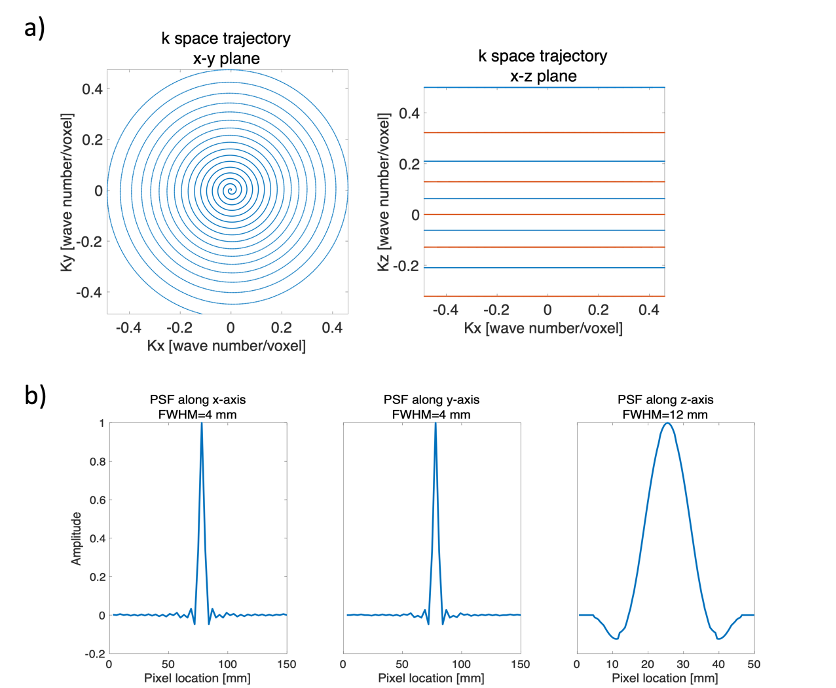
Sequence designA 3D gradient echo, variable density, stack-of-spirals sequence was designed (see Figure 1) with the following parameters: FOV:150x150x100 mm3, resolution=3x3x10 mm3, readout time=21ms. The data acquisition order for phase-encodes was chosen to first acquire odd numbered planes, and then even to enable sliding window reconstruction. The spatial point spread function(PSF) was simulated by performing image reconstruction with all k-space data points set equal.
Coil sensitivity mapping
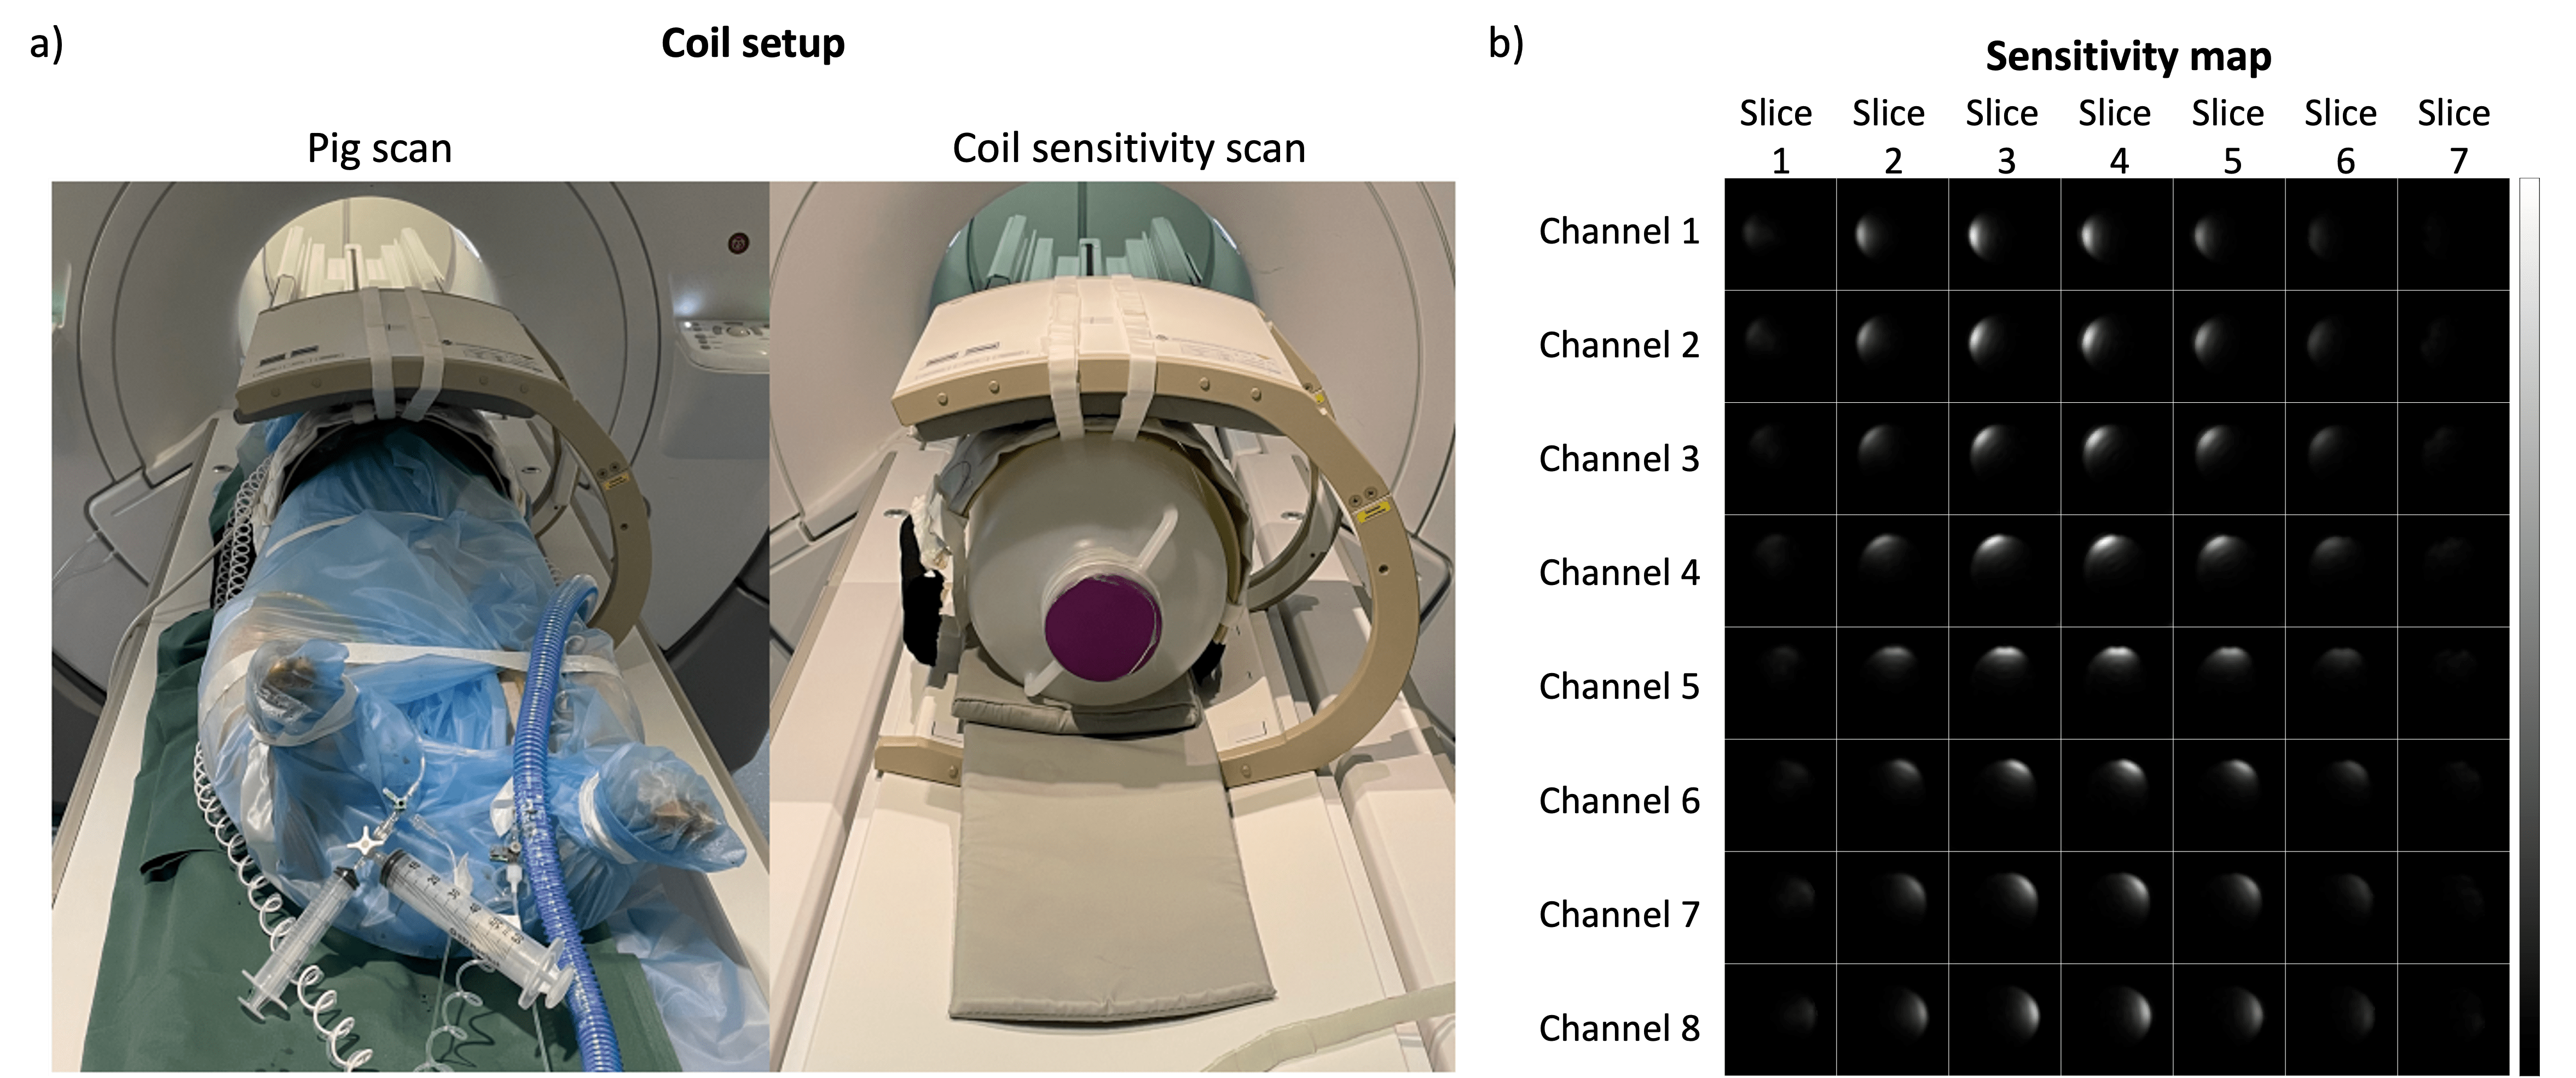
A home-built 13C 8-channel flexible coil3 was used for reception and a clamshell type coil for transmission (RAPID Gmbh, Germany). To enable intensity correction for the in vivo experiment, the coil sensitivities were measured using an ethylene glycol phantom, while the coil shape and location was fixed, see Figure 2. A multi-slice 2D spiral GRE sequence with spectral-spatial excitation was used for the sensitivity measurement. B0 and B1+ maps were acquired to compensate for reduced signal due to off-resonance and flip angle variations. The measured coil sensitivity map was registered to the 13C in vivo images based on the scanner coordinates.
In vivo experiments
Animal handling
One healthy 40 kg female Danish domestic pig was used in the experiment. Animal handling was as described in reference4. Cardiac stress was pharmacologically induced by continuous intravenous infusion(600ml/h) of adenosine(5mg/ml) and dobutamine(12.5mg/ml) in saline. Imaging started 3 minutes into the stress infusion.
Hyperpolarization
Two injections were planned. For each injection, 300uL HP001 with 40 mM trityl radical was polarized with a SpinAligner(Polarize, Denmark). The sample was dissolved into 15 ml saline water, providing 166 mM HP001 solution.
Imaging protocol
All imaging experiments were performed on a 3T scanner(Discovery MR750, GE Healthcare) and all cardiac scans were gated to the diastole.
1. Rest/Stress 13C perfusion images were acquired with: TR/TE=44/1ms, flip angle=10°, rest/stress heart rate=34/54 bpm, image frame time=half cardiac cycle, number of frames=60.
2. Rest/Stress 1H gadolinium inversion-recovery DCE-MRI were performed with: FOV=350x350mm2, resolution=1.35x1.35mm2, TI/TE/TR=118/1.12/2.3ms, flip angle=20°, slice thickness=8mm, slice spacing=20mm, number of slices=3, rest/stress heart rate=46/46 bpm, image frame time=1 cardiac cycle, number of frames=64.
Reconstruction
A sliding window approach was used to reconstruct two images from each k-space dataset. Conjugate gradient SENSE reconstruction and intensity correction was performed with the phantom-based sensitivity map. The MIRT toolbox5 was used for reconstruction.
Perfusion quantification
A constrained decomposition method was used for perfusion quantification for both 13C and 1H data. The method enforces a monotonically decreasing residue function acquired by temporal deconvolution of the myocardial signal with the arterial left ventricle signal.
Correlation study
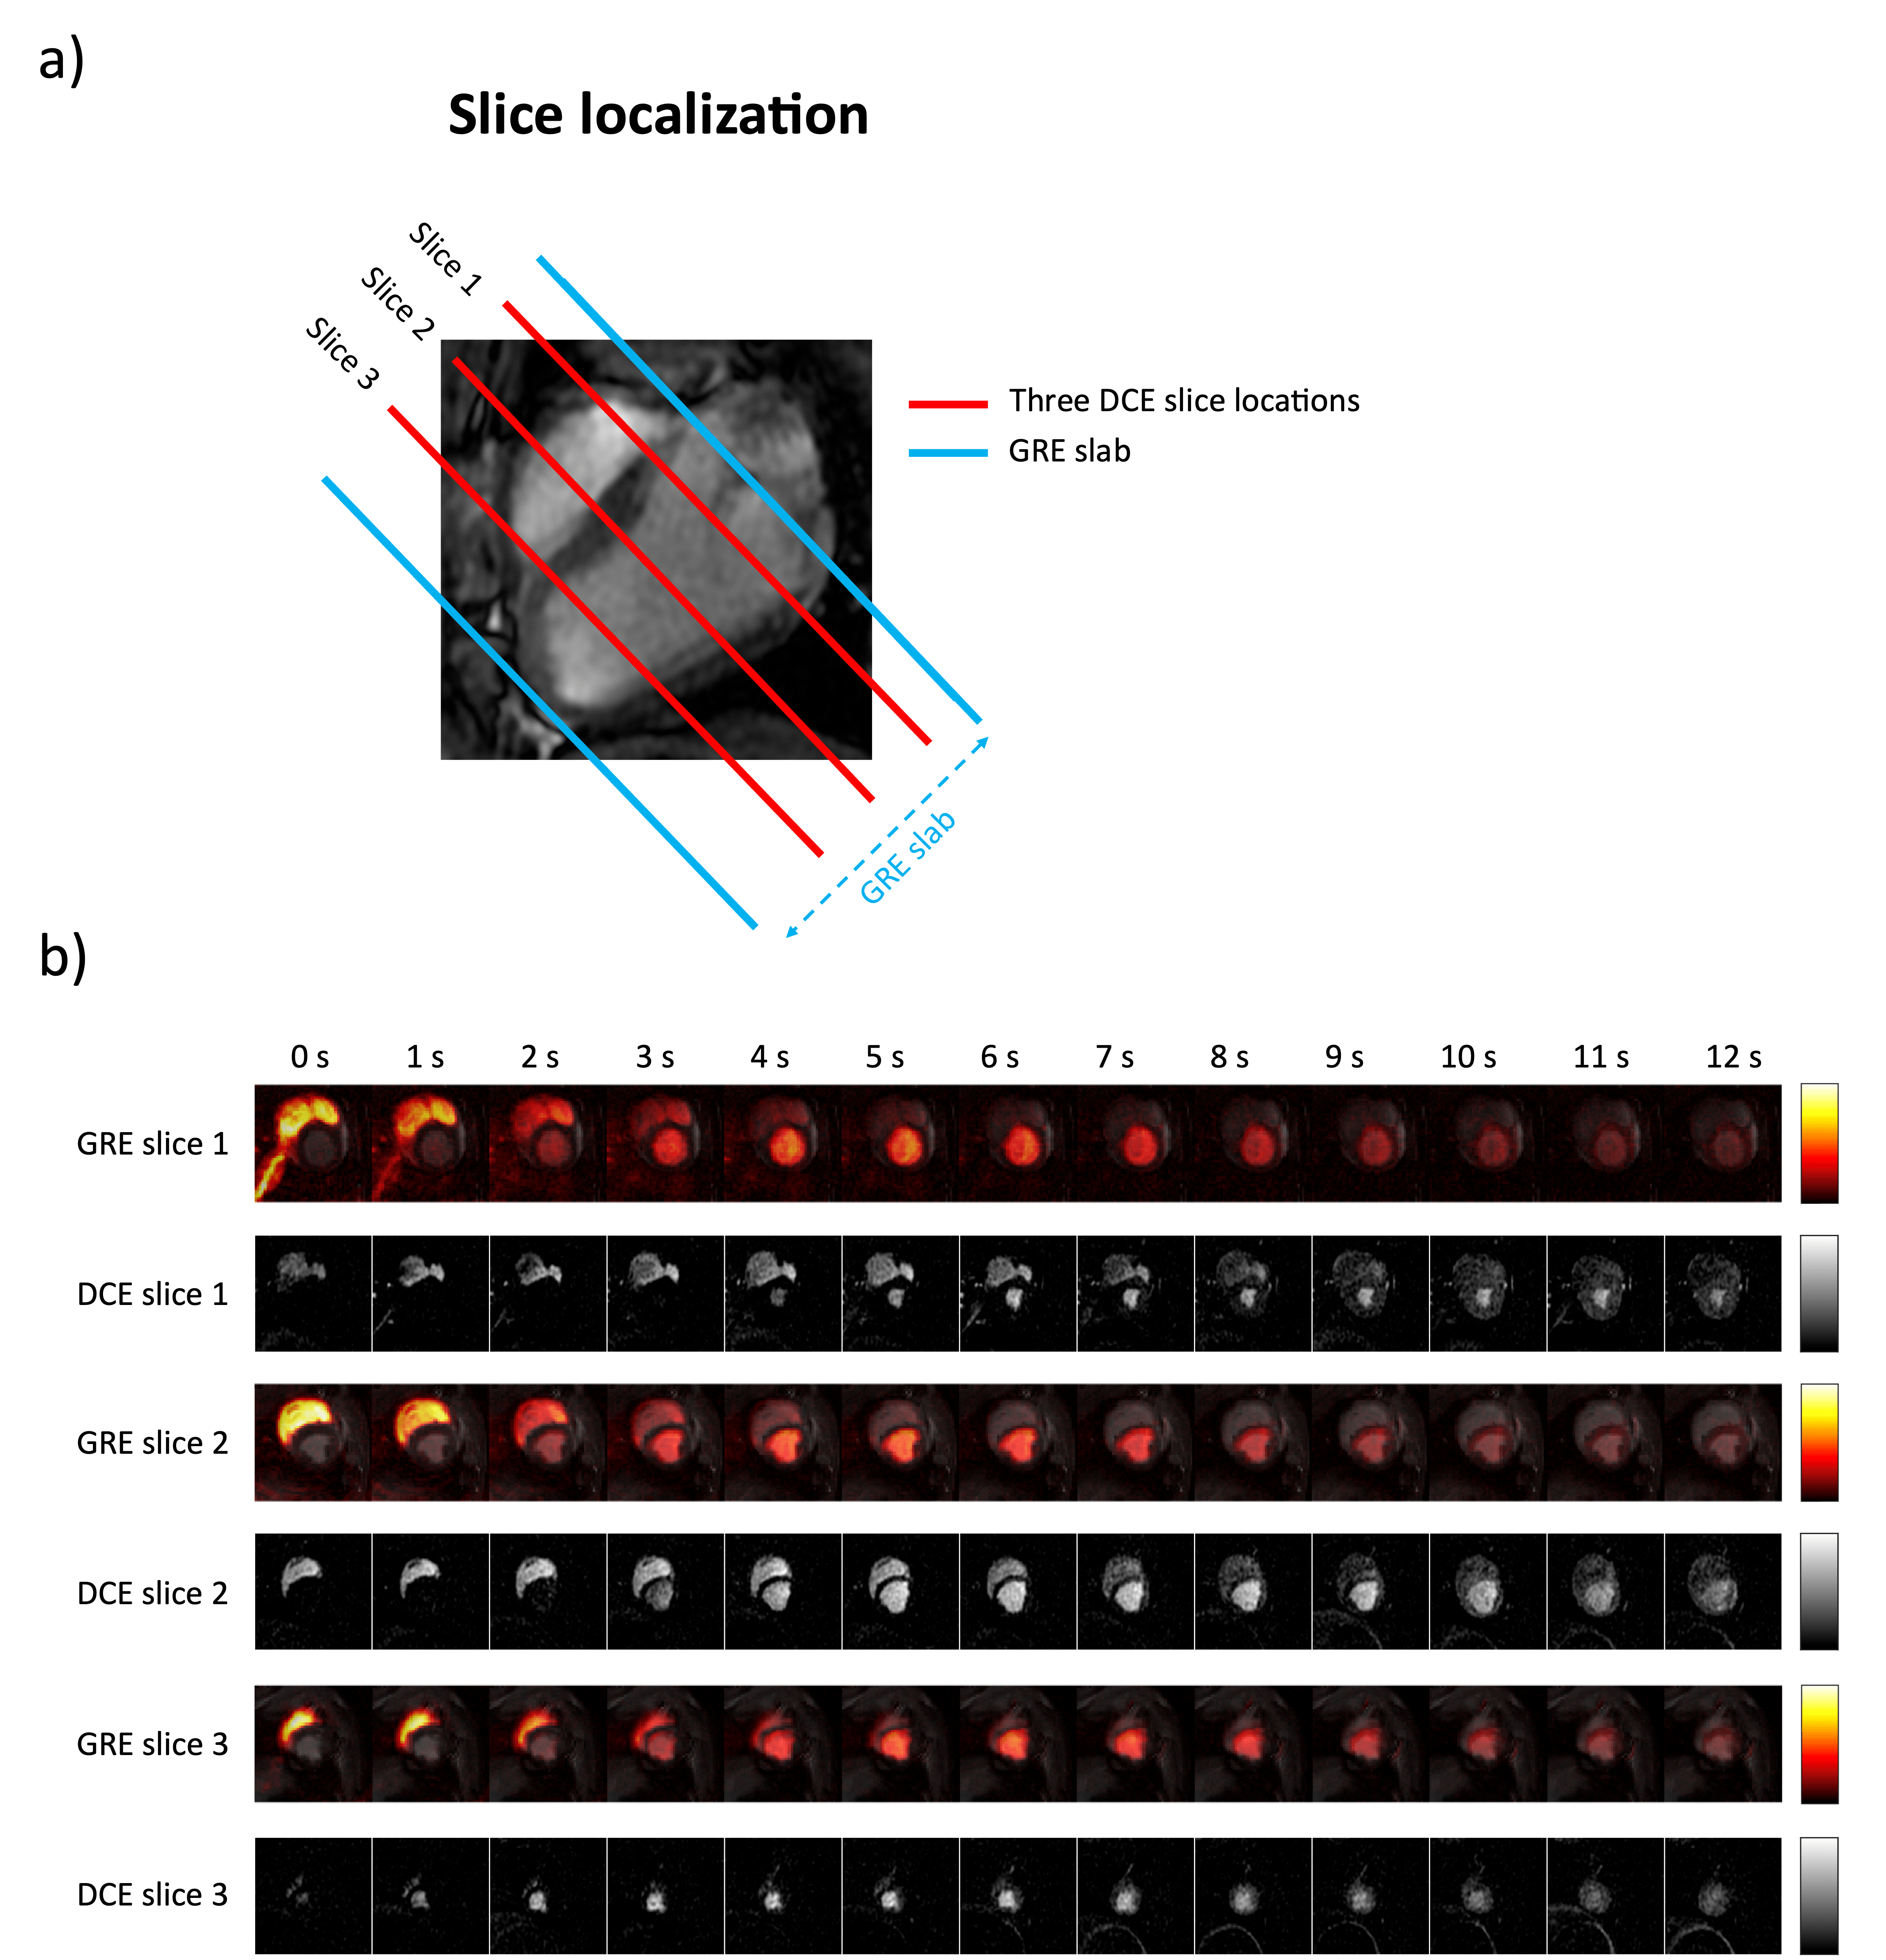
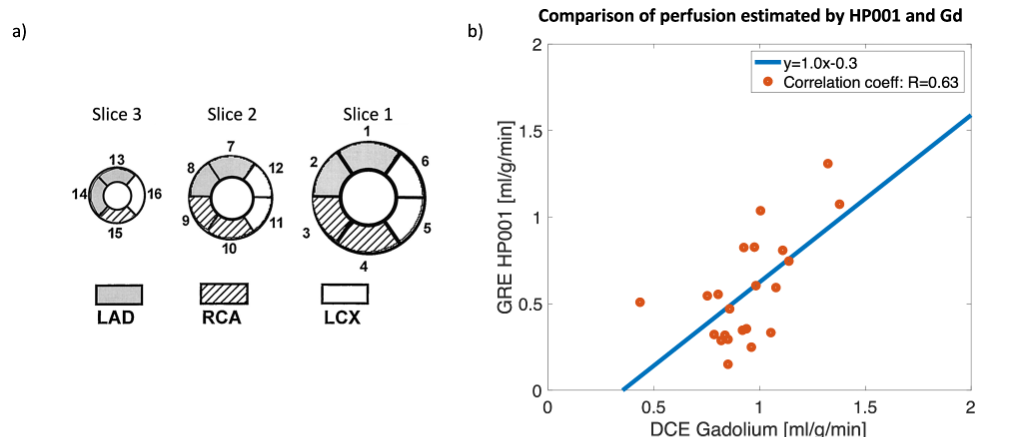
Perfusion values in stress slice 1 and rest slice 3, see Figure 4, were excluded from the correlation as the DCE-MRI for these slices were wrongly acquired in the systole. The myocardium was divided into 16 segments (Figure 5a), and the correlation of the mean perfusion values for each segment between 13C GRE rest/stress and DCE rest/stress was estimated (22 points in total).
Result and Discussion
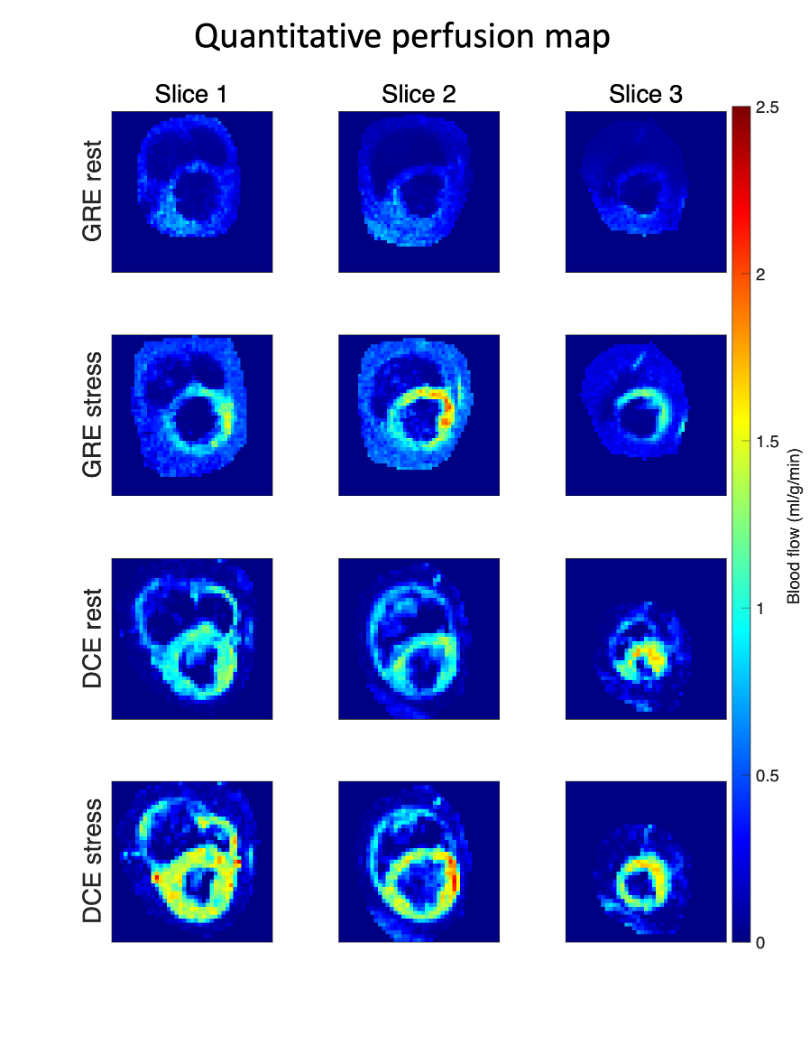
The measured polarization levels for the two injections were 23% and 25% at the time of dissolution. The simulated PSF is shown in Figure 1. The measured sensitivity map is shown in Figure 2. Figure 3 shows 13C GRE and DCE image time series. Myocardial perfusion is visible after 9 s. Quantitative perfusion maps are shown in Figure 4. The quantitative GRE stress perfusion estimates are comparable to those from DCE. The 13C GRE rest perfusion estimates are much lower compared to DCE rest. Figure 5 shows correlation (R=0.63) between perfusion estimates by 13C GRE and DCE. Linear regression shows that the perfusion estimates are proportional (k=1), though with a -0.3 ml/g/min offset.Conclusion
The study demonstrated the feasibility of 3D myocardial perfusion estimation using hyperpolarized HP001 in a pig model. The correlation study shows a correlation(R=0.63) between perfusion values estimated by 13C GRE and DCE-MRI.Acknowledgements
No acknowledgement found.References
1. McDonald RJ, Levine D, Weinreb J, Kanal E, Davenport MS, Ellis JH, et al. Gadolinium Retention: A Research Roadmap from the 2018 NIH/ACR/RSNA Workshop on Gadolinium Chelates. Radiology [Internet]. 2018 Sep 11 [cited 2022 Nov 7];
2. M. Fuetterer et al., ‘Hyperpolarized 13C urea myocardial first-pass perfusion imaging using velocity-selective excitation’, J. Cardiovasc. Magn. Reson., vol. 19, p. 46, Jun. 2017, doi: 10.1186/s12968-017-0364-4.
3. Sanchez-Heredia JD, Olin RB, Grist JT, Wang W, Bøgh N, Zhurbenko V, et al. RF coil design for accurate parallel imaging on 13C MRSI using 23Na sensitivity profiles. Magnetic Resonance in Medicine. 2022 Sep 1;88(3):1391–405.
4. Laustsen C, Hansen ESS, Kjærgaard U, Bertelsen LB, Ringgaard S, Stødkilde‐Jørgensen H. Acute porcine renal metabolic effect of endogastric soft drink administration assessed with hyperpolarized [1‐13C]pyruvate. Magnetic Resonance in Medicine. 2015 Aug;74(2):558.
5. Fessler JA, Sutton BP. Nonuniform fast Fourier transforms using min-max interpolation. IEEE Transactions on Signal Processing. 2003 Feb;51(2):560–74.
Figures