0849
Incorporating DCE derived perfusion terms to inform fitting of hyperpolarized pyruvate metabolism in a human thyroid tumor.1Imaging Physics, MD Anderson Cancer Center, Houston, TX, United States, 2Department of Radiation Oncology, MD Anderson Cancer Center, Houston, TX, United States, 3Head and Neck Surgery, MD Anderson Cancer Center, Houston, TX, United States
Synopsis
Keywords: Hyperpolarized MR (Non-Gas), Hyperpolarized MR (Non-Gas)
Dynamic contrast enhanced MRI was used to derive perfusion terms which were incorporated into the fitting of hyperpolarized pyruvate to lactate apparent conversion rates. Incorporation of the DCE data reduced the fit metabolic conversion rates across the data set but more so for the post therapy data resulting in a significant decrease in kpl after therapy. These results suggest that more effort is needed to disentangle perfusion from metabolic effects when analyzing HP MRI data.INTRODUCTION
Hyperpolarized (HP) MRI can provide novel metabolic information especially in the setting of oncology [1,2]. Given that HP agents are prepared exogenously and delivered to tumors via native vasculature, HP studies are intrinsically linked to tissue perfusion [3]. Many methods have been proposed to characterize tissue perfusion with dynamic contrast enhanced (DCE) MRI commonly used. In this work we leverage perfusion information from DCE MRI to inform on the metabolic modeling of hyperpolarized pyruvate in a patient with anaplastic thyroid cancer.METHODS
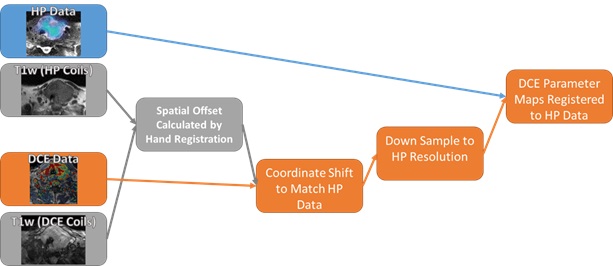
Acquisition: A patient with biopsy-proven anaplatic thyroid cancer (ATC) in the left lobe of the thyroid was imaged on a 3T GE scanner (GE Healthcare, Waukesha, WI, USA) [4]. Hyperpolarized pyruvate was polarized in a 5T GE SPINlab polarizer. Spectral spatial excitation was used for HP acquisitions [5]. Images had a 15x15x8 mm spatial, and 3 s temporal resolution. DCE data was acquired using a 3D gradient echo with 2x2x4 mm spatial and 5.5 s temporal resolution [6]. DEC_MRI data was acquired for 5 min following an injection of 0.1 mmol/kg of Gadobutrol (Gadovist, Bayer Healthcare, Germany). An identical imaging protocol was performed at baseline as well as eight days after starting systemic therapy using Pembrolizumab and Lenvatinib. This imaging protocol was approved by our institutional review board.Registration: The DCE and HP data were acquired using different coil configurations, necessitating movement of the patient from the MRI table between the HP and DCE acquisitions. T1w images acquired under both setups were manually registered to account for and displacement between the HP and DCE setups. The errors imposed by this registration approach were mitigated by the large voxel size (15 mm) of the HP data. The process of down sampling and registering DCE data to the resolution of HP data is shown in Figure 1.
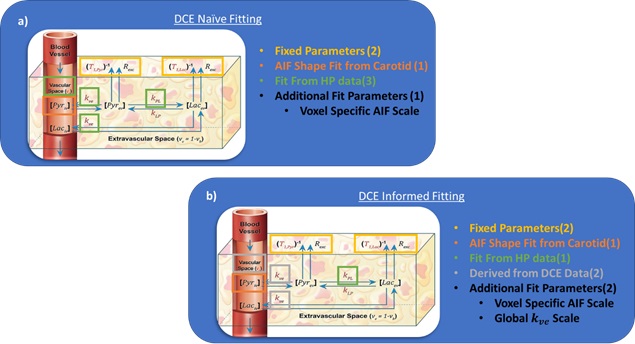
DCE-Naïve PK Analysis of HP Data: The HP data was fit with a two-compartment pharmacokinetic (PK) model that accounted for pyruvate perfusion from the vascular space. An arterial input function (AIF) shape was determined using the HP pyruvate signal in the carotid artery though a voxel specific scale factor was fit. Additional perfusion terms, such as the extravasation rate, kve, and vascular volume fraction, vp, along with the apparent conversion rate from pyruvate to lactate, kpl.
DCE Informed PK Analysis of HP Data: DCE data was processed using the extended Tofts model to measure kTrans, ve and vp. Ktrans and vb parameter maps derived from DCE-MRI data were registered and downsampled according to Figure 1, and used to estimate kv and vb for PK analysis of HP MRI data. Gadovist and pyruvate have different molecular weights, 604.7 and 88.1 respectively, and are likely to distribute quite differently. We accounted for this by using a global scale factor that was fit for DCE kve maps before the resulting voxel specific kve was used to fit kpl and the VIF scale factor. A schematic of the fitting approaches are outlined in Figure 2.
RESULTS
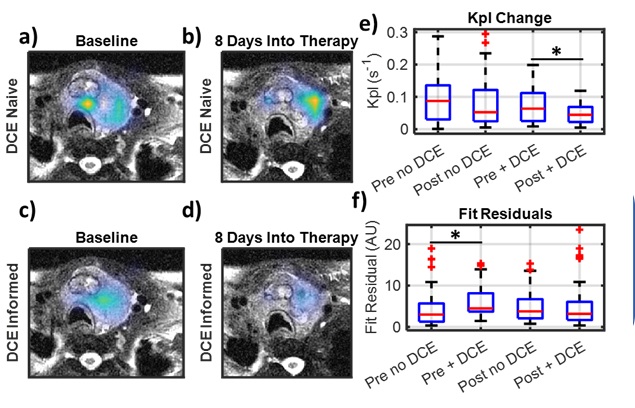
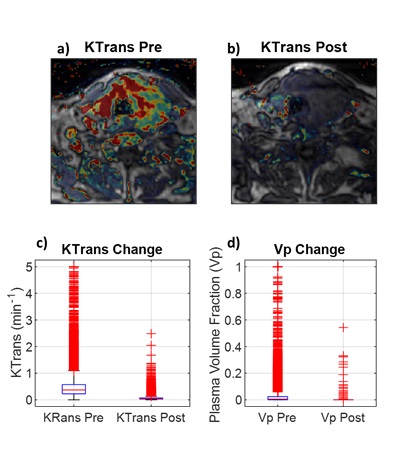
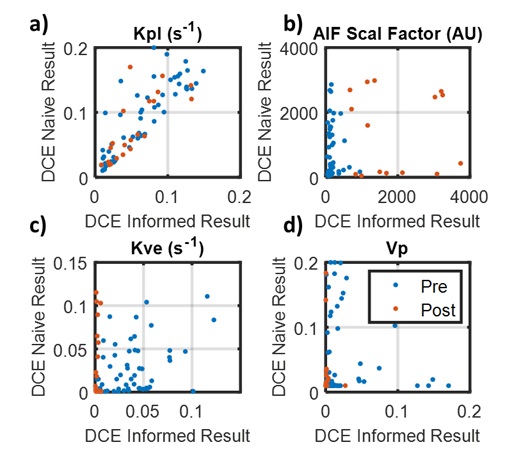
DCE naïve fitting shows a non-significant decrease in kpl of 9.3% (p = 0.53) from baseline to 8 days into therapy. The inclusion of DCE data into the fitting analysis resulted in a broad kpl decline of 28%. However, the baseline data fell only 22% while the post therapy data fell 46%. This asymmetry in reduction resulted in an increased kpl reduction from therapy to 34.4% (p=0.03). The DCE informed kpl decrease is more consistent with other metrics such as lactate signal which dropped 30% (p=0.0013). Figure 3 shows pre and post kpl maps with and without DCE terms as well as a boxplot of kpl. It can be observed that the fit residual increased as a result of incorporating DCE data. This is to be expected, as the DCE informed fits had fewer degrees of freedom (3 vs. 4).The disparity in kpls between DCE informed and DCE naïve fitting can be explained by the large reduction in tumor perfusion as measured by DCE. The vascular extravasation fell 88% (p<<0.001) and the vascular pool dropped 96% (p<<0.001), which can be seen in Figure 4. Such a large disruption of the vascular perfusion is not unexpected due to the anti-angiogenic nature of the therapy. This drastic reduction in tissue perfusion was not fully captured when fitting the HP data alone, even though the models contained the requisite perfusion terms. This can be seen by looking at the voxel wise correlations between model parameters in Figure 5. Fit kpls are best correlated between fitting approaches, with the DCE incorporated voxels showing lower kpl values. The kve values are much less correlated and the vp values are not correlated at all. This incorporating additional perfusion information from DCE MRI can result in altered metabolic quantification, even if the same model is used.
CONCLUSION
This data shows that the metabolic estimations made by HP pyruvate are sensitive to tissue perfusion. Even when accounting for perfusion when modeling the HP data, discrepancies can arise given the number of fit parameters needed to describe such a rich signal evolution. Leveraging standard of practice DCE information in this work proved to significantly impact the estimated metabolic biomarker potentially improving accuracy.Acknowledgements
This work was supported by funding from the National Cancer Institute (R01CA211150, R01CA280980) and the National Institute of Diabetes and Digestive and Kidney Diseases (R01DK105346) of the National Institutes of Health, and the Cancer Prevention and Research Institute of Texas (RP170366). The content is solely the responsibility of the authors and does not necessarily represent the official views of the sponsors.References
1. Sandulache, V. C. et al. Evaluation of hyperpolarized [1-(1)(3)C]-pyruvate by magnetic resonance to detect ionizing radiation effects in real time. PLoS One 9, e87031, doi:10.1371/journal.pone.0087031 (2014).
2. Sandulache, V. C. et al. Glycolytic inhibition alters anaplastic thyroid carcinoma tumor metabolism and improves response to conventional chemotherapy and radiation. Mol Cancer Ther 11, 1373-1380, doi:10.1158/1535-7163.MCT-12-0041 (2012).
3. Bankson JA, et al. Kinetic Modeling and Constrained Reconstruction of Hyperpolarized [1-13C]-Pyruvate Offers Improved Metabolic Imaging of Tumors. Cancer Res. 75, 4708-17. doi: 10.1158/0008-5472.CAN-15-0171. (2015).
4. Tropp, J. et al. Multi-channel metabolic imaging, with SENSE reconstruction, of hyperpolarized [1-(13)C] pyruvate in a live rat at 3.0 tesla on a clinical MR scanner. J Magn Reson 208, 171-177, doi:10.1016/j.jmr.2010.10.007 (2011).
5. Gordon, J. W. et al. Translation of Carbon-13 EPI for hyperpolarized MR molecular imaging of prostate and brain cancer patients. Magn Reson Med 81, 2702-2709, doi:10.1002/mrm.27549 (2019).
6. He R, et al. Simultaneously spatial and temporal Higher-Order Total Variations for noise suppression and motion reduction in DCE and IVIM. Proc SPIE Int Soc Opt Eng. doi: 10.1117/12.2549625. (2020)
Figures