0847
Assessing Glutaminase Inhibition Treatment Response in Ovarian Cancer by Hyperpolarized Magnetic Resonance Spectroscopy1Cancer Systems Imaging, UT-MD Anderson Cancer Center, Houston, TX, United States, 2Gynecologic Oncology and Reproductive Medicine, UT-MD Anderson Cancer Center, Houston, TX, United States, 3Chemistry, UT- Austin, Austin, TX, United States, 4Investigational Cancer Therapeutics, UT-MD Anderson Cancer Center, Houston, TX, United States, 5Surgery, Baylor College of Medicine, Houston, TX, United States
Synopsis
Keywords: Hyperpolarized MR (Non-Gas), Metabolism, Metabolic Imaging
The metabolic vulnerability of anti-VEGF antibody (AVA) resistant ovarian cancer with glutaminase inhibitor (GLSi) therapy was assessed by hyperpolarized 13C-pyruvate magnetic resonance spectroscopy (HP-MRS) in vivo and by desorption electrospray ionization spectroscopic (DESI-MS) imaging ex vivo. The lactate-to-pyruvate ratio was used as the treatment response imaging biomarker.
Introduction
Ovarian cancer accounts for more deaths than any other cancer of the female reproductive system despite advances in targeted drugs such as anti-VEGF antibody (AVA).1 Additionally, resistance to AVA therapy is nearly ubiquitous with metabolic adaptations such as dependence on glutamine metabolism via the enzyme glutaminase. We have employed hyperpolarized 13C-pyruvate magnetic resonance spectroscopy to interrogate the metabolic vulnerability in ovarian cancer mouse model and validated glutaminase inhibitor (GLSi) therapy utilizing desorption electrospray ionization spectroscopic (DESI-MS) imaging.Methods
1-13C-labeled pyruvic acid was hyperpolarized using a commercial DNP HyperSense polarizer following standard protocol.2 Anatomical MRI and 13C-MRS were obtained using a Bruker 7T scanner. We used a well-characterized SKOV3ip1 orthotopic mouse model of high-grade serous ovarian cancer with adaptive resistance to AVA (bevacizumab) treatment. Following three weeks of GLSi and bevacizumab treatment, we performed HP-MRS imaging to directly and non-invasively compare metabolic changes in bevacizumab monotherapy to combined treatment with bevacizumab and GLSi therapy. Upon injection of hyperpolarized [1-13C] pyruvate, we quantitatively assessed a normalized lactate-to-pyruvate ratio (Lac/Pyr) defined as the 13C resonance signal of lactate divided by pyruvate signals over time. DESI-MS imaging was performed in the negative ion mode at a spatial resolution of 200 μm using a mass resolving power of 70,000 (m/z 200) and an instrument method optimized for enhanced detection of small metabolite species from m/z 80-500.Results/Discussion
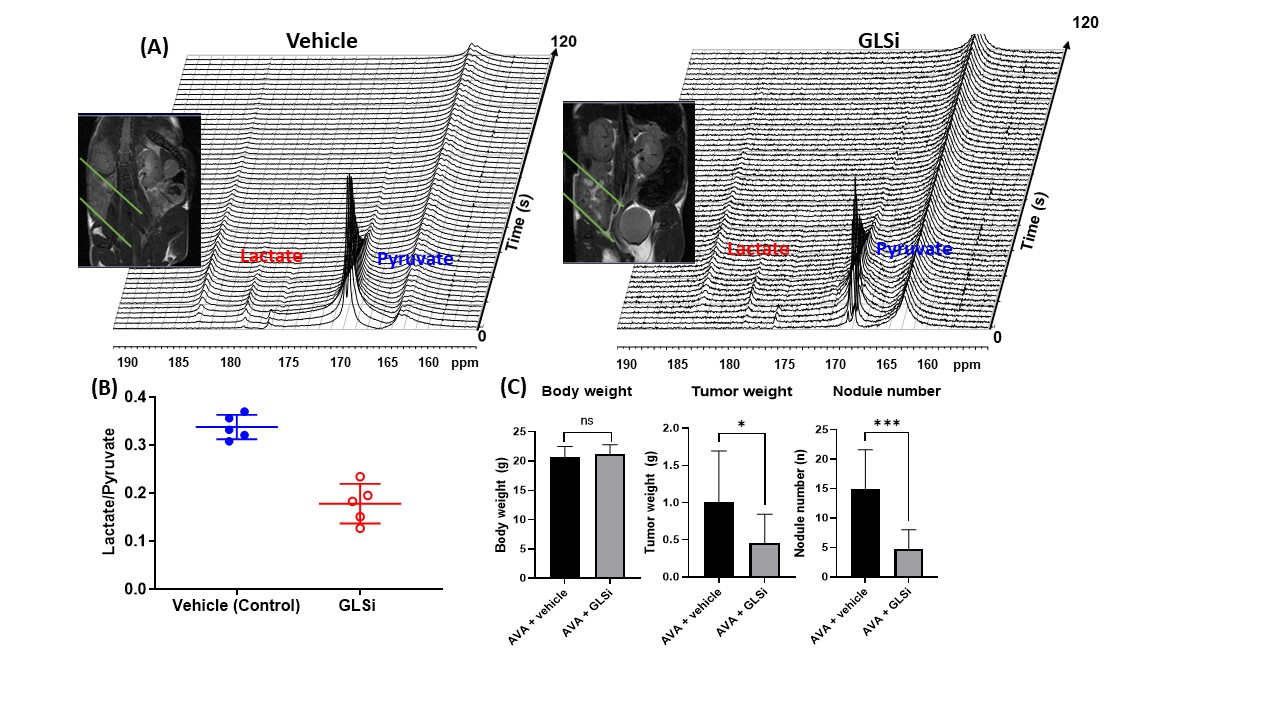
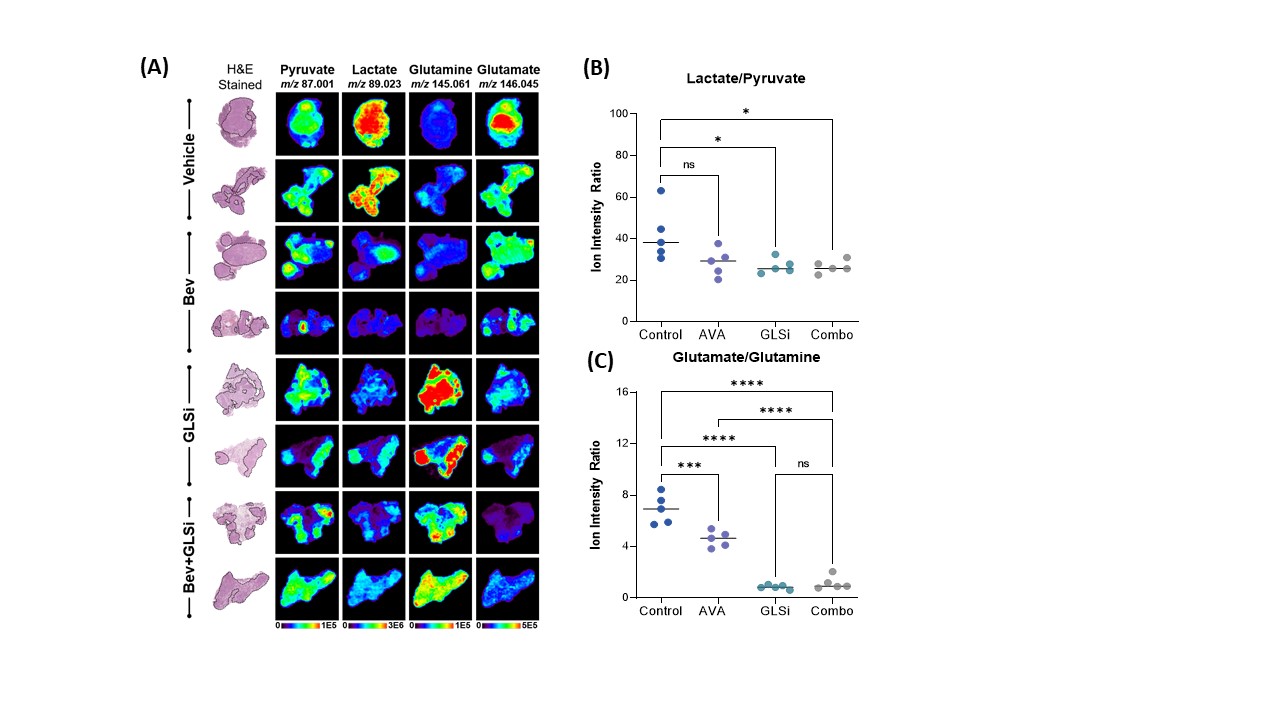
The in vivo HP-MRS provided a direct and non-invasive analysis of pyruvate metabolism of tumors in situ (Figure 1 A). Our analysis indicated that the pyruvate-to-lactate conversion was significantly reduced in vivo by GLSi treatment (0.337 vs 0.178, p = 0.0002) suggestive of therapeutic efficacy of GLSi in the setting of AVA resistant tumors (shown in Figure 1B). Consistent with this, we observed a statistically significant reduction in tumor weight (0.05g vs 0.62g and 0.64g, p <0.01) and tumor nodule number (n = 3.3 vs n = 12.8 and n = 13.9, p <0.05) in mice treated with a combination of bevacizumab and GLSi compared to the control group, or GLSi monotherapy respectively (Figure 1C). DESI-MS imaging showed that the lactate/pyruvate and glutamate/glutamine ratios were significantly reduced in treated tumor compared to vehicle control tumors (Figure 2).Conclusion
Using hyperpolarized-MR spectroscopy in vivo, we directly monitored metabolic changes occurring after GLSi treatment in vivo. The in vivo data was validated by DESI-MS imaging ex vivo. These findings are consistent with the notion of glutamine dependence being an important resistance mechanism to AVA therapy and imply potential future use of HP-MRS in monitoring therapeutic efficacy in a clinical realm for patients with ovarian cancer.Acknowledgements
The research reported here is funded by the following: T32 training grant CA101642 (D.G.); MD Anderson Cancer Center Support Grant CA016672; MD Anderson Ovarian Cancer Moon Shot (A.K.S.), SPORE in Ovarian Cancer CA 217685 (A.K.S.). We would like to acknowledge the support of small animal imaging facility (SAIF) at MD Anderson Cancer Center.References
1. Lara O. D, Bayraktar E, Amero P. S, et al. Therapeutic Efficacy of Liposomal Grb2 Antisense Oligodeoxynucleotide (L-Grb2) in Preclinical Models of Ovarian and Uterine cancer. Oncotarget. 2020;11(29): 2819 - 2833.
2. Dutta P, Salzillo, T. C, Pudakalakatti S. et al. Assessing Therapeutic Efficacy in Real-time by Hyperpolarized Magnetic Resonance Metabolic Imaging. Cells 2019; 8: 340.
Figures