0842
Image- and spectroscopy-based quantitative assessment of renal function using hyperpolarized 13C-labelled Z-OMPD1TUM School of Medicine, Department of Nuclear Medicine, Technical University of Munich, Munich, Germany
Synopsis
Keywords: Hyperpolarized MR (Non-Gas), Non-Proton, Z-OMPD, Urea, Kidney
Fast and accurate assessment of kidney function is crucial for monitoring and detection of kidney disease and failure in various oncological scenarios. Current techniques rely on non‑spatially resolved blood or urine biomarkers and possess time- or safety-related constraints when using MRI or CT. Here, we demonstrate fast 3D bSSFP imaging and slice spectroscopy protocols using hyperpolarized [1,5-13C2]Z-OMPD for assessment of renal perfusion and filtration in comparison with 13C-urea as an established perfusion agent. Measured renal blood flow and glomerular filtration rates agree with literature and between agents and methods, thereby rendering Z-OMPD a versatile agent for assessment of kidney functionality.Introduction
Onco-nephrology focuses on identification and prevention of kidney damage or failure related to cancer treatments together with kidney disease-related risks for cancer1,2. Here, assessment of renal function is essential for diagnosis and therapy, with the glomerular filtration rate (GFR) being its most important biomarker3. In clinical routine, kidney function is probed by perfusion imaging using arterial spin labelling4,5 or injection of iodine-containing contrast agents for DCE-MRI6 or CT7. These agents might cause nephropathies8 which limit usage for fragile kidney conditions. For hyperpolarized 13C-magnetic resonance imaging, 13C‑urea has been introduced as perfusion agent9, allowing measurement of GFR10 for assessment of renal function. Here, we introduce hyperpolarized, 13C-labelled [1,5‑13C2]Z‑4‑methyl-2-oxopent-3-enedioic acid (Z‑OMPD)11 as a probe for 3D imaging- and spectroscopy-based quantitative assessment of renal perfusion and filtration, which has previously been also reported as pH sensor11.Methods
Cohort: Nine female Wistar rats, 9–19 weeks old.Hyperpolarization: 40 mg Z-OMPD and 15 mg 13C-urea were co-polarized and dissolved in D2O containing TRIS, resulting in concentrations of 84 mM for both agents.
Hardware: Scanner: Small animal 7 T magnet; Transmit: 72 mm 13C/1H-volume resonator, Receive: Two-channel flexible 13C-coil array.
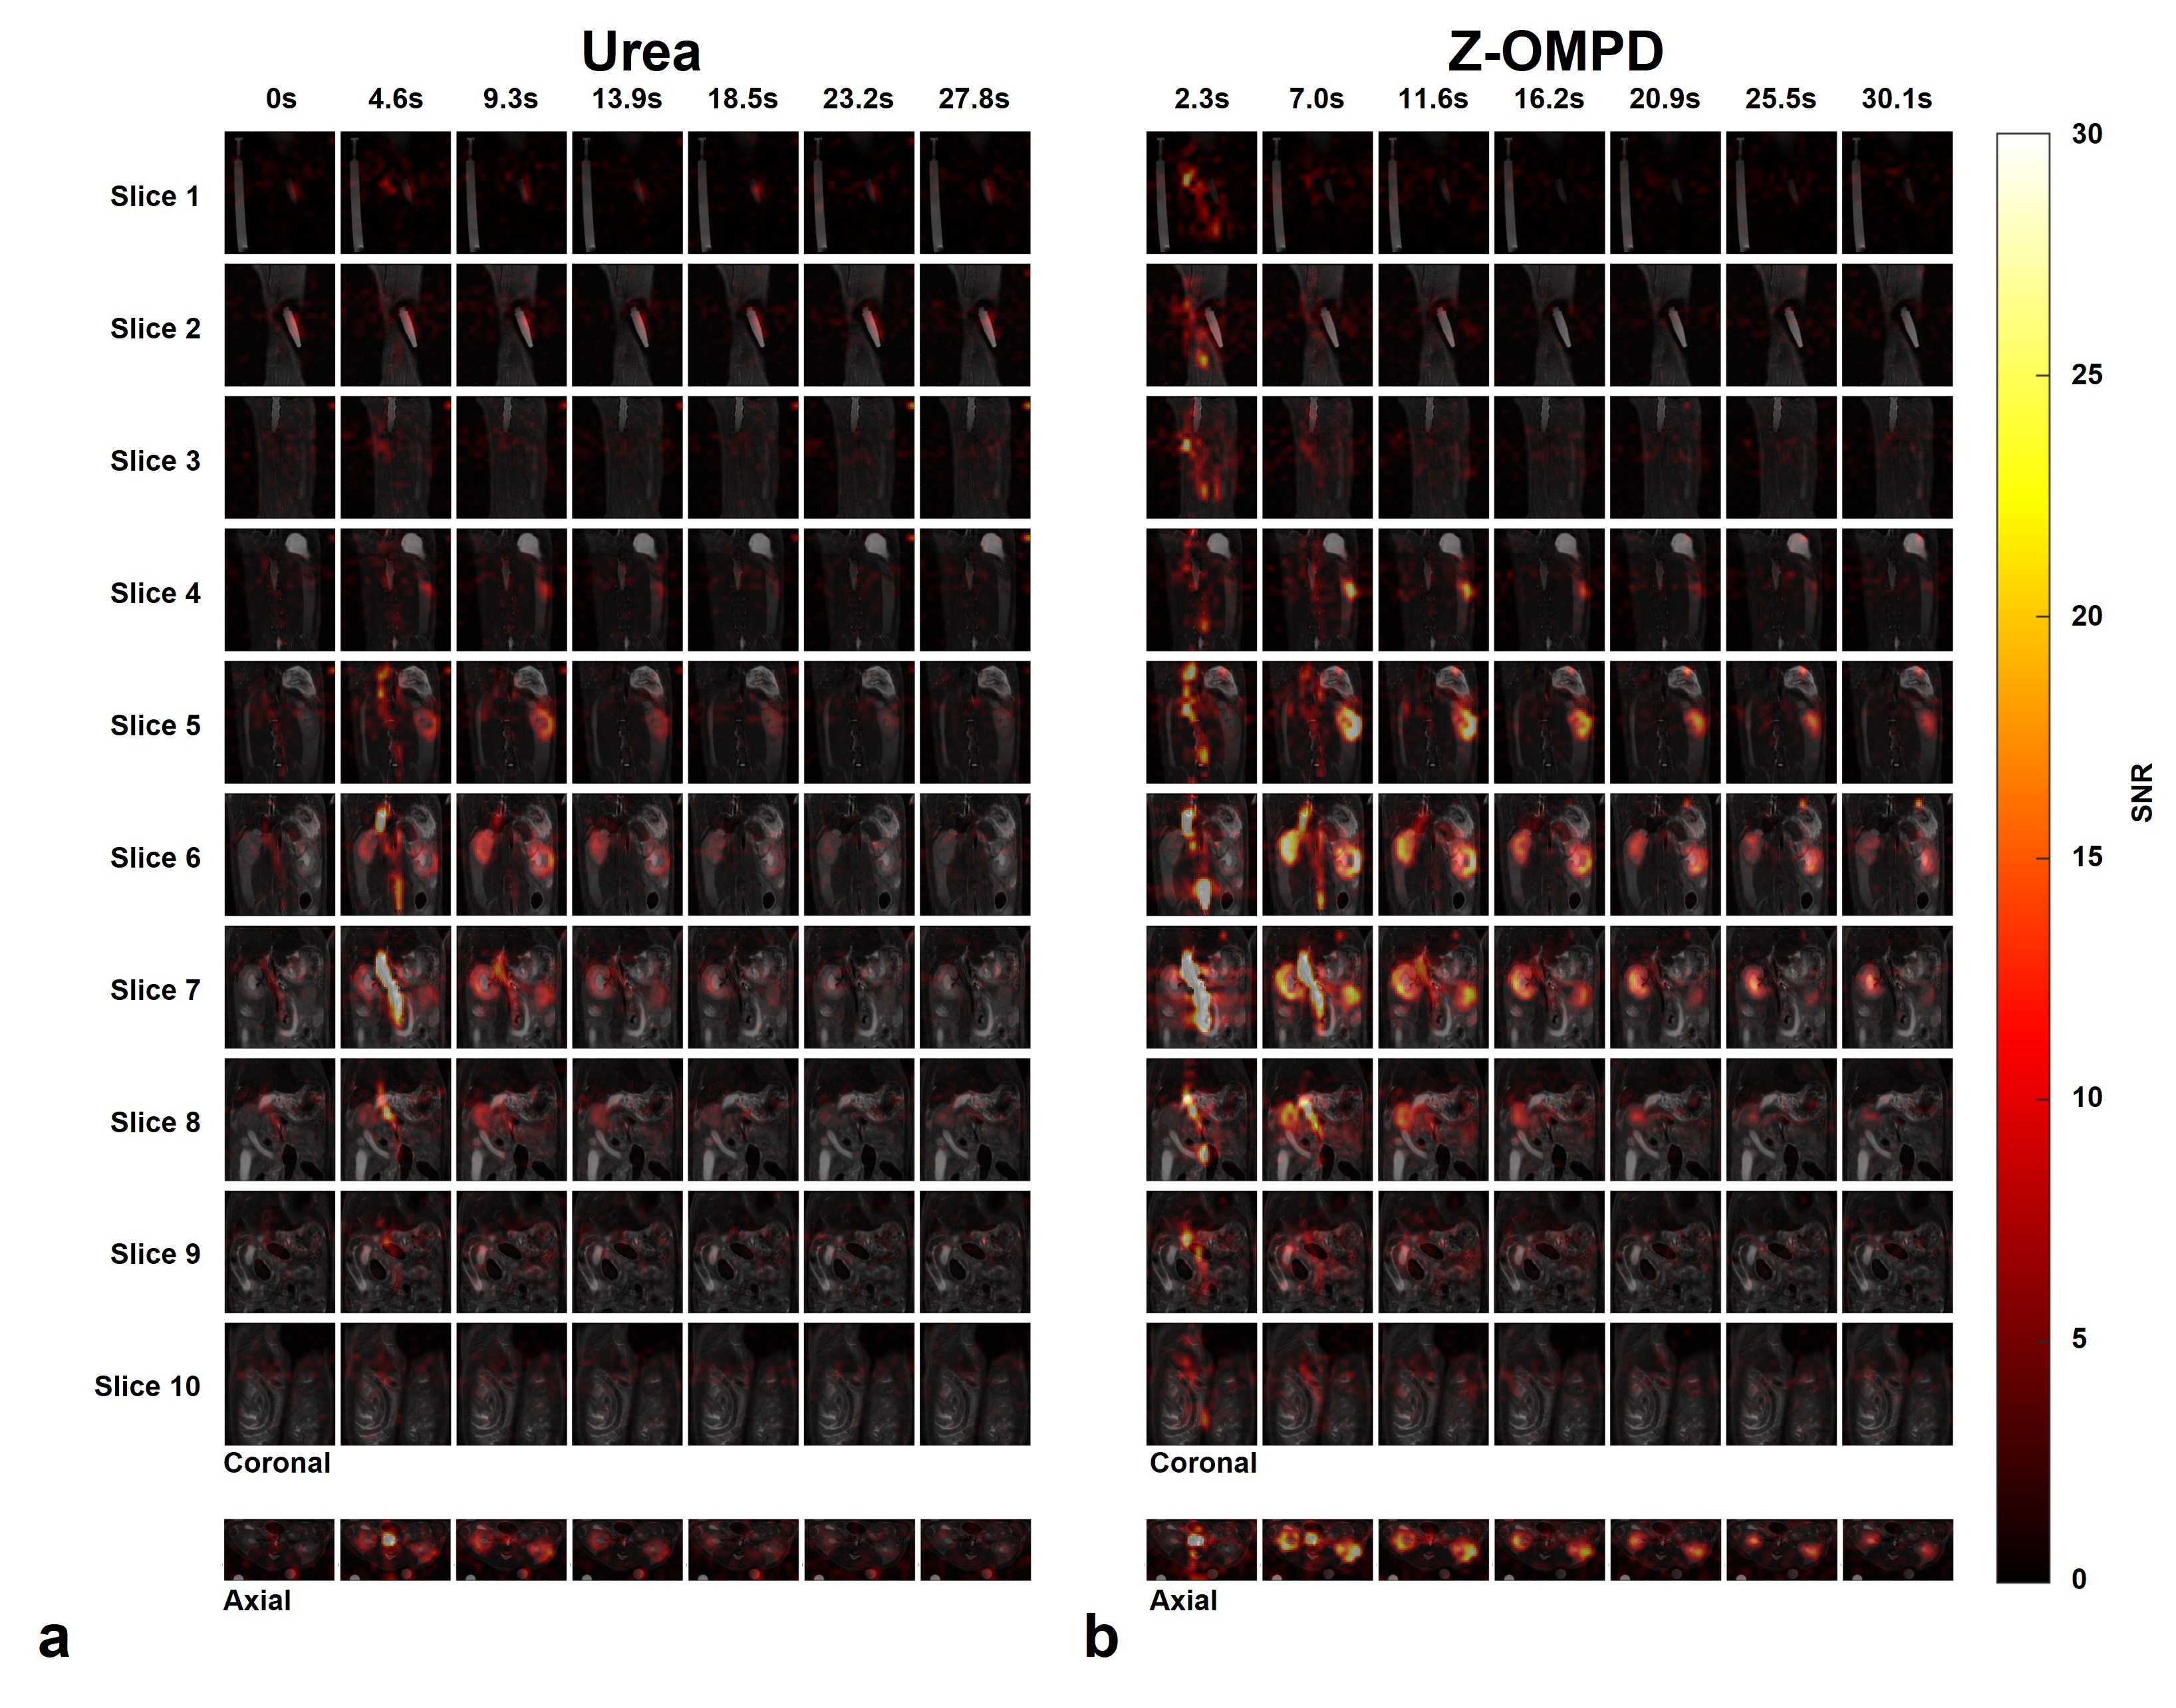
Hyperpolarized MRI/MRS: The C1-resonance of Z-OMPD and 13C-urea were alternatingly imaged by off-resonant narrow bandwidth excitation with a 3D balanced steady-state free precession (bSSFP) sequence using FA = 12°, excitation bandwidth = 180 Hz, TE = 6.4 ms, TR = 12.8 ms, FOV = 60 x 54 x 30 mm³, matrix = 20 x 18 x 10, resolution 3 mm³, scan time per agent = 2.3 s, 7 frames per agent. Dynamic slice spectroscopy used FA = 10°, excitation bandwidth = 12 kHz, TR = 3 s, slice thickness 15 mm.
Calculation of glomerular filtration rates and renal blood flow: GFR-calculation used time curves from 3D regions covering the renal cortex and renal pelvis or from pH-shifted distinguishable C5-peaks of cortex and pelvis in slice spectra. Time curves were decay-corrected and fitted using the Baumann-Rudin model10,12:
$$\frac{dC_{pelvis}(t)}{dt}=k_{cl}C_{cortex}(t)$$
with Cpelvis(t) and Ccortex(t) being the time curves for cortex and pelvis and kcl the clearance rate. GFRs were obtained from linear slopes at late time points in the dynamic bSSFP acquisitions by multiplication with kidney volumes. Total glomerular filtration rates (tGFR) are the summed GFRs for both kidneys. Renal blood flow (RBF) for individual kidneys was calculated from 3D regions on a central blood vessel and the renal cortex according to
$$RBF=\frac{\sum AUC_{cortex}}{\Delta t\sum AIF}$$
with AUCcortex being the cortex signal, AIF being the vessel signal and Δt the inter-frame delay.
Results
3D acquisitions of co-injected 13C-urea (Fig. 1a) and the C1-resonance of Z-OMPD (Fig. 1b) allow direct comparison of renal perfusion and filtration between both agents. Here, the longer in vivo T1 of Z-OMPD yields higher SNR for tracking of bolus arrival in the central vessel, accumulation in the renal cortex, and filtration to the renal pelvis. Time curves from the renal cortex (blue) and pelvis (yellow) (Fig. 2a) for 13C-urea (Fig. 2b) and Z-OMPD (Fig. 2c) were T1-decay corrected (Fig. 2d, e) and periods of constant cortex- and linear medulla signal used for GFR-fitting. GFRs show considerable variation (0.5-3.5 ml/min) while measurements between agents correlate strongly (r = 0.88, Fig. 3a). tGFR-values for Z‑OMPD (tGFR = 4.2 ± 1.2 ml/min, n = 8) appear to be higher (p = 0.002) compared to 13C-urea (tGFR = 3.3 ± 0.9 ml/min, n = 7, Fig. 3b). RBFs from time curves on central vessels and the cortex (Fig. 4a, b) vary strongly (1-7 ml/min/mltissue), with strong correlation for both agents (r = 0.90, Fig. 4c). tRBF appears to be slightly elevated for Z-OMPD (n = 9) compared to 13C-urea (n = 8) (p = 0.03, Fig. 4d). Alternatively, renal filtration can be probed using dynamic slice-spectroscopy and exploiting the spectral separation of Z-OMPDs cortex and pelvis-related peaks at different pH values. Cortex and pelvis timeseries, extracted from series of spectra (Fig. 5b) covering both kidneys (Fig. 5a), were decay-corrected (Fig. 5c) and fitted GFRs (tGFR = 2.9 ml/min, n = 2) match imaging-derived values.Discussion
In our study, GFRs for Z-OMPD are slightly higher compared to 13C-urea-based measurements. Here, reabsorption of 13C-urea by urea transporters during the renal filtration process13 potentially reduces the amount of urea filtrated to the pelvis, resulting in lower observed GFR. Nevertheless, GFRs and RBFs agree with previous studies10,14,15. One limitation of the imaging-based approach is the low temporal resolution, resulting effectively in only 4–7 time points to capture flow and filtration dynamics. Image-based assessment of renal function using Z-OMPD omits urine-14 or blood16 sampling for GFR analysis, and, in contrast to these methods, allows to distinguish differences between one kidney and the other. In addition, Z-OMPD allows for the first time GFR-assessment by dynamic spectroscopy which provides higher temporal resolution compared to imaging.Conclusion
Spectrally selective targeting of Z-OMPD’s C1-resonance and 13C-urea enables fast imaging of perfusion and filtration in 3D, allowing accurate and quantitative assessment of RBF and GFR, where Z-OMPD and 13C-urea exhibit comparable perfusion and filtration characteristics. For Z-OMPD, the pH-based separation of anatomical kidney compartments of the C5-resonance also allows localized spectroscopic assessment of renal filtration at higher temporal resolution.Acknowledgements
This research was funded by the Deutsche Forschungsgemeinschaft (DFG, German Research Foundation, Sonderforschungsbereich (SFB) 824, subprojects A7 and Z3, (grant number 391523415), the Young Academy of the Bavarian Academy of Sciences and Humanities and the European Union’s Horizon 2020 research and innovation program under grant agreement No 820374.References
1. Lacava V, Coppolino G, Puntorieri E, et al. Nephro-oncology: a link in evolution. Ren Fail 2015,37(8):1260-1266.
2. Rosner M H, Jhaveri K D, McMahon B A, et al. Onconephrology: The intersections between the kidney and cancer. CA Cancer J Clin 2021,71(1):47-77.
3. Pavuluri K, Manoli I, Pass A, et al. Noninvasive monitoring of chronic kidney disease using pH and perfusion imaging. Science Advances 2019,5(8):eaaw8357.
4. Watts J M, Whitlow C T, Maldjian J A, Clinical applications of arterial spin labeling. NMR Biomed 2013,26(8):892-900.
5. Artz N S, Sadowski E A, Wentland A L, et al. Arterial spin labeling MRI for assessment of perfusion in native and transplanted kidneys. Magn Reson Imaging 2011,29(1):74-82.
6. Chang C F, Lin C C, Current concepts of contrast-induced nephropathy: a brief review. J Chin Med Assoc 2013,76:673-681.
7. Bokacheva L, Rusinek H, Zhang J L, et al. Assessment of renal function with dynamic contrast-enhanced MR imaging. Magn Reson Imaging Clin N Am 2008,16(4):597-611.
8. Josephs S C, Techniques in interventional radiology: renal CT angiography. Tech Vasc Interv Radiol 2006,9(4):167-171.
9. Qin H, Tang S, Riselli A M, et al. Clinical translation of hyperpolarized 13C pyruvate and urea MRI for simultaneous metabolic and perfusion imaging. Magn Reson Med 2022,87(1):138-149.
10. Ostergaard Mariager C, Nielsen P M, Qi H, et al. Can Hyperpolarized 13C-Urea be Used to Assess Glomerular Filtration Rate? A Retrospective Study. Tomography 2017,3(3):146-152.
11. Wodtke P, Grashei M, van Heijster F H A, et al. Hyperpolarized 13C-labelled Z-OMPD enables in vivo pH imaging. Young Investigator Award Finalist at European Molecular Imaging Meeting 2021 Göttingen.
12. Baumann D, Rudin M, Quantitative assessment of rat kidney function by measuring the clearance of the contrast agent by Gd(DOTA) using dynamic MRI. Magnetic Resonance Imaging 2000,18(5):587-595.
13. Sands J M, Regulation of Renal Urea Transporters. J Am Soc Nephrol 1999,10(3):635-646.
14. Pill J, Issaeva O, Woderer S, et al. Pharmacological profile and toxicity of fluorescein-labelled sinistrin, a novel marker for GFR measurements. Naunyn Schmiedebergs Arch Pharmacol 2006,373:204-211.
15. Romero C A, Cabral G, Knight R A, et al. Non-invasive measurement of renal blood flow by magnetic resonance imaging in rats. Am J Physiol Renal Physiol 2017,314(1):99-106.
16. Fischer P A, Bogoliuk C B, Ramirez A J, et al. A new procedure for evaluation of renal function without urine collection in rat. Kidney International 2000,58(3):1336-1341.
Figures
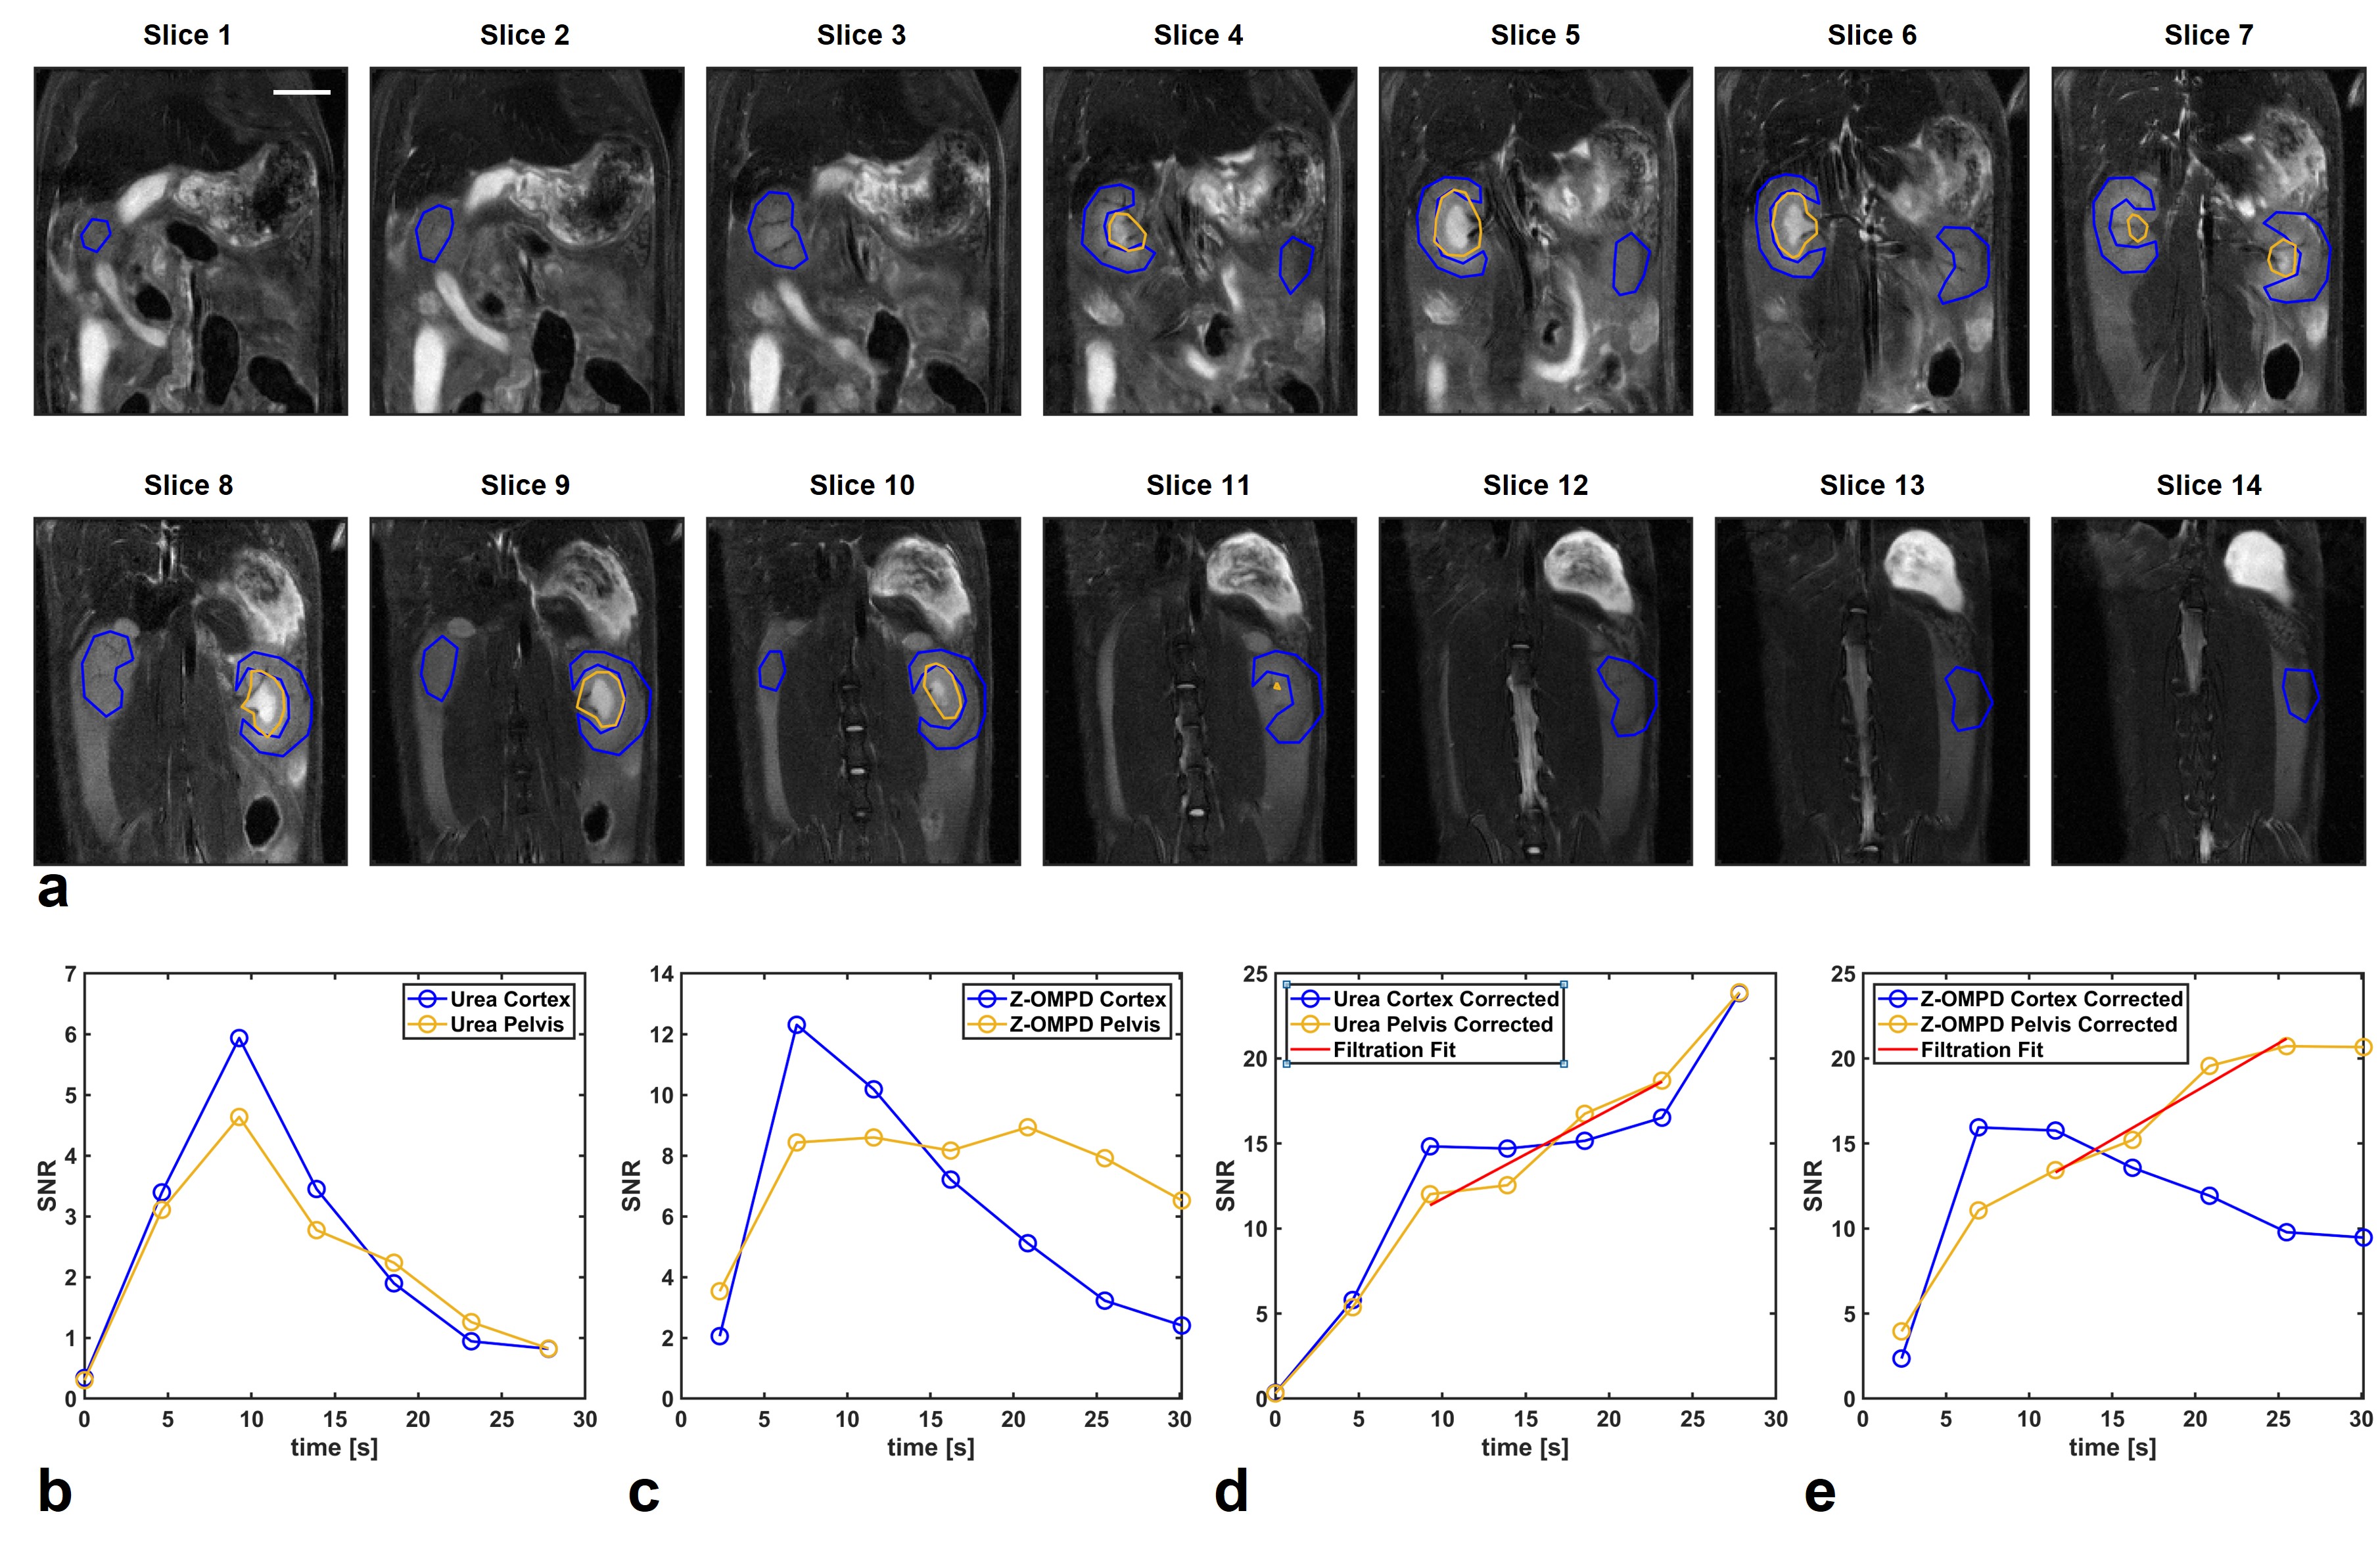
a: 3D ROIs were placed on high resolution anatomical T2-weighted images (slice thickness 1 mm) to extract signal time curves for the renal cortex (blue, kidney periphery) and the renal pelvis (yellow, kidney center). Scale bar, 10 mm.
b, c: The accumulation of 13C-urea (b) and Z-OMPD (c) in the renal cortex (blue) and pelvis (yellow) can be assessed by signal time curves from ROIs in (a).
d, e: Cortex and pelvis time curves of 13C-urea (d) and Z-OMPD (e) were T1-decay-corrected and time curve sections fitted where temporal signal evolution is mainly driven by the renal filtration process.
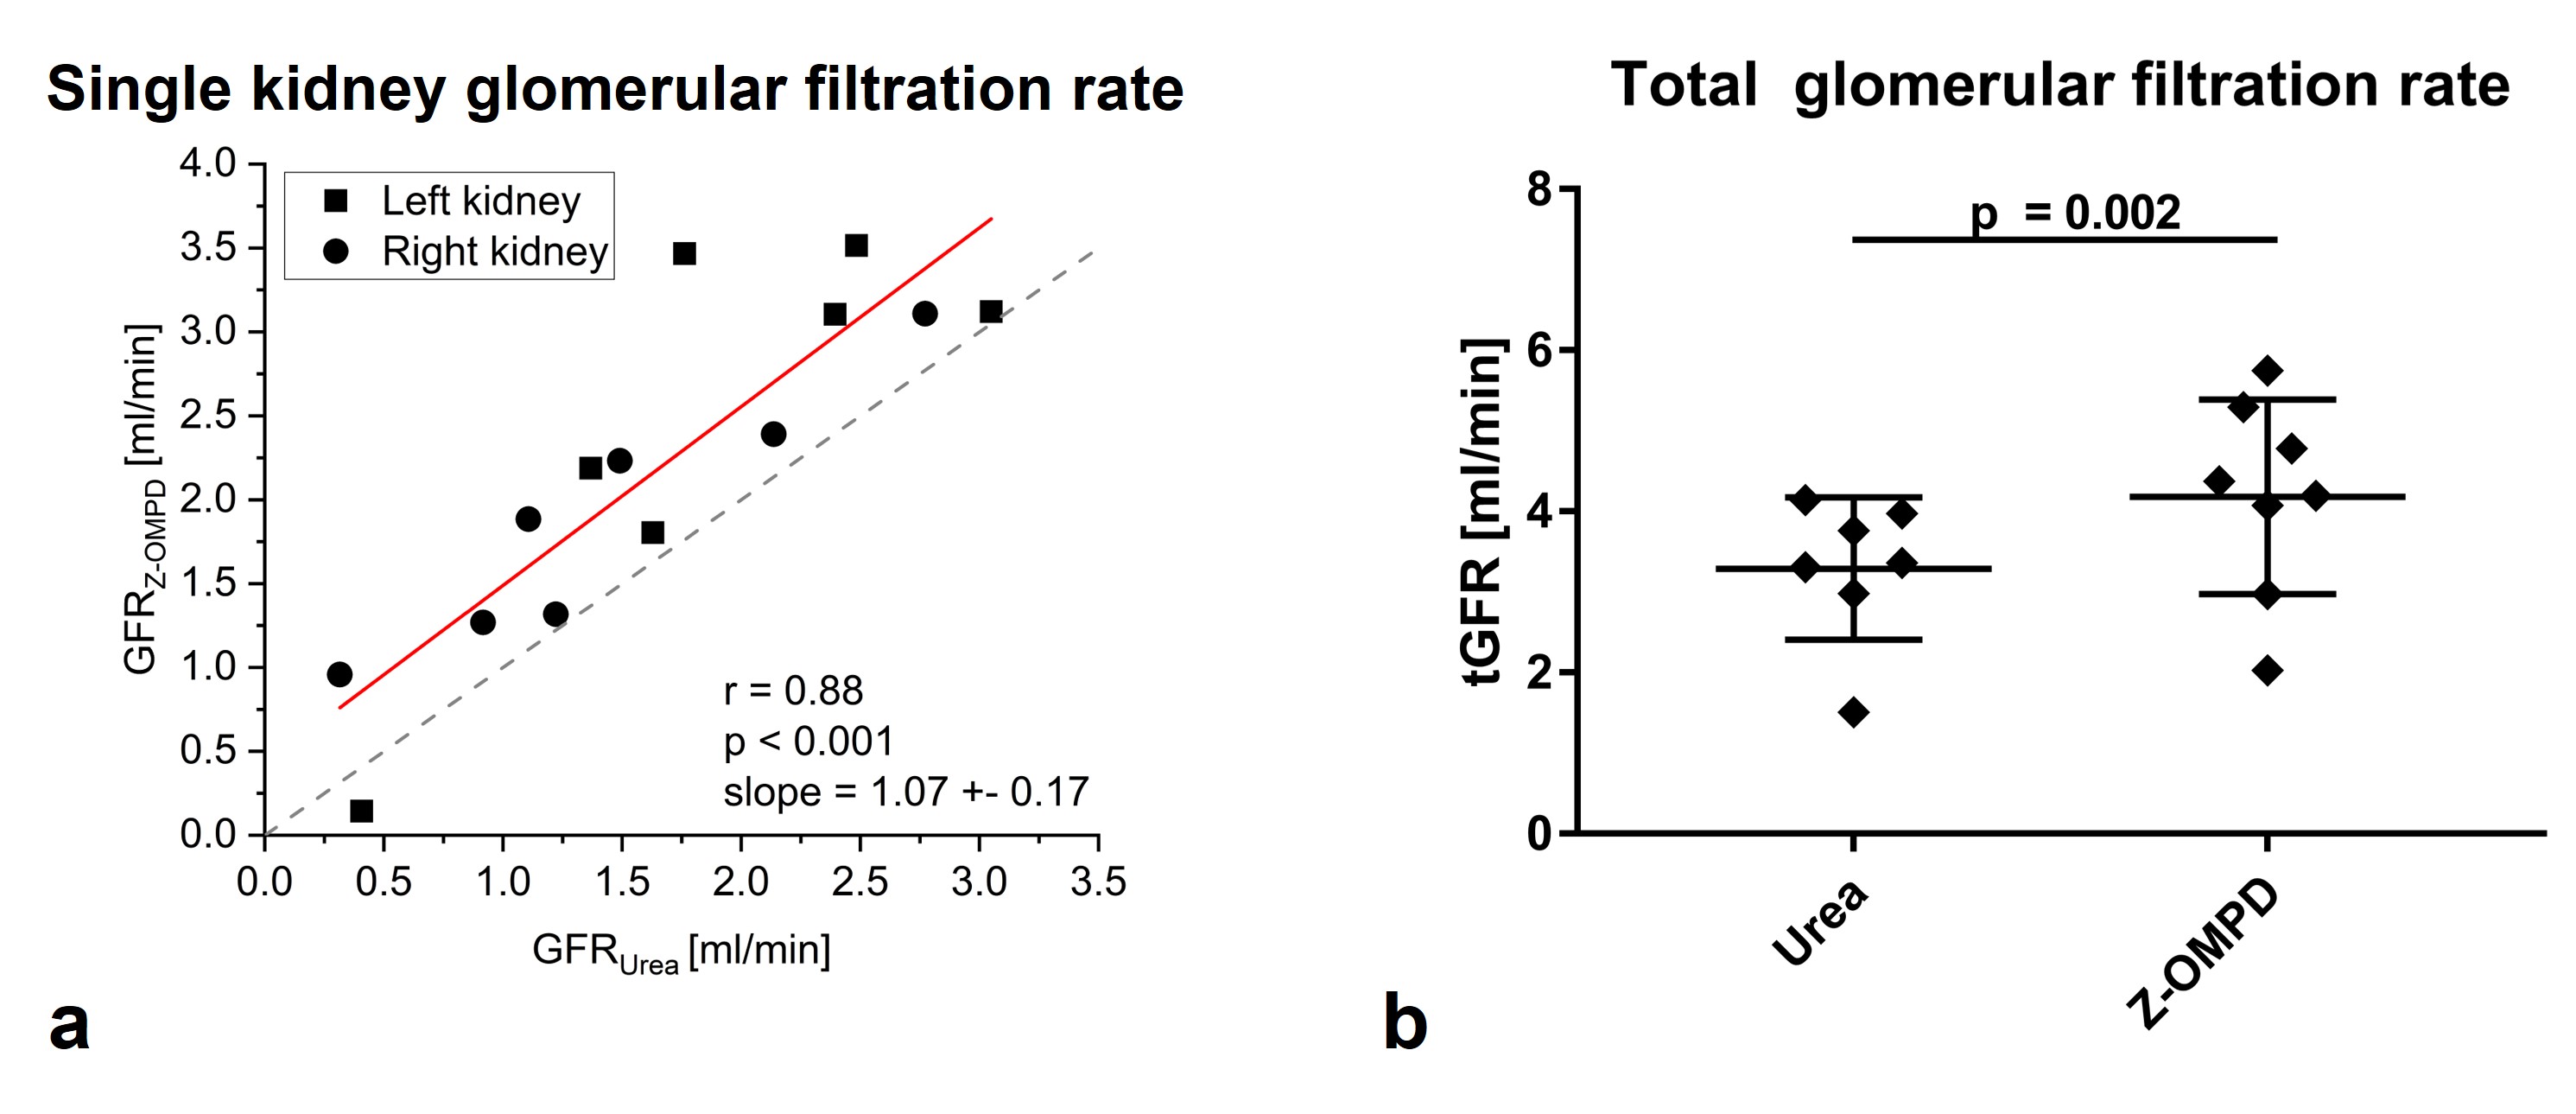
a: GFRs of single kidney show good agreement between calculations based on 13C-urea- and Z-OMPD-dynamics (r = 0.88, slope = 1.07 ± 0.17). While variations for individual kidneys and animals are well captured by both agents, Z-OMPD exhibits systematically faster clearance relative to 13C-urea.
b: Addition of both single kidney glomerular filtration rates yields total glomerular filtration rates. Faster filtration of Z-OMPD compared to 13C-urea is statistically significant (paired t-test p = 0.002) while absolute values for both compounds agree with previous studies11,15.
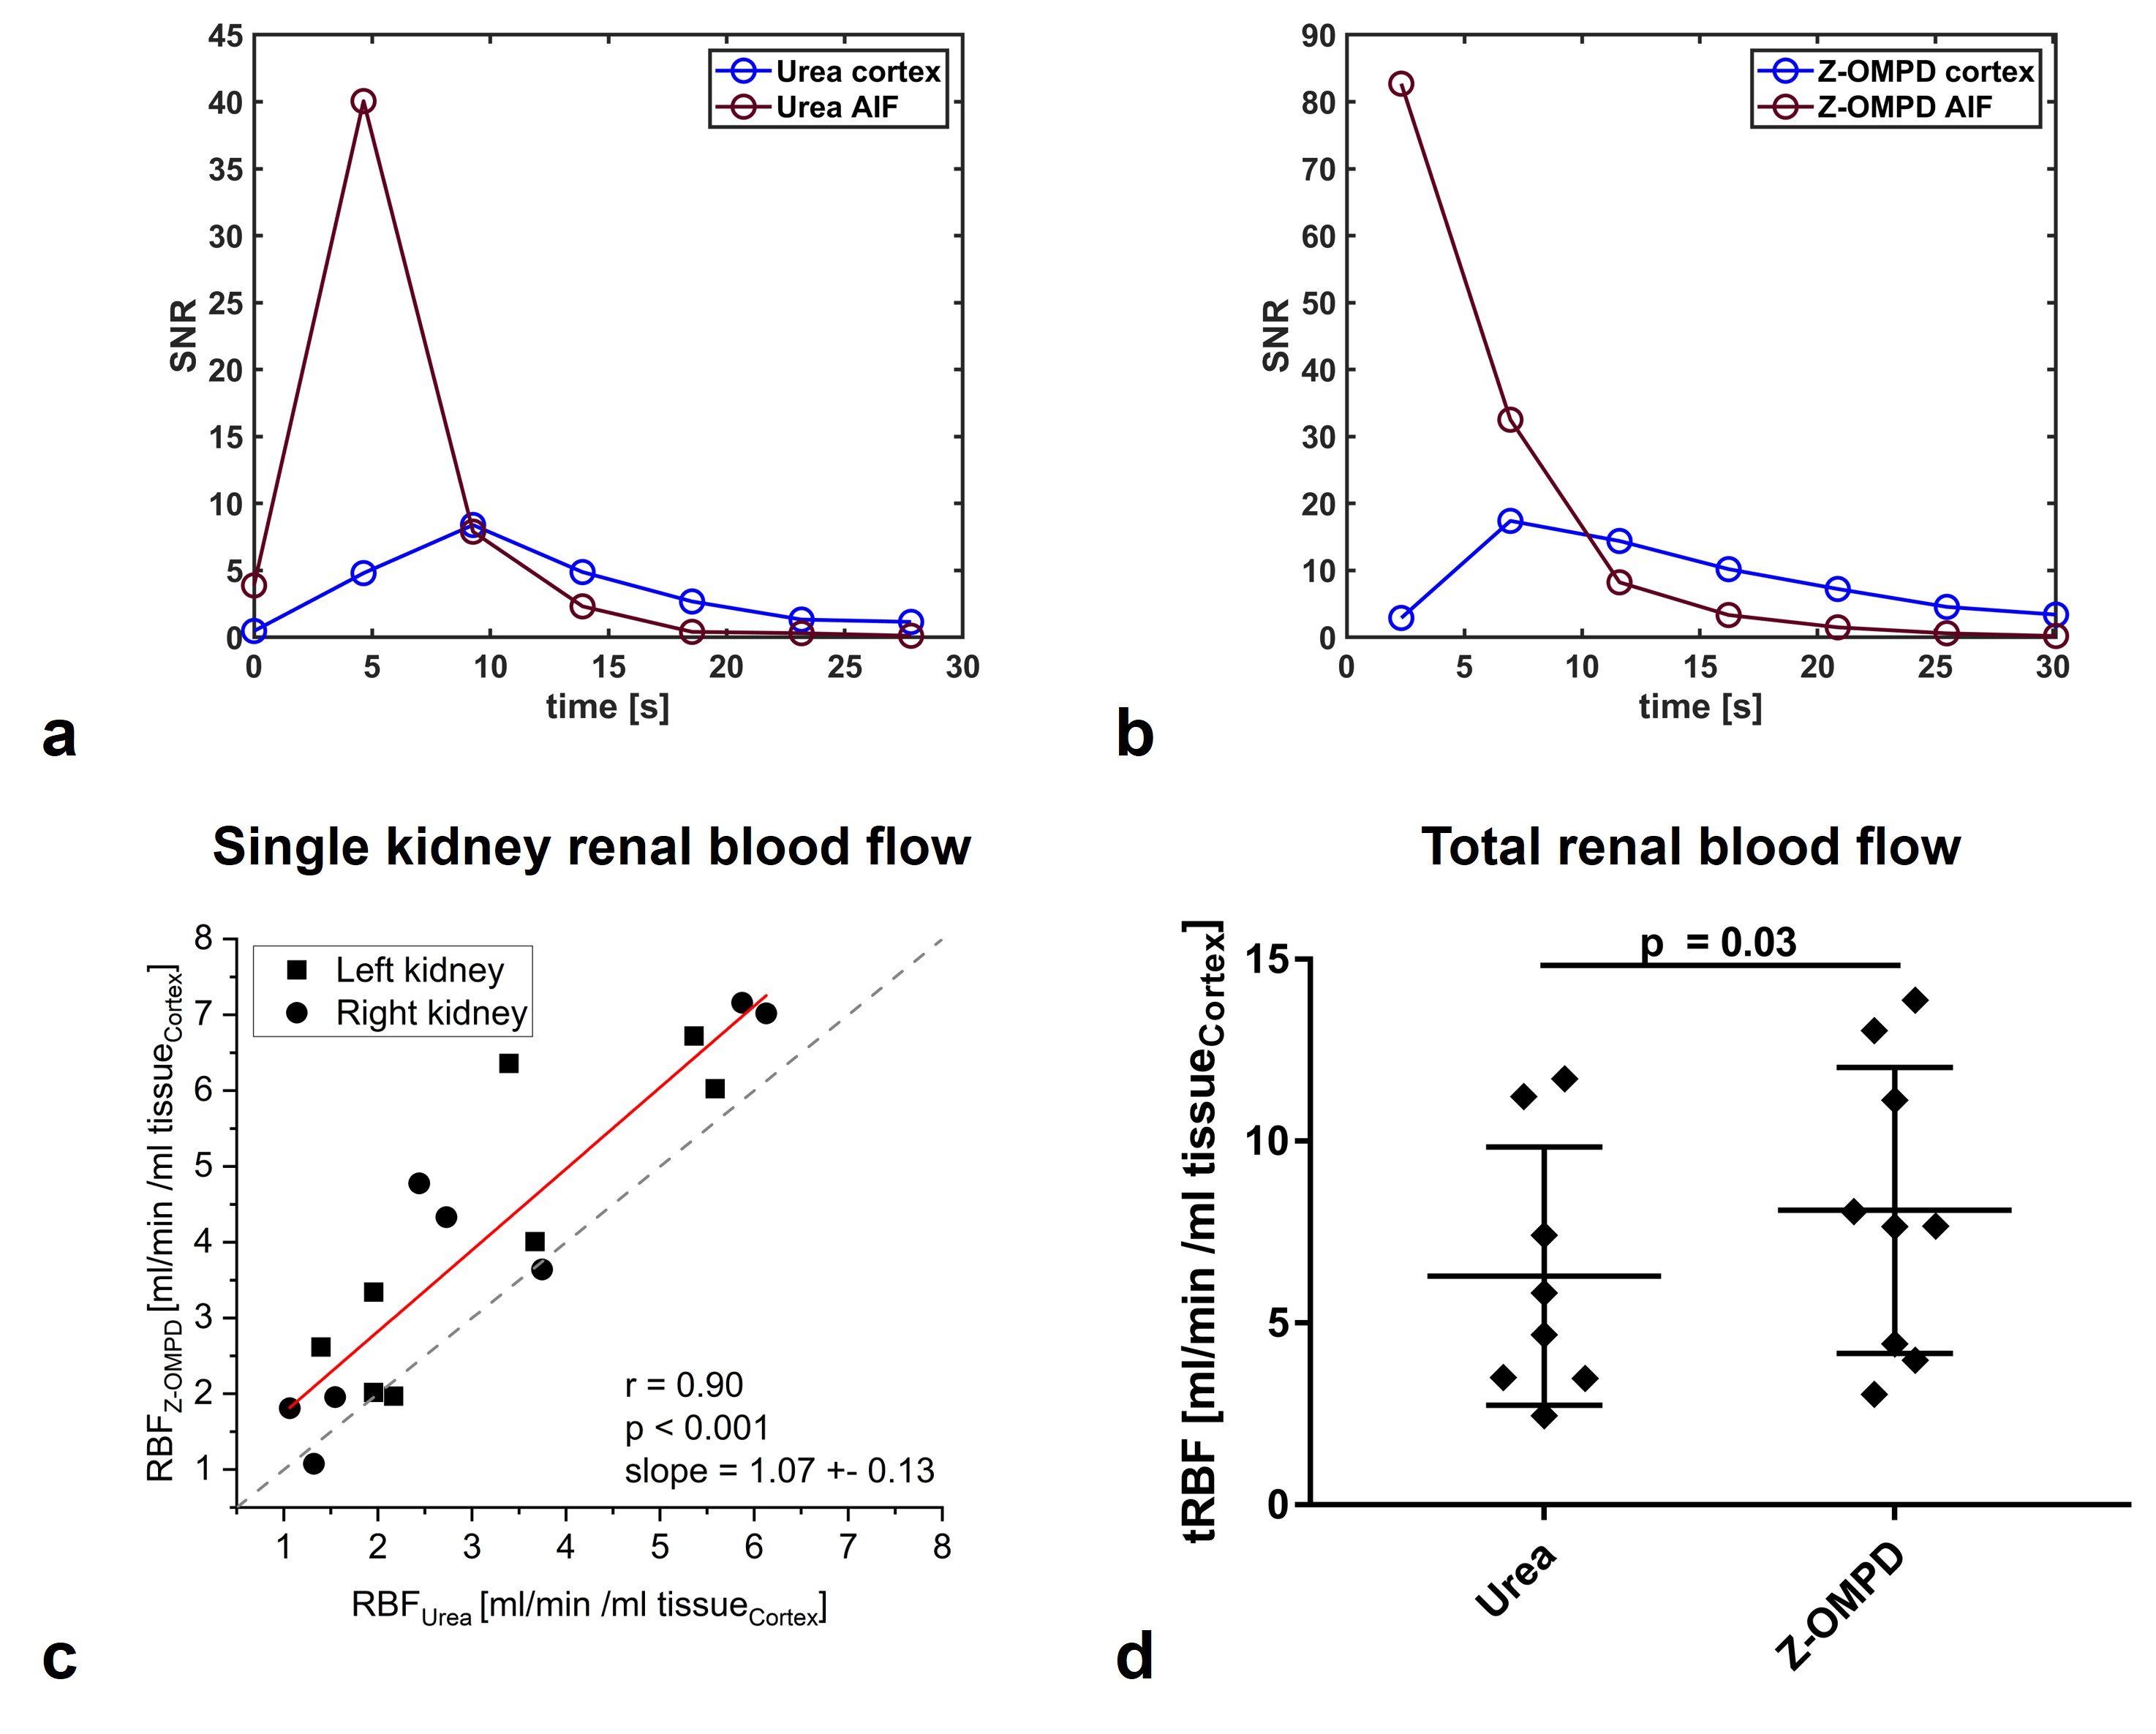
a, b: From 3D ROIs on a central vessel between the kidneys and on the renal cortex (Fig. 2a) the dynamics of 13C‑urea (a) and Z-OMPD (b) as input function (red) and flow into the cortex (blue) can be visualized.
c: RBF measured by 13C-urea and Z-OMPD agrees between both perfusion agents (r = 0.90, slope = 1.07 ± 0.13). Variations for individual kidneys are captured by both agents with slightly higher measured blood flow for Z‑OMPD.
d: Total renal blood flow (sum of both kidneys) appears to be slightly higher for Z-OMPD (p = 0.03) with absolute values agreeing with literature16.
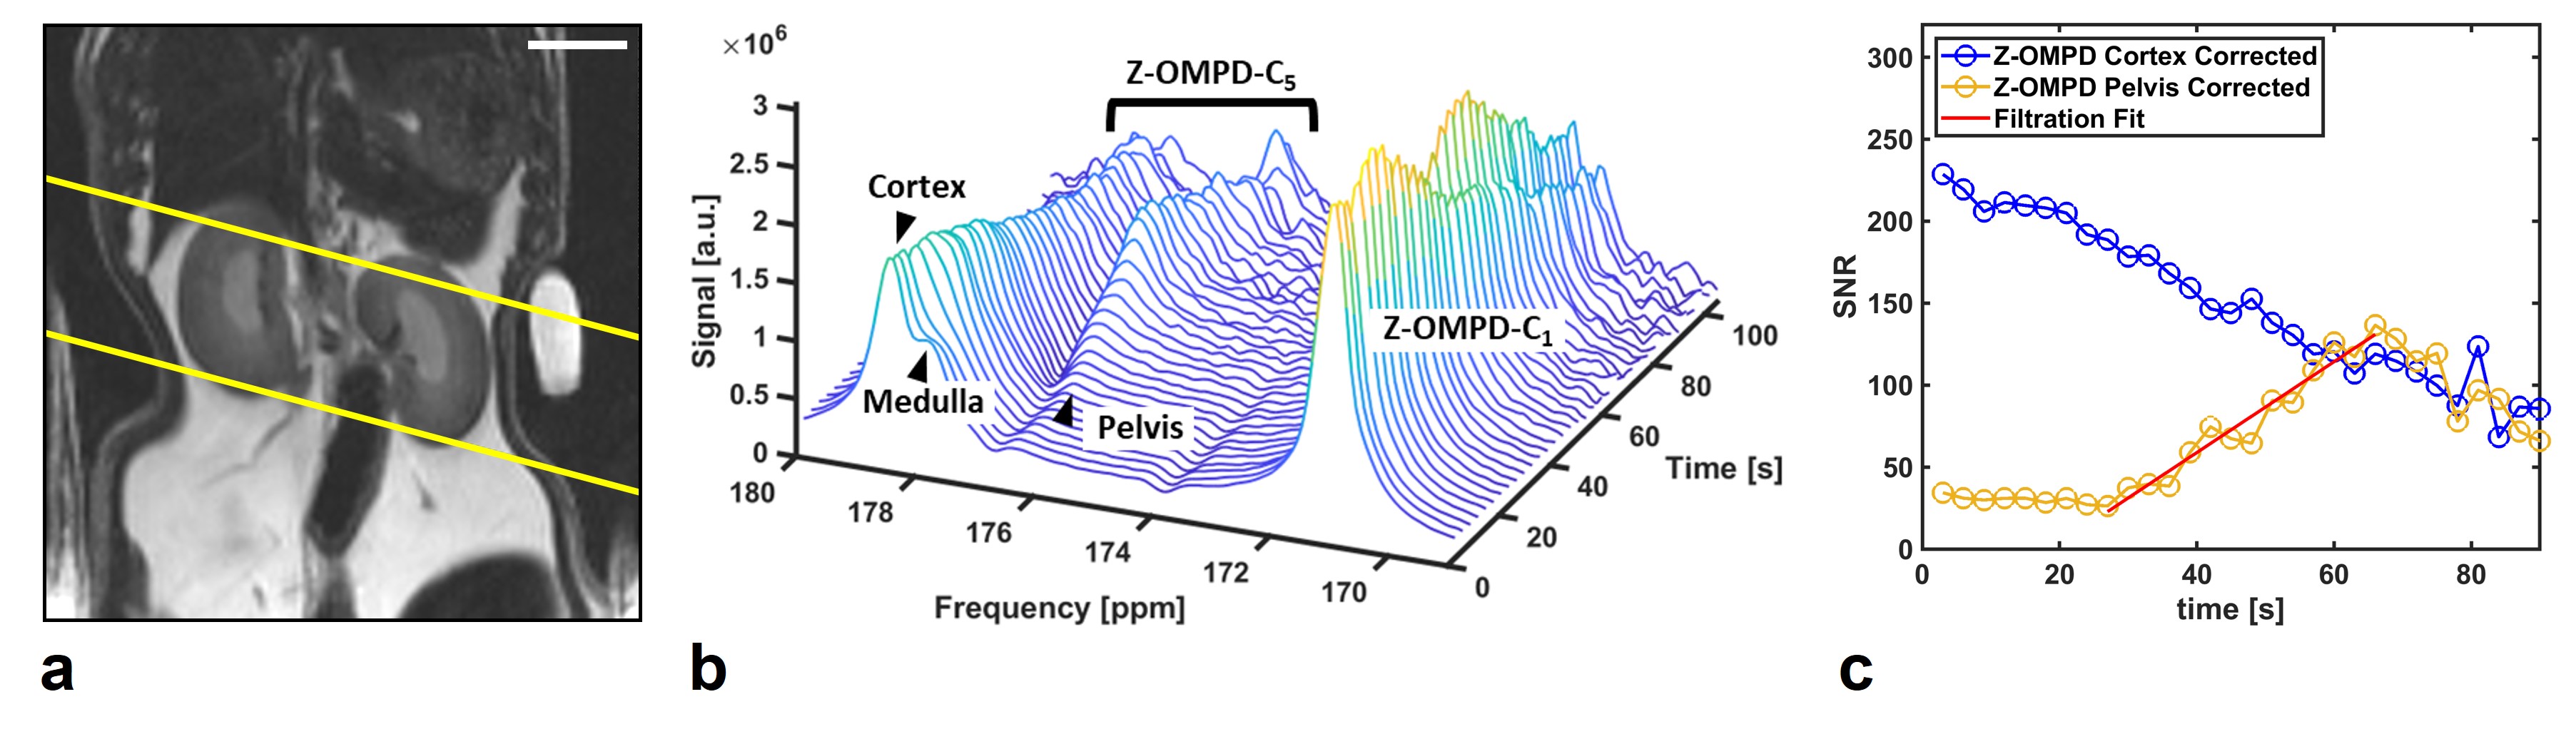
a: Axial slice positioning on healthy rat kidneys for non-imaging, spectroscopic assessment of renal filtration. Scale bar, 10 mm.
b: Waterfall plot of a dynamic slice-spectroscopy on both kidneys. Due to different pH milieus, the anatomical regions of the kidney, namely the renal cortex, medulla and pelvis are distinguishable as individual peaks for the C5-resonance of Z-OMPD.
c: tGFR values can be calculated from spectroscopic data only by fitting of the time curves of the cortex- (blue) and the pelvis peak integrals (yellow).