0815
Automated Brain Tumour Segmentation in Glioblastoma: Can similar performance be achieved using a shorter imaging protocol?1Institute for Systems and Robotics - Lisboa and Department of Bioengineering, Instituto Superior Técnico, Universidade de Lisboa, Lisbon, Portugal, 2King's College London, London, United Kingdom
Synopsis
Keywords: Segmentation, Brain
The same deep learning model was trained for automated segmentation of glioblastoma tumour regions using either four or two MRI modalities. The performance of the model trained with only two images was found to be comparable to that of the longer protocol, suggesting that the excluded images and the consequent longer training time did not contribute significantly to the accuracy of the model. These findings strongly imply that this training approach may be beneficial for clinical applications, as it would result in reduced costs due to shorter scanner times, lower computational requirements and increased patient throughput, without compromising segmentation accuracy.Introduction
Glioblastomas (GBM) are the most common and aggressive primary brain tumours, with a two-year life expectancy of only 20%1. GBM patients undergo intensive MRI protocols before and during treatment. Accurate image segmentation is essential for precise therapy planning and progression monitoring. The current gold standard is manual segmentation performed by expert neuroradiologists; however, it is time-consuming and prone to inter-observer variability2. Thus, reliable automated methods can greatly increase the quality and efficiency of patient care, which is crucial for expediting treatment. The Brain Tumour Segmentation (BraTS) challenge dataset has become the benchmark for automatic segmentation, inspiring the development of state-of-the-art methods. This public dataset3 includes 1251 patients, each with 3D multi-parametric MRI (mpMRI) volumes of T1-weighted (T1), T2-weighted (T2), T2-weighted FLAIR and T1-weighted contrast-enhanced (T1ce) scans, used to distinguish between the necrotic tumour core, the contrast-enhanced tumour and peritumoural edema or infiltrations4. Most proposed supervised learning segmentation methods have been trained using all four modalities2, requiring long training times and high-performance computing facilities, which may be unfeasible in clinical practice. More crucially, the number of required MRI modalities affects the minimum duration of the imaging protocol. This work aimed to evaluate the feasibility of reducing the number of input modalities to only two - FLAIR, where hyperintensities are associated to edema or tumour infiltration, and T1ce, which shows contrast agent leakage from tumour-induced neovasculature4 - to train a semantic segmentation method capable of generating a classification with comparable accuracy to models trained with the four modalities.Methods
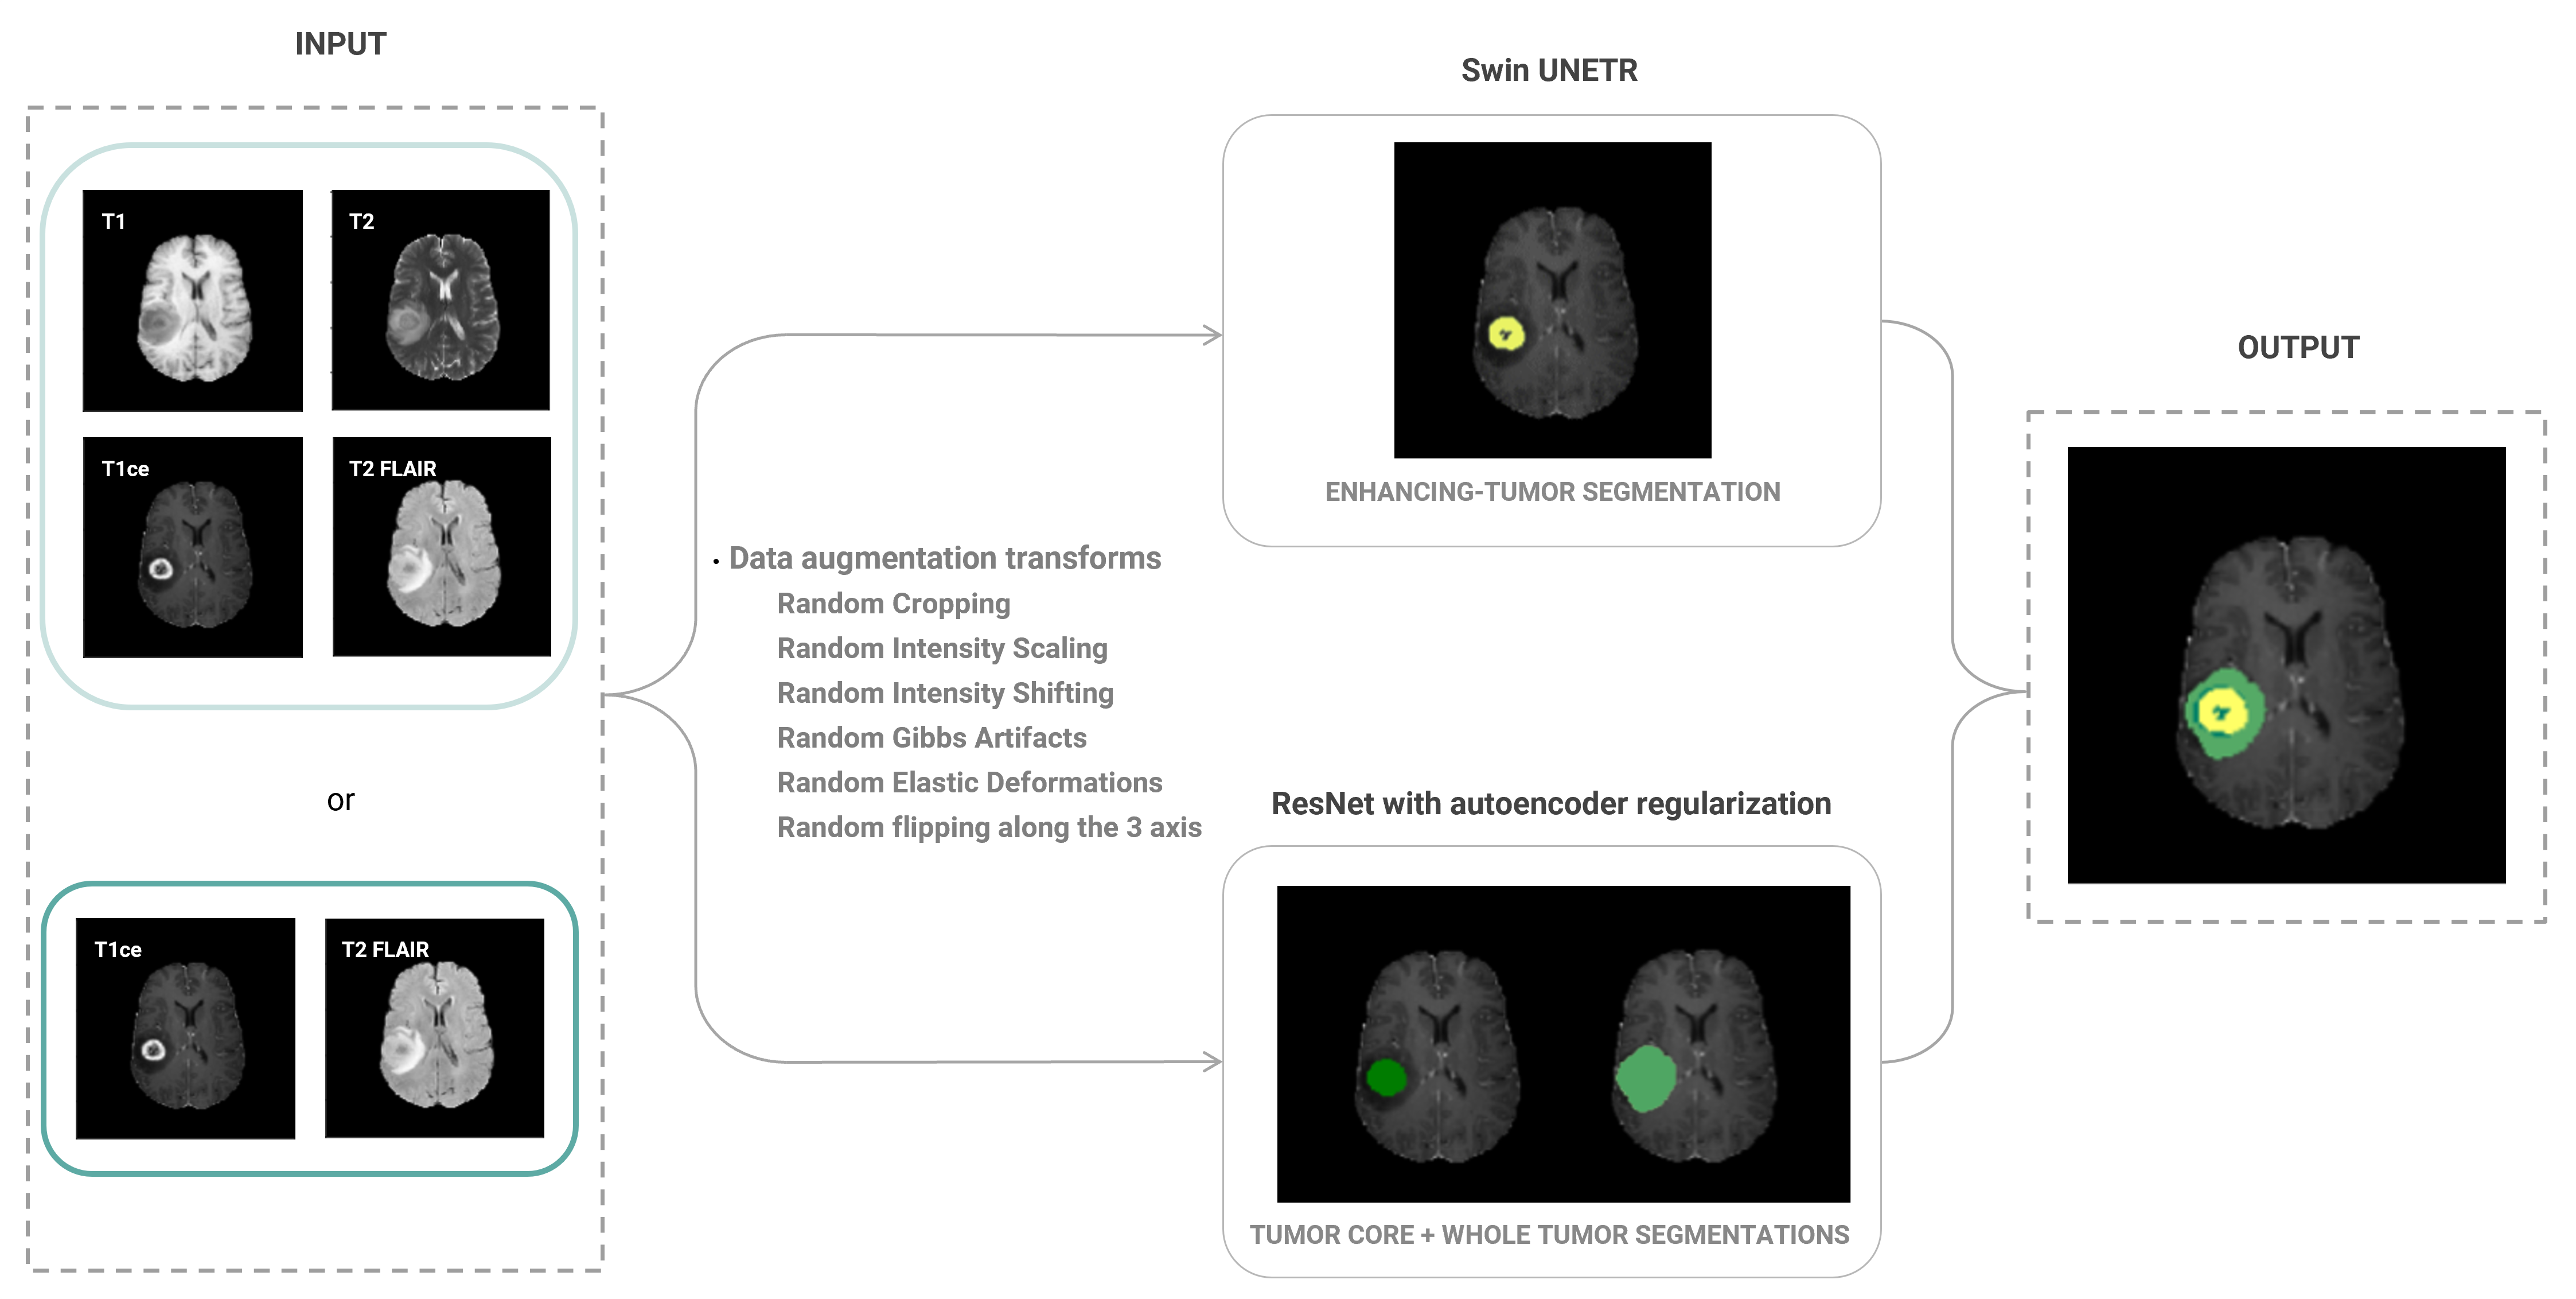
The BraTS 2021 challenge dataset was divided into subsets of 60%, 20% and 20% for training, validation and testing, respectively. We tested the performance of two network architectures for brain tumour segmentation implemented in the Medical Open Network for Artificial Intelligence (MONAI)5, a Pytorch-based open-source framework for deep learning in healthcare imaging: 1) a ResNet-based architecture using autoencoder regularisation6; 2) Swin UNEt TRansfomers (Swin UNETR), a U-shaped network that uses a Swin transformer as the encoder and a CNN-based decoder7. After normalising the signal intensity of the MRI scans and applying data augmentation transforms, the model was trained using: i) all four modalities; and ii) only two modalities. In both cases, three nested subregions were considered: Tumour Core (TC), Enhancing Tumour (ET) and the Whole Tumour (WT), including edema. Considering prior reports on the performance of each network for the different subregions, we used an ensemble model that combines the WT and TC grading from the ResNet architecture and the ET classification from the Swin UNETR (Figure 1), due to the higher accuracy of the Swin transformers in classifying smaller regions8, such as the ET. Model accuracy was assessed using the Dice coefficient of each segmented region with the respective manual segmentation labels from the BraTS dataset.Results
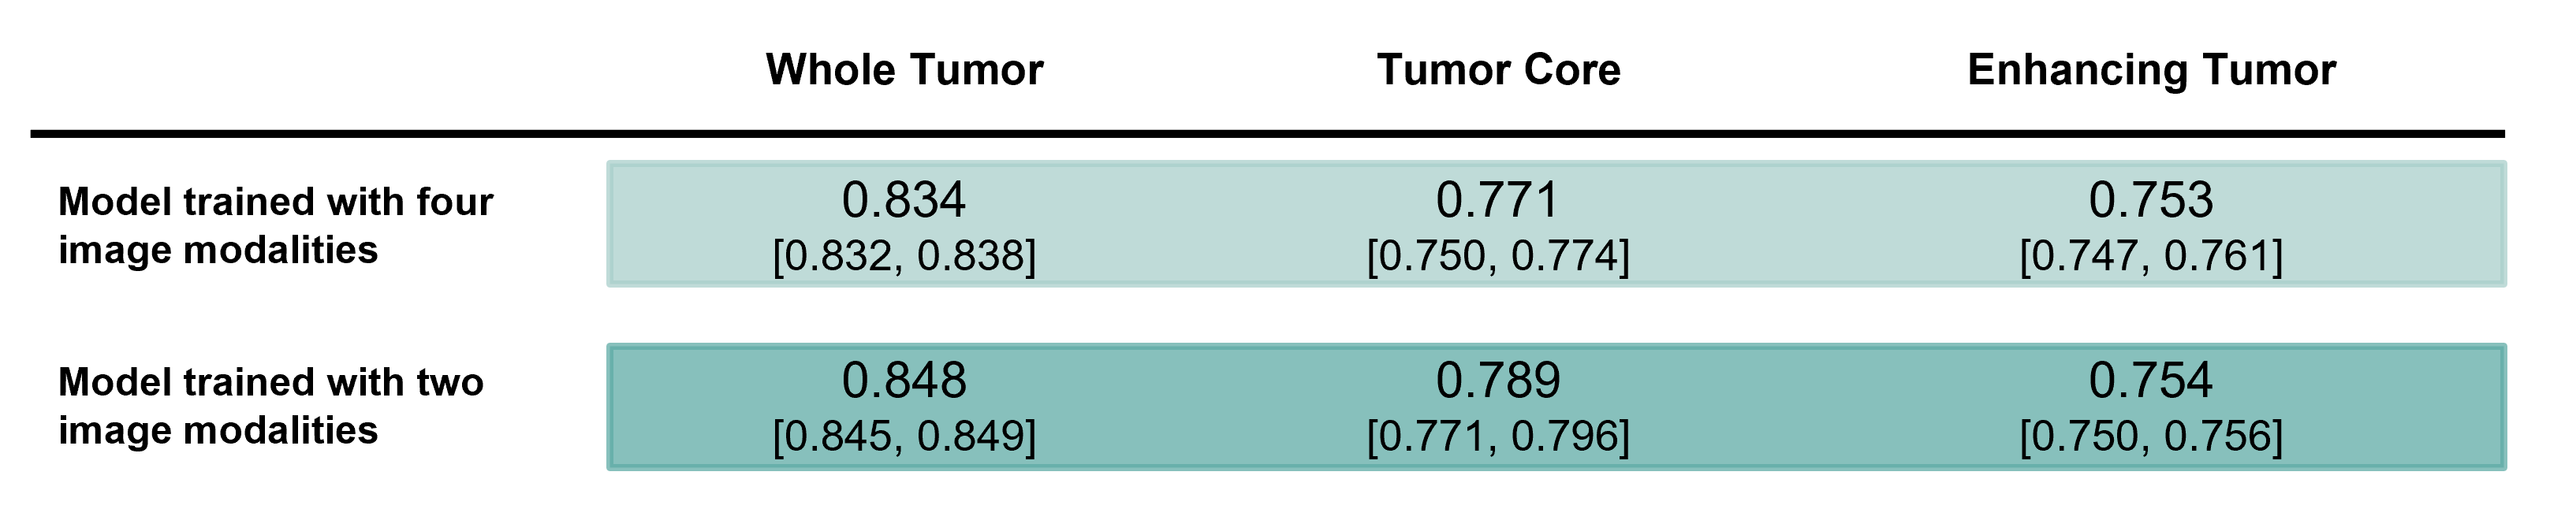
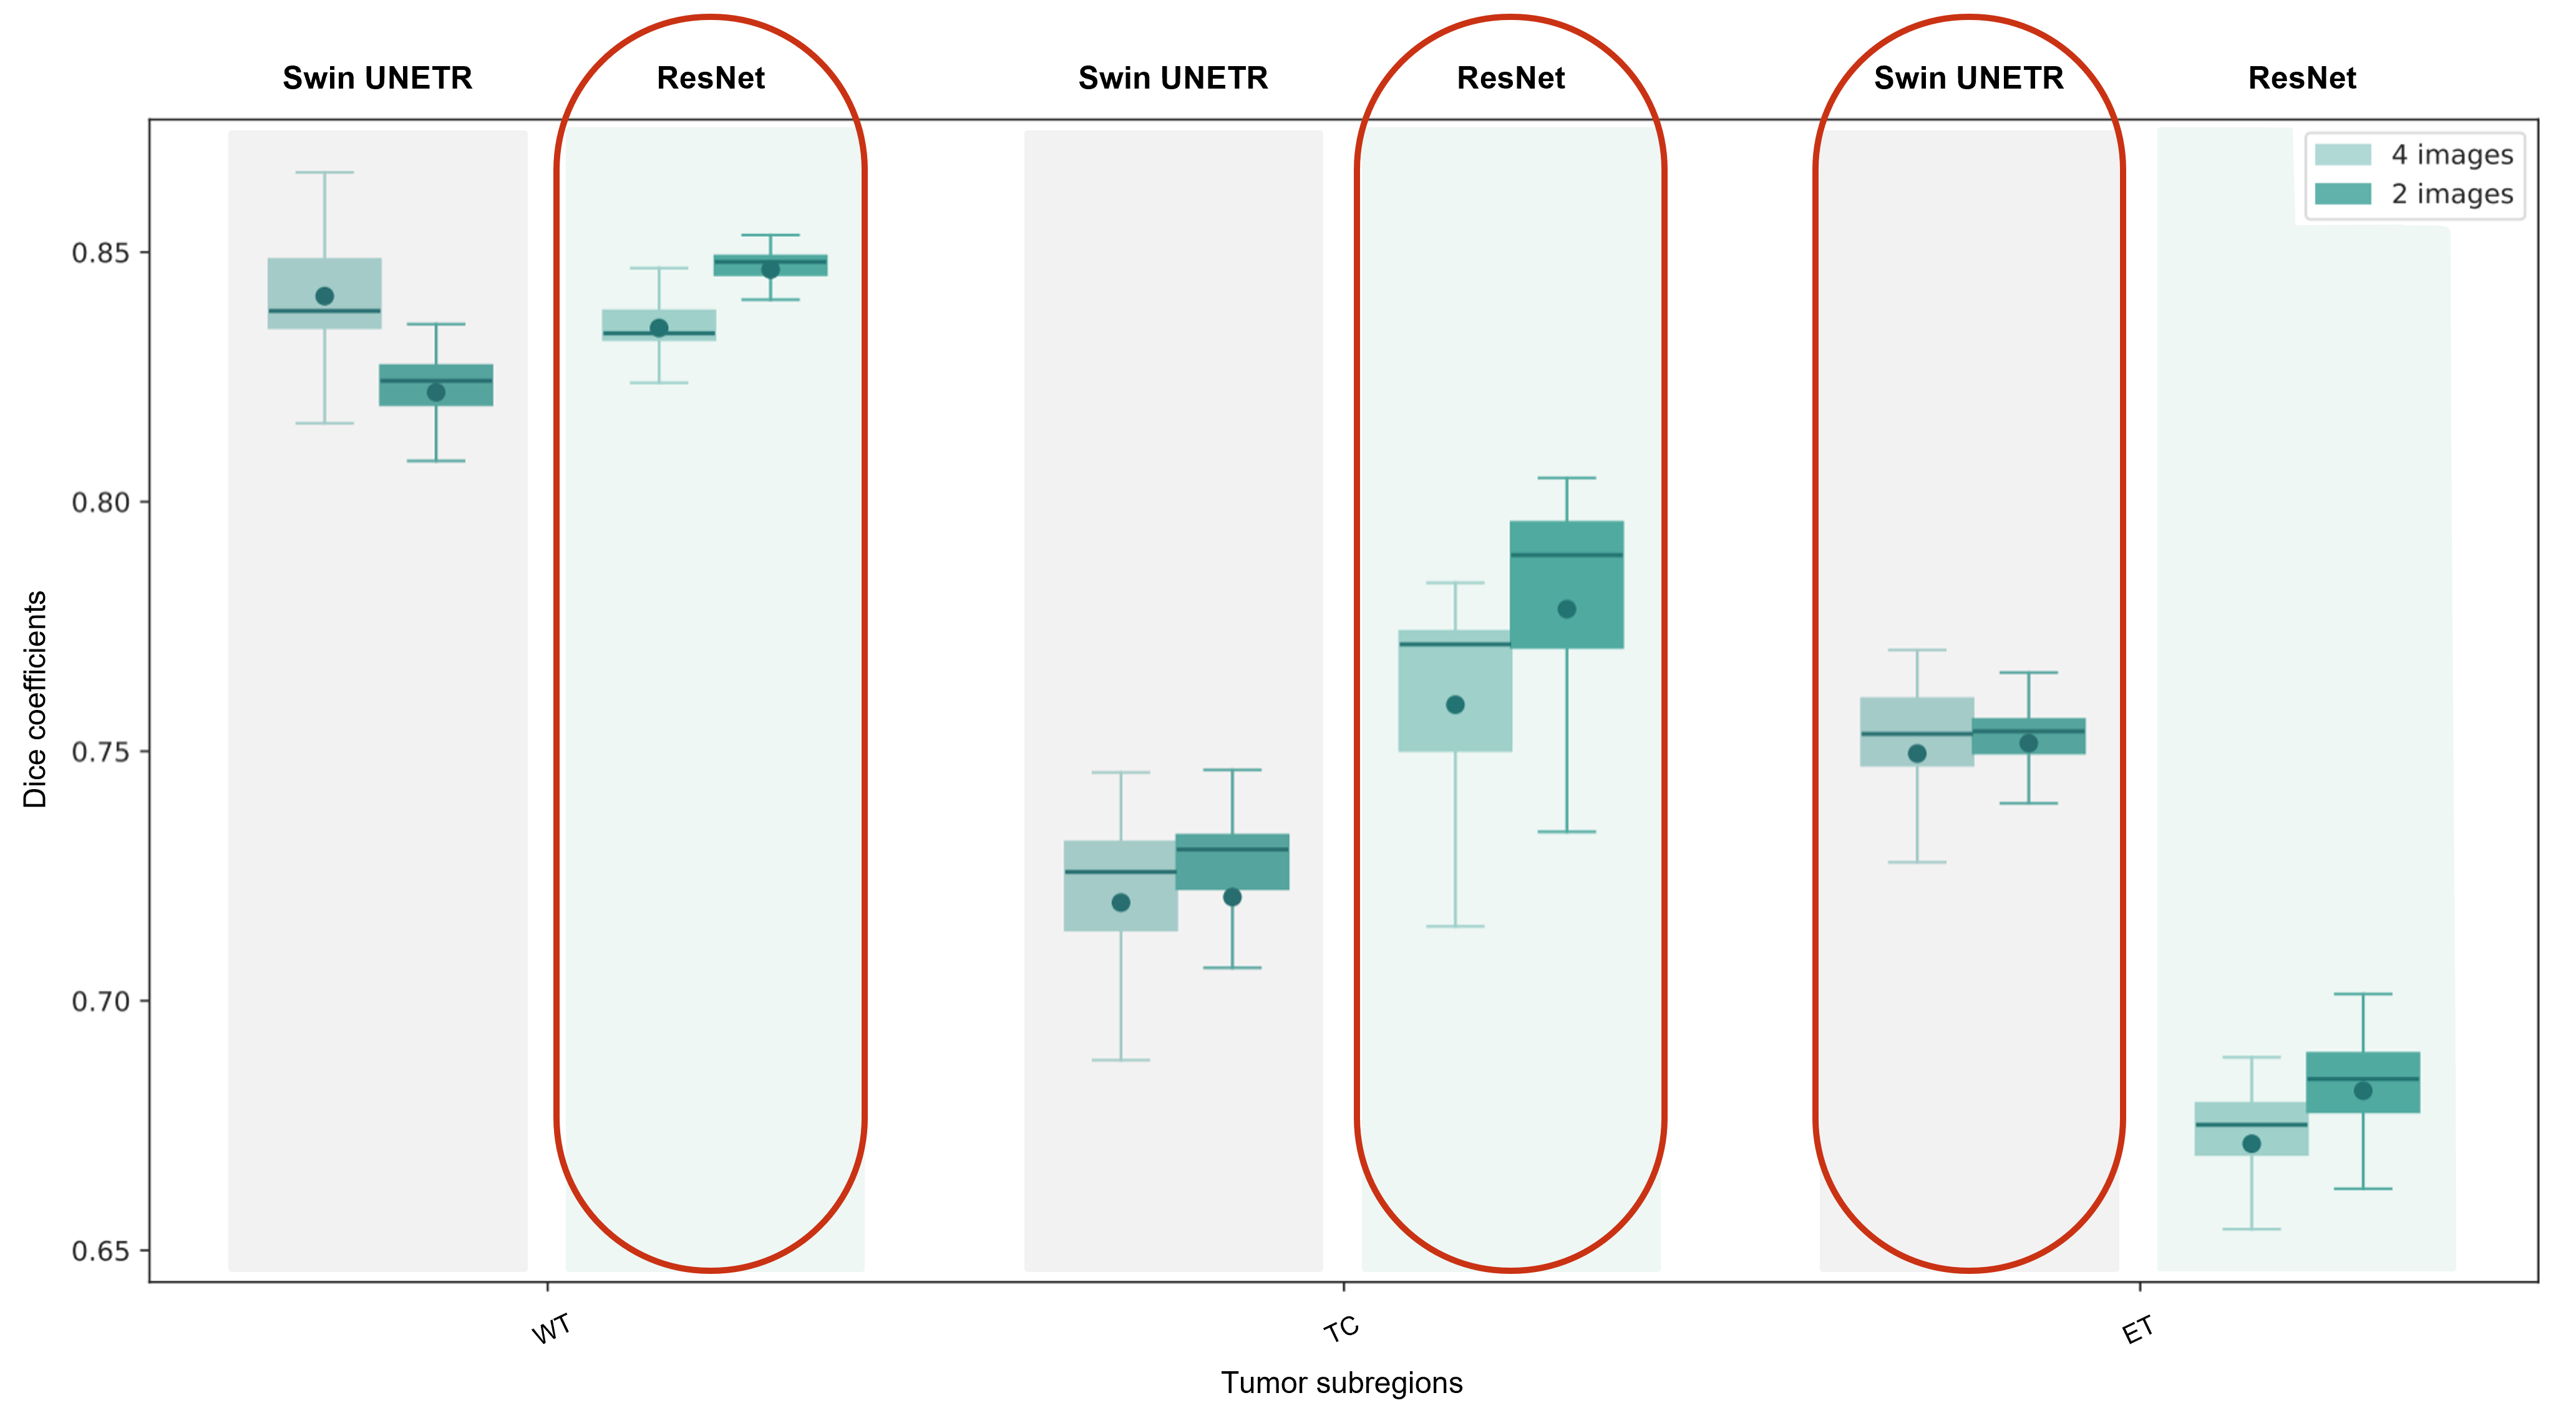
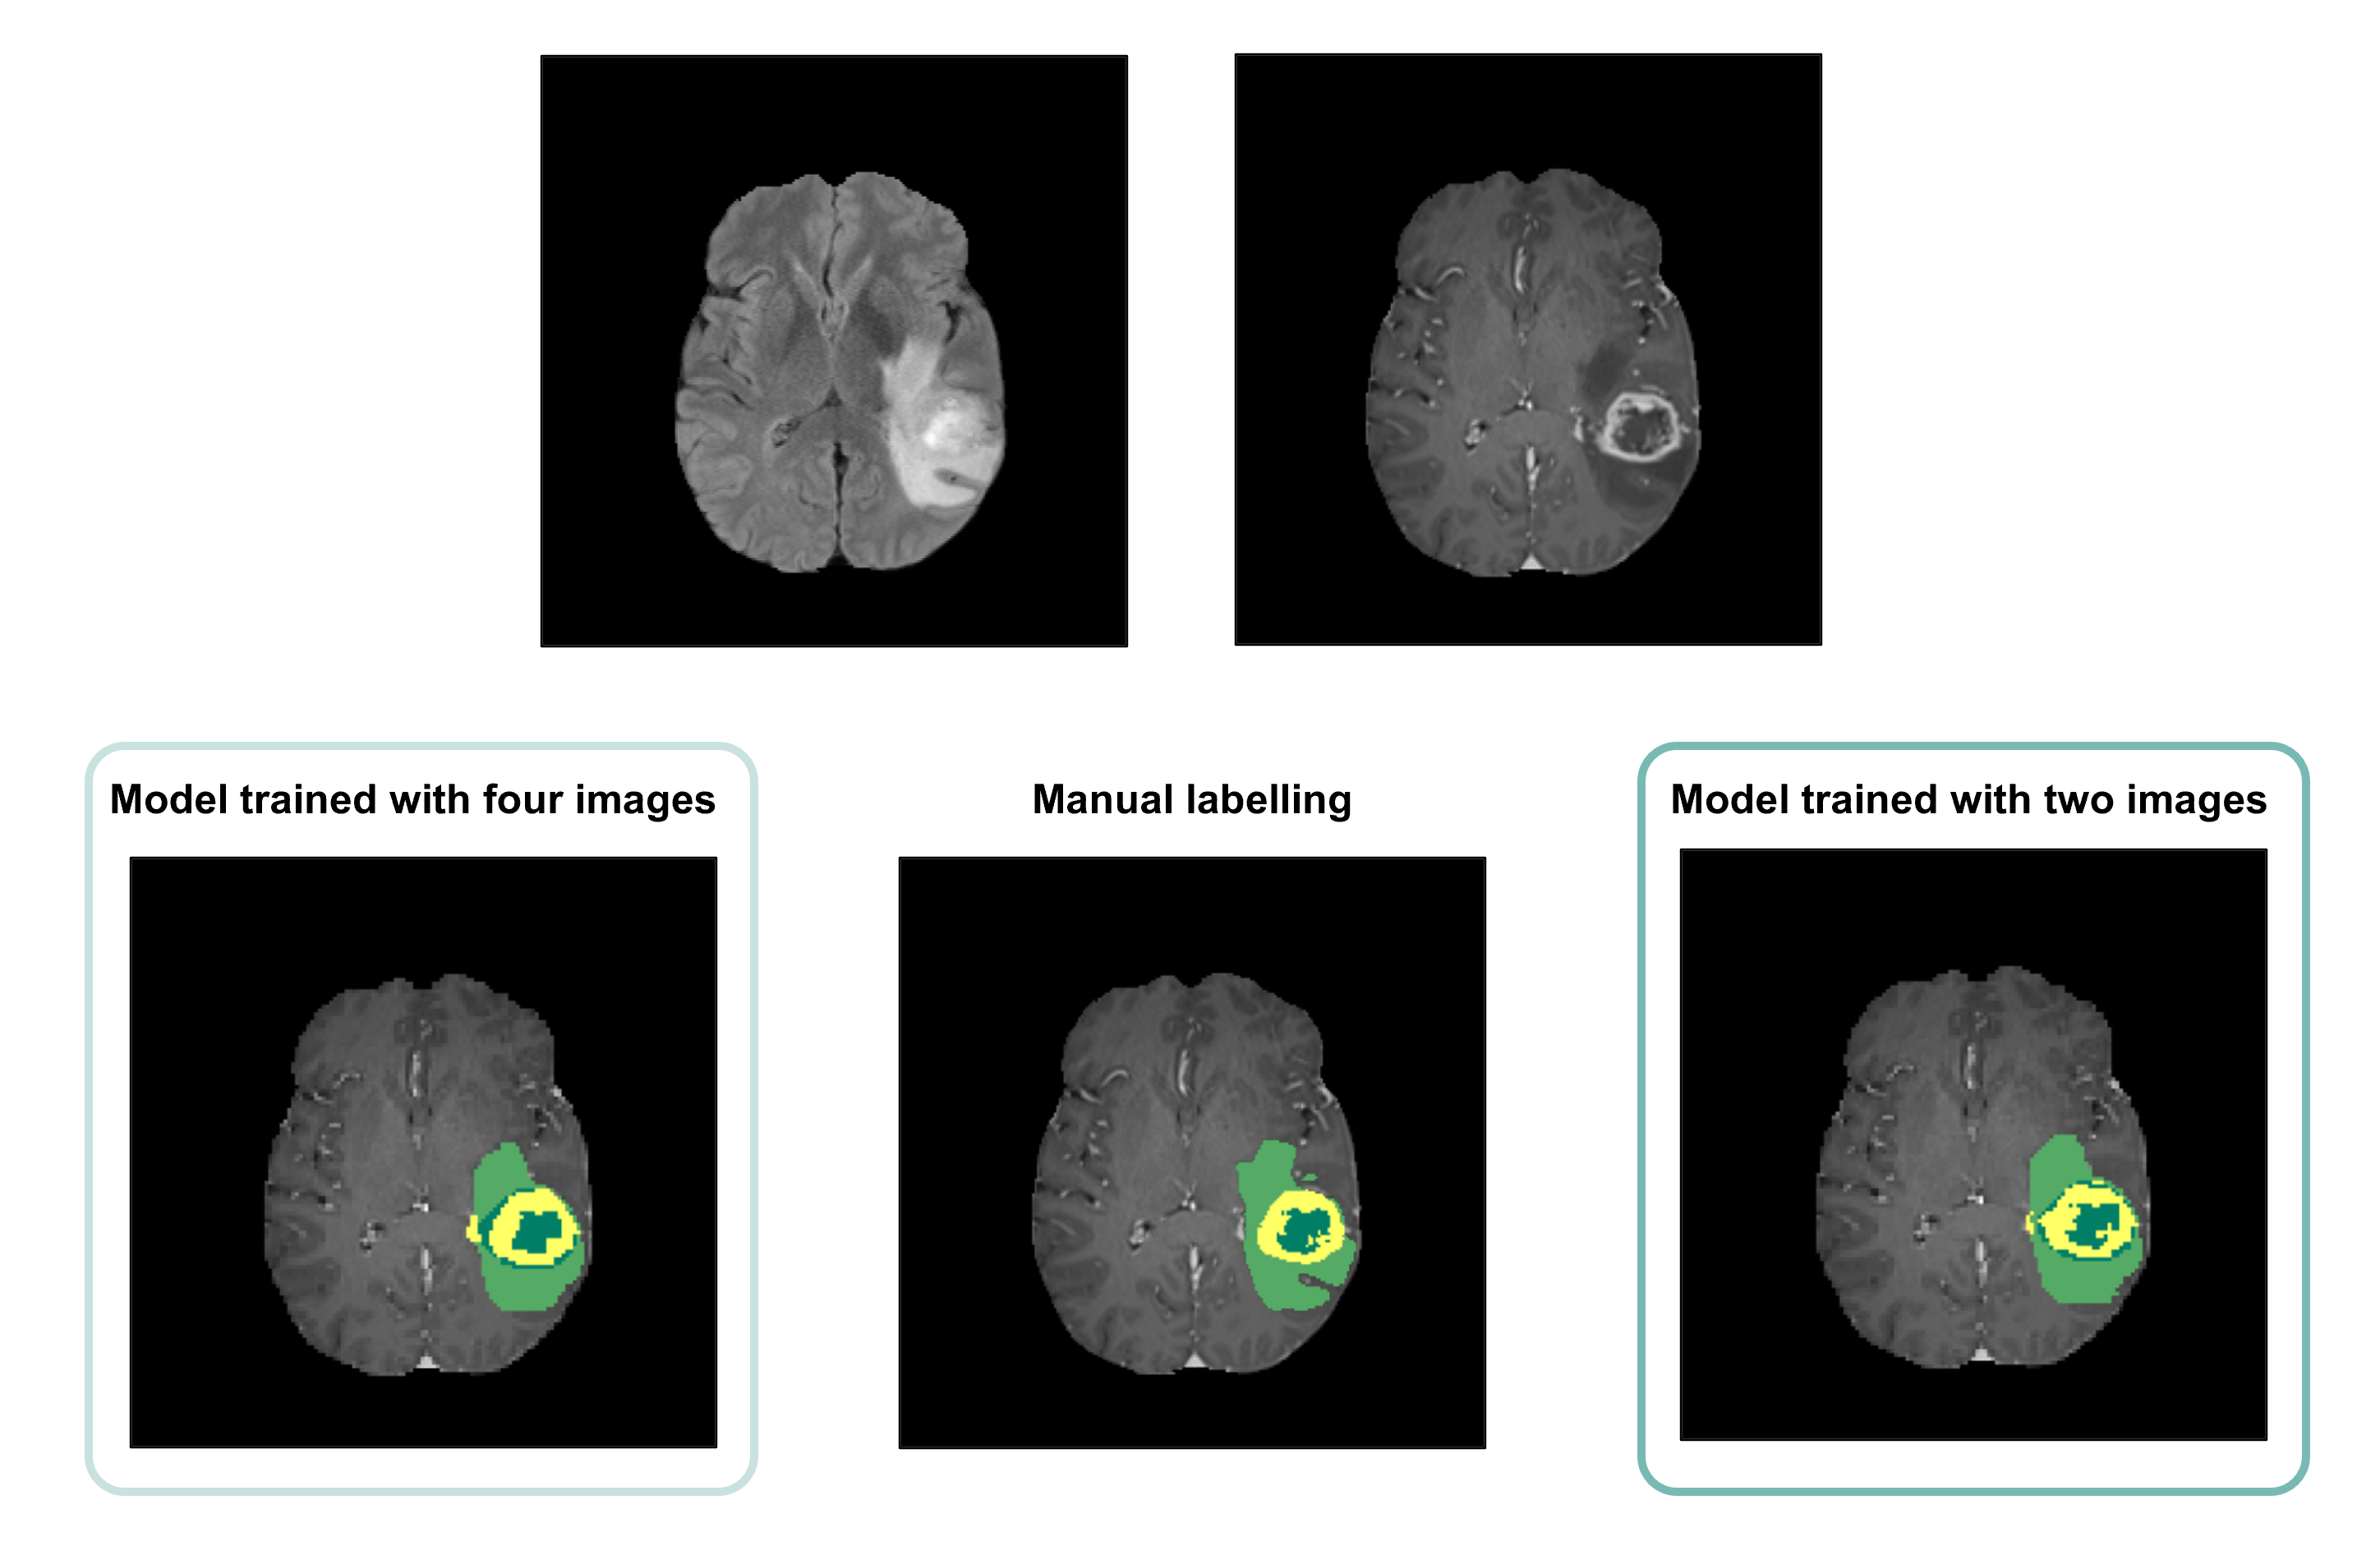
Average Dice scores obtained with the two training approaches are presented in Table 1 and Figure 2. The results corroborate the selected combination of segmentation outputs from the two networks. The segmentation accuracy when training with FLAIR and T1ce images was consistent with the performance when training with four modalities, showing slightly higher values for the WT and TC regions. Wilcoxon signed-rank tests revealed statistically significant differences between the models for these regions (p-values<0.001). In Figure 3, the manual segmentation can be visually compared to the two outputs obtained for a representative subject.Discussion
Our proposed segmentation approach yielded comparable results with the state-of-the-art using the four image modalities. Interestingly, segmentation performance was not compromised by using only two images. In fact, the Dice coefficients were slightly, but significantly, increased. This can potentially be explained by the reduced number of network weights requiring training compared to the four-input model architecture, and by the need to use stochastic gradient descent with smaller feature dimensions due to hardware limitations, which is illustrative of the circumstances in standard clinical facilities. Furthermore, it suggests that for the training conditions available, the two image modalities selected are the most informative for segmentation and that performance was not compromised by using less training inputs. The implication is that shorter acquisition protocols could be used, resulting in shorter network training times, less expenses - due to the reduced scanner time and lower computational requirements, and ultimately, increased patient throughput. Still, similarly to other established automated segmentation methods, manual curation by an expert would be required as the Dice scores obtained reveal some disparity between the manual labelling and the model output. Additionally, we expect that an automated segmentation method relying only on two imaging modalities would be massively beneficial to perform any complementary transfer learning experiments and we will test this in future work.Conclusion
This work investigated the viability of using two image modalities to train an automated segmentation procedure instead of the conventional set of T1, T2, FLAIR and T1ce images. We have shown that relying only on FLAIR and T1ce images for pre-labeling brain tumour structures provides satisfactory results that could be followed by swift manual corrections by an expert and provide clinical benefits.Acknowledgements
Fundação para a Ciência e a Tecnologia (UID/EEA/50009/2019 and UID/EEA/50009/2020).References
1. Marra JS, et al. Survival after radiation therapy for high-grade glioma. Reports of Practical Oncology & Radiotherapy. 2019; 24(1):35–40.
2. Işın A, et al. Review of MRI-based brain tumor image segmentation using Deep Learning Methods. Procedia Computer Science. 2016; 102:317–324.
3. https://www.med.upenn.edu/cbica/brats2021/
4. Hawkins-Daarud A, et al. Modeling tumor-associated edema in gliomas during anti-angiogenic therapy and its impact on imageable tumor. Frontiers in Oncology. 2013; 3.
5. https://monai.io/
6. Myronenko, A. 3D MRI Brain Tumor Segmentation Using Autoencoder Regularization. Brainlesion: Glioma, Multiple Sclerosis, Stroke and Traumatic Brain Injuries. BrainLes 2018. Lecture Notes in Computer Science, vol 11384. Springer, Cham. 2019.
7. Hatamizadeh A, et al. Swin UNETR: Swin Transformers for Semantic Segmentation of Brain Tumors in MRI Images. Brainlesion: Glioma, Multiple Sclerosis, Stroke and Traumatic Brain Injuries. BrainLes 2021. Lecture Notes in Computer Science, vol 12962. Springer, Cham. 2022.
8. Liu Z, et al. Swin transformer: Hierarchical vision transformer using shifted windows. Proceedings of the IEEE/CVF International Conference on Computer Vision. 2021; 10012-10022.
Figures