0812
The ensemble of optimized Deep Learning Neural Networks improves the estimate of the Choroid Plexus Volume: application to Multiple Sclerosis1Department of Information Engineering, University of Padova, Padova, Italy, 2University Hospital of Verona, Verona, Italy, 3Department of Neurosciences, Biomedicine and Movement Sciences, University of Verona, Verona, Italy
Synopsis
Keywords: Segmentation, Machine Learning/Artificial Intelligence, Choroid Plexus
The Choroid Plexus (ChP) is a brain vascular tissue involved in regulatory processes. ChP Volume (ChPV) modifications are related to neurodegenerative disorders, consequently, it was suggested the use of ChPV as biomarker. This work proposes a method for the automatic segmentation of ChP based on Deep-Learning Neural-Networks (DNNs) hyperparameters optimization. Ninety-Six hyperparameters and architectures combinations were trained on T1-w MRI in MONAI, first selection was made on bias and variance and best DNNs were ensembled by major voting. Ensemble model outperforms single DNNs and freely available software (FreeSurfer, Gaussian Mixture Model), highlighting the ensembles DNNs exploitability to automatically estimate ChPV.
Introduction
The Choroid Plexus (ChP) is a vascular tissue part of the glymphatic system1 located inside the brain ventricles. Its main role is the production of the CSF, however, the ChP supports regulation of brain homeostasis and clearance2. Recent research studies have shown the relation between ChP Volume (ChPV) modifications and neurodegenerative disorders like Multiple Sclerosis3,4. Consequently, the increased interest on the use of ChPV as biomarker5 arises the need to robustly delineate it. The gold-standard technique to depict it is the manual segmentation on T1-w MR images. However, this method is time-consuming and affected by inter- and intra-operator variability6,7. The aim of this work is to propose a method for the automatic segmentation of the ChP based on Deep Learning Neural Networks (DNNs), finding the optimal combination of DNNs hyperparameters and architecture to perform reliably the ChP segmentation. Furthermore, we investigated whether the ensemble of the best DNNs improves the ChP segmentation.Methods
The dataset was provided by the Multiple Sclerosis Center of the University Hospital of Verona. It was composed by 128 subjects (age 36.7 ± 10.1 years): 24 healthy controls (HC) and 104 Relapsing-Remitting Multiple Sclerosis (RRMS) patients. 3D T1-w MPRAGE images (FA 8°, resolution 1x1x1 mm) were acquired with two different Philips 3T MRI scanners: 67 subjects (HC, RRMS) on a Philips Acheiva TX with 8-channels head coil (Scanner 1) and 61 subjects (RRMS) on a Philips Elition S with 32-channels head coil (Scanner 2). The Ground Truth (GT) was obtained segmenting ChP in the two lateral ventricles by consensus of two neuroradiologists. We randomly divided the population, maintaining the proportion between scanner/HC/RRMS, into a training set (92 subjects) and a testing set (36 subjects). DNNs were implemented in MONAI8. The workflow of the study is reported in Figure 1. We tested the training of a total of 96 combinations of three DNNs architectures (3D U-Net9; Dynunet, MONAI implementation of nnU-Net10; UNETR11 both using or not a self-supervised learning strategy12) and with hyperparameters: data augmentation (yes/no), patch size (64x64x64, 96x96x96, 128x128x128), loss function (Dice13, CrossEntropy (CE) and weighted CE (wCE)13, combination of Dice+CE (DiceCE)11). We used the Adam-Weighted optimizer14 with fixed learning rate (1e-04), weight decay (1e-05), max iterations (2e04) and batch size (1). Goodness of each combination was assessed on the testing set. The analyzed performance indices were Dice Coefficient, 95% Hausdorff Distance, Percentage Volume Difference and Absolute Percentage Volume Difference (ΔVol%), Pearson’s Volume Correlation Analysis.$$PercentageVolumeDifference=100\times\frac{\left(Volume_{Prediction} - Volume_{GT}\right)}{Volume_{GT}}$$
The DNNs selection criteria were: 1) score on mean ΔVol% and select the best ten DNNs; 2) evaluate mean+sd ΔVol% for each of them and select those that provided a bias in the ChPV estimation less than 21.4% to guarantee the pathological alterations detection based on recent findings4. To further refine the segmentation, we performed the ensemble of the selected best DNNs to produce a more robust output. We modified the standard ensemble method by major voting in MONAI (Auto3dSeg) to include the selected DNNs. Lastly, a comparison between freely available methods (FreeSurfer (FS)15 and Gaussian Mixture Model (GMM)7) and DNNs was performed.
Results
Seven DNNs combinations satisfied the selection criteria. Table 1 shows the results of the comparison between the selected DNNs, the DNNs ensemble, FS and GMM. DNNs models show higher Dice values (0.74–0.79) than FS (0.32) and GMM (0.48) and high correlation coefficients (0.85-0.94; FS and GMM no significant). The ensemble has the higher Dice (0.80±0.07) and the higher correlation value (0.94), moreover, it presents the second lower values in the absolute volume error estimate mean and the third lower variability (ΔVol%: 9.77±7.72%). Figure 2 displays the Dice Coefficient of the compared models, highlighting the higher performance of DNNs than FS and GMM, and the Dice Coefficient variation intra-subjects (excluding FS and GMM): except for few outliers, the DNNs results are uniform. Figure 3 shows the Volume Analysis of both ΔVol% and Percentage Volume Difference for the compared models: DNNs perform better than FS and GMM. Figure 4 presents a representative subject in which FS and GMM predictions are problematic, whereas any DNNs output is more similar to GT.Discussion
Among the seven best configurations selected, it is difficult to find a unique set of parameters that maximizes segmentation accuracy and robustness. However, both single and ensemble DNNs outperform freely available software such as FS and GMM. Regarding the hyperparameters, the selected loss functions are CE and DiceCE, suggesting that the use of CE lowers the bias in ChPV estimates. The most selected patch size is 96x96x96, advising it as a good trade-off between the ChP size and the available image resolution preserving GPU memory occupancy. The ensemble increases the flexibility of the single DNN and, combining them, improves robustness. The ensemble supplies the best trade-off between bias and variance of the ChPV estimates among selected DNNs.Conclusion
Model ensemble of DNNs provides robust segmentation of ChP and reliable estimate of ChPV combining state of the art DNNs such as Dynunet and UNETR. The ensembled model outperforms freely available software such as FS and GMM. This finding suggests that ensembles DNNs could be further used to automatically estimate ChPV in large cohort.Acknowledgements
No acknowledgement found.References
1. Jessen NA, Munk ASF, Lundgaard I, Nedergaard M. The Glymphatic System: A Beginner’s Guide. Neurochem Res. 2015;40(12):2583-2599.
2. Damkier HH, Brown PD, Praetorius J. Cerebrospinal fluid secretion by the choroid plexus. Physiol Rev. 2013;93(4):1847-1892.
3. Ricigliano VAG, Morena E, Colombi A, et al. Choroid Plexus Enlargement in Inflammatory Multiple Sclerosis: 3.0-T MRI and Translocator Protein PET Evaluation. Radiology. 2021;301(1):166-177.
4. Müller J, Sinnecker T, Wendebourg MJ, et al. Choroid Plexus Volume in Multiple Sclerosis vs Neuromyelitis Optica Spectrum Disorder. Neurology - Neuroimmunology Neuroinflammation. 2022;9(3):e1147.
5. Fleischer V, Gonzalez-Escamilla G, Ciolac D, et al. Translational value of choroid plexus imaging for tracking neuroinflammation in mice and humans. Proc Natl Acad Sci U S A. 2021;118(36).
6. Schmidt-Mengin M, Ricigliano VAG, Bodini B, et al. Axial multi-layer perceptron architecture for automatic segmentation of choroid plexus in multiple sclerosis. Published online September 8, 2021.
7. Tadayon E, Moret B, Sprugnoli G, Monti L, Pascual-Leone A, Santarnecchi E. Improving Choroid Plexus Segmentation in the Healthy and Diseased Brain: Relevance for Tau-PET Imaging in Dementia. Journal of Alzheimer’s Disease. 2020;74(4):1057-1068.
8. Consortium MONAI. MONAI: Medical Open Network for AI. https://zenodo.org/record/7245821. Published online October 24, 2022.
9. Ronneberger O, Fischer P, Brox T. U-Net: Convolutional Networks for Biomedical Image Segmentation. Published online May 18, 2015.
10. Isensee F, Jaeger PF, Kohl SAA, Petersen J, Maier-Hein KH. nnU-Net: a self-configuring method for deep learning-based biomedical image segmentation. Nat Methods. 2021;18(2):203-211.
11. Hatamizadeh A, Tang Y, Nath V, et al. UNETR: Transformers for 3D Medical Image Segmentation. Published online March 18, 2021.
12. Chen L, Bentley P, Mori K, Misawa K, Fujiwara M, Rueckert D. Self-supervised learning for medical image analysis using image context restoration. Med Image Anal. 2019;58.
13. Sudre CH, Li W, Vercauteren T, Ourselin S, Cardoso MJ. Generalised Dice overlap as a deep learning loss function for highly unbalanced segmentations. Published online July 11, 2017.
14. Loshchilov I, Hutter F. Decoupled Weight Decay Regularization. In: ICLR. ; 2019.
15. Fischl B. FreeSurfer. Neuroimage. 2012;62(2):774-781.
Figures
Figure 3: Volume Analysis: A- Boxplot of the Absolute Percentage Volume Difference median and variation intra-models, calculated between each compared model (best DNNs, ensemble, FreeSurfer, Gaussian Mixture Model) and the GT T1-w manual segmentation. The green line at 21.4% is the threshold the models have to be compared to. B- Boxplot of the Percentage Volume Difference median and variation intra-models, calculated between each compared model and the GT T1-w manual segmentation.
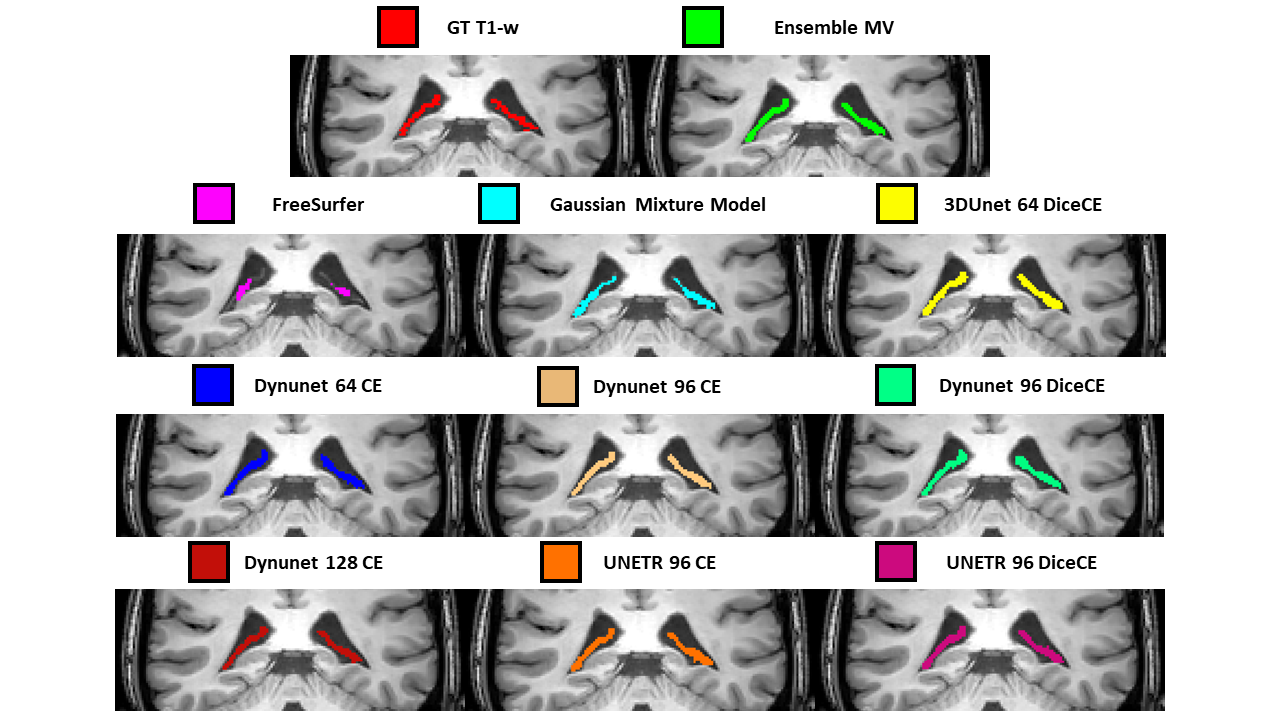
Figure 4: Predicted segmentation results for a representative subject. 3D T1-w MRI (coronal view) with the ChP segmentations. Absolute Percentage Volume Difference (ΔVol%) of the predicted segmentations calculated using GT T1-w manual segmentation as reference: ensemble MV (1.35%), FreeSurfer (50.92%), Gaussian Mixture Model (22.43%), 3D U-Net 64 DiceCE (10.21%), Dynunet 64 CE (3.80%), Dynunet 96 CE (6.04%), Dynunet 96 DiceCE (7.13%), Dynunet 128 CE (10.70%), UNETR 96 CE (2.59%) and UNETR 96 DiceCE (1.61%).