0809
NeuroVerse: Neuroimage Processing Tools Across a Century of Life1Department of Radiology and Biomedical Research Imaging Center (BRIC), The University of North Carolina at Chapel Hill, Chapel Hill, NC, United States
Synopsis
Keywords: Segmentation, Brain, Surface reconstruction; Lifespan analysis
The availability of large-scale multi-site neuroimaging data present unprecedented opportunities for revealing the brain's macroscopic and microscopic organization across the lifespan. Existing neurodevelopmental studies lack consensus, owing to variable preprocessing methods that result in inconsistent brain features. Existing neuroimage processing tools typically cater to specific life periods, limiting their applicability to data covering the entire human lifespan. Here, we present robust automatic tools for accurate and consistent processing of neuroimaging data covering a century of life.Introduction
The human brain undergoes continual reorganization and development over the course of life. Recent advancements in large-scale multi-site data collection and open data sharing afford unprecedented opportunities to study the course of brain development and aging across the entire lifespan. Although there are neurodevelopmental studies examining brain growth over the lifespan1-2, these studies give discordant perspectives on lifespan brain development due to the methodological differences in preprocessing data acquired across different life periods (i.e., infancy, childhood, adolescence, and adulthood). Existing preprocessing tools are developed to cater to data belonging to specific life periods and are hence not generalizable across the lifespan. Here, we present a set of neuroimage processing tools, called NeuroVerse, that are generalizable across all age groups, providing opportunities to harness the large-scale multi-site data to study lifespan brain changes in a consistent manner.Materials and Methods
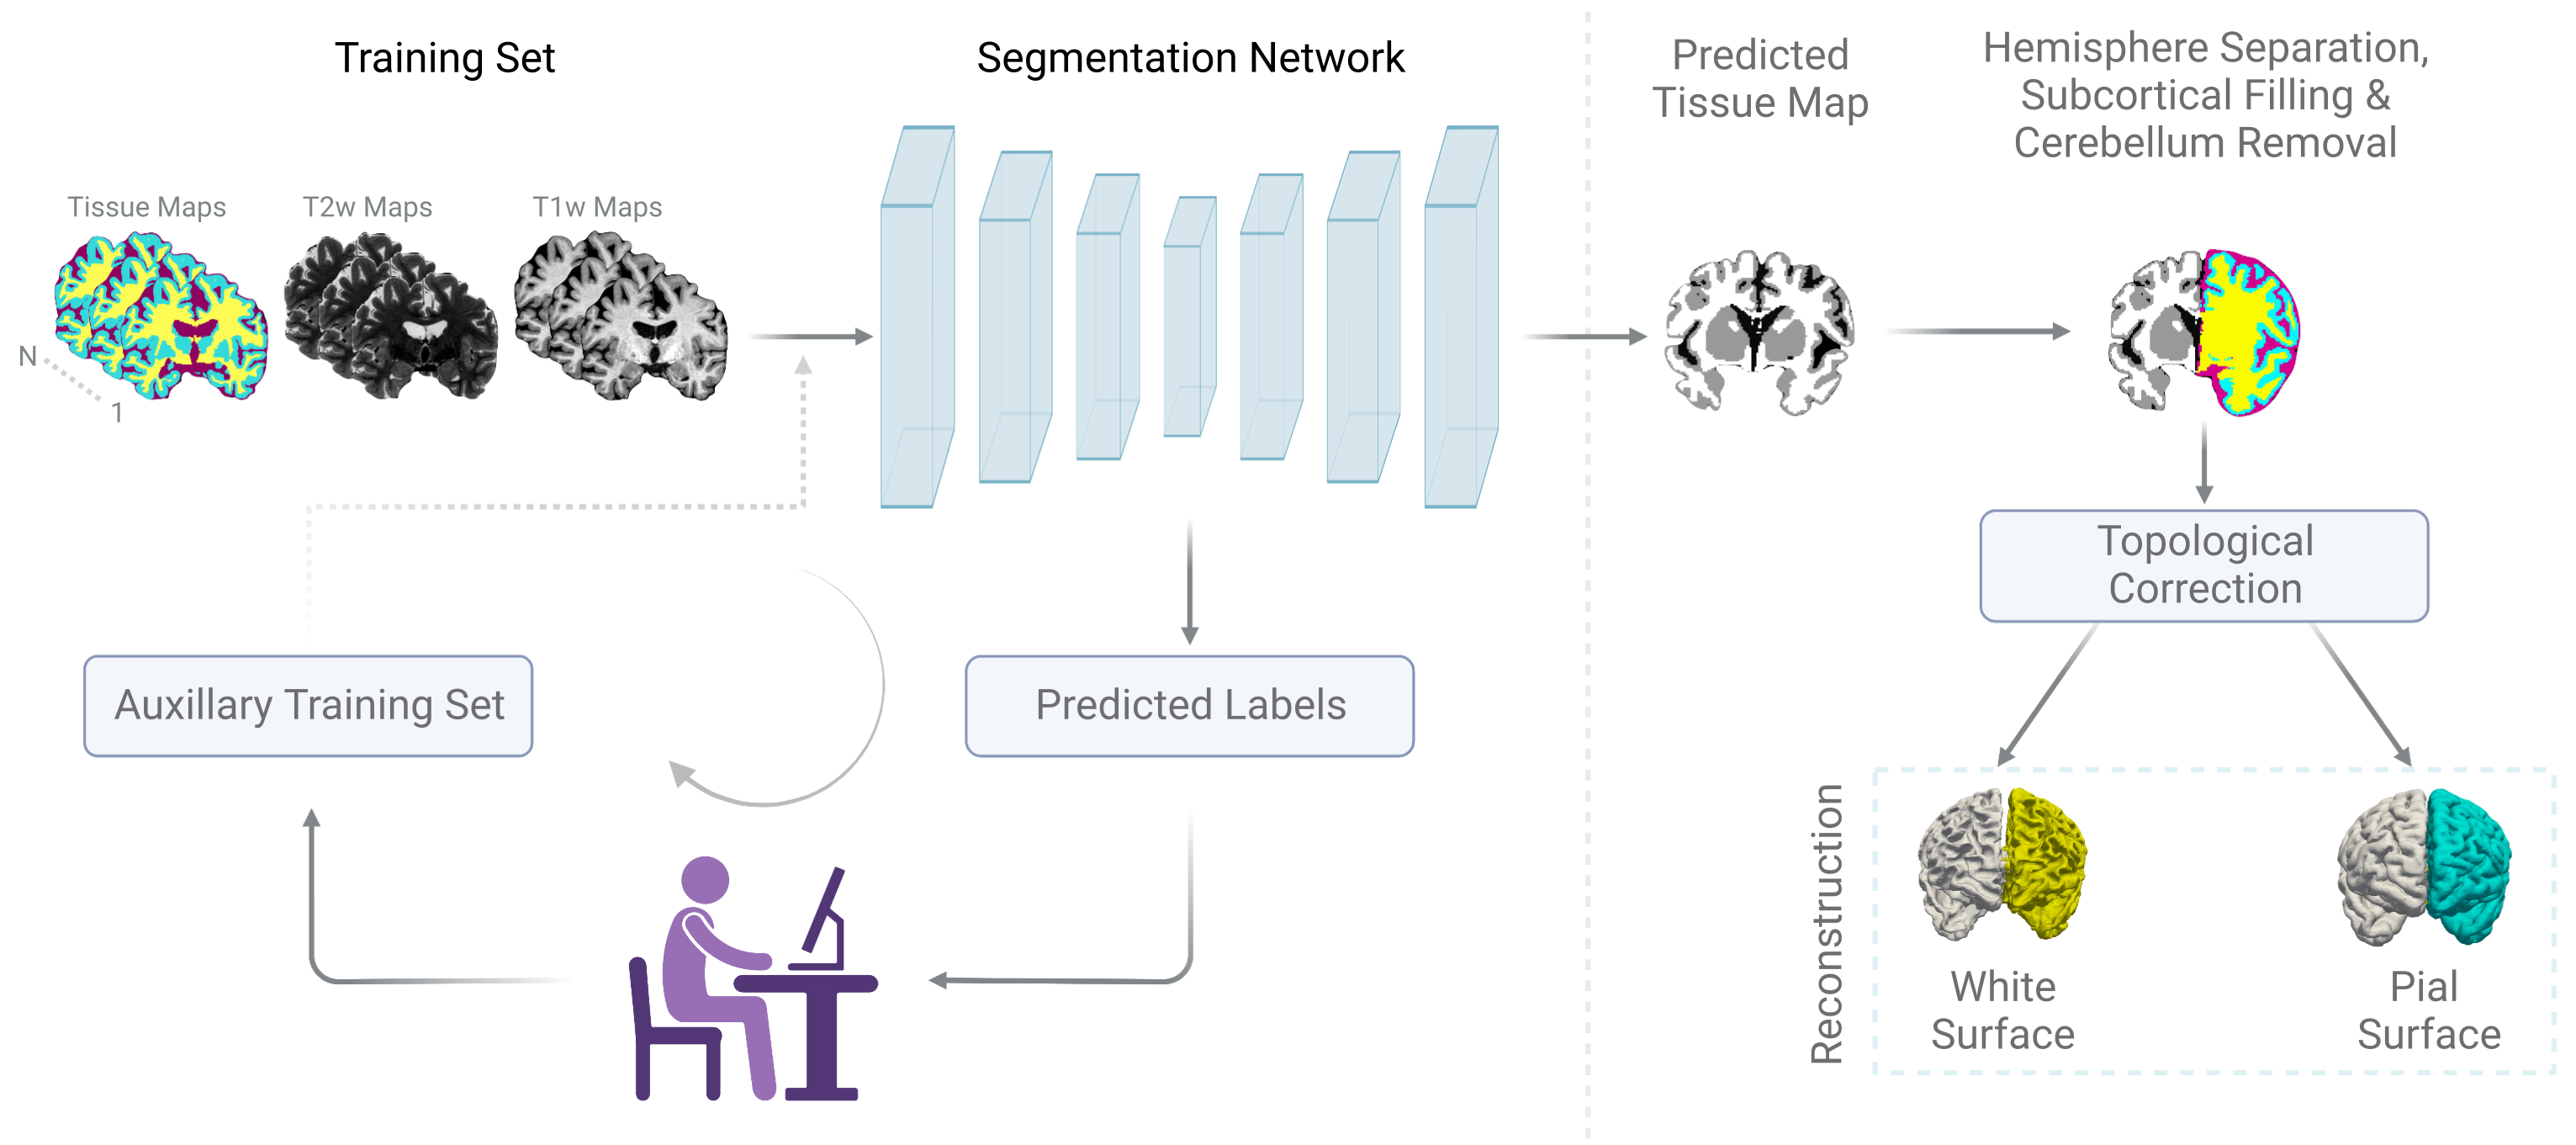
We aggregated structural MRI data (T1-weighted: T1w, T2-weighted: T2w) from five lifespan Human Connectome Projects (HCP): Developing HCP3 (dHCP; gestational ages: 37 - 45 weeks), Baby Connectome Project4 (BCP; ages: 0 - 5.4 years), HCP Development (HCPD; ages: 5.6 - 21.9 years), HCP Young Adult (HCPYA; ages: 22 - 37 years), and HCP Aging (HCPA; ages: 36.2 - 100 years)5-6.For brain MRI segmentation, precisely delineated tissue labels are limited. This problem is exacerbated for neonatal and infant MRI owing to rapidly evolving brain morphology and tissue contrasts. Therefore, we implemented a two stage brain tissue segmentation method that accommodates lifespan MRI data. In the first stage, we randomly selected subjects for each life period and generated tissue labels using population-specific segmentation methods i.e., dHCP pipeline for neonates3 (5 subjects), NiBabies for infants7 (16 subjects), and HCP pipeline for adolescents and adults6 (36 subjects). These automatically generated tissue labels were manually refined and used along with the T1w and T2w images for training a preliminary segmentation model. In the second stage, we applied the trained model to new images, manually corrected the labels, and pooled them with the original training set to retrain the segmentation network. The model trained in the second stage was subsequently applied to all pooled images. We used nnU-Net8 (3D full resolution) as the backbone segmentation model.
For cortical surface reconstruction, the tissue maps were processed to separate the left and right hemispheres, fill subcortical structures, and remove the cerebellum. The hemispheric tissue labels were then corrected for potential topological errors using NighRes9. We employed CRUISE10 to generate level set images for white matter/ gray matter (WM/GM) and gray matter/ cerebrospinal fluid (GM/CSF) interfaces. White and pial surfaces were generated from these level set images using the marching cubes algorithm. Surface irregularities were removed by mesh smoothing.
Results and Discussion
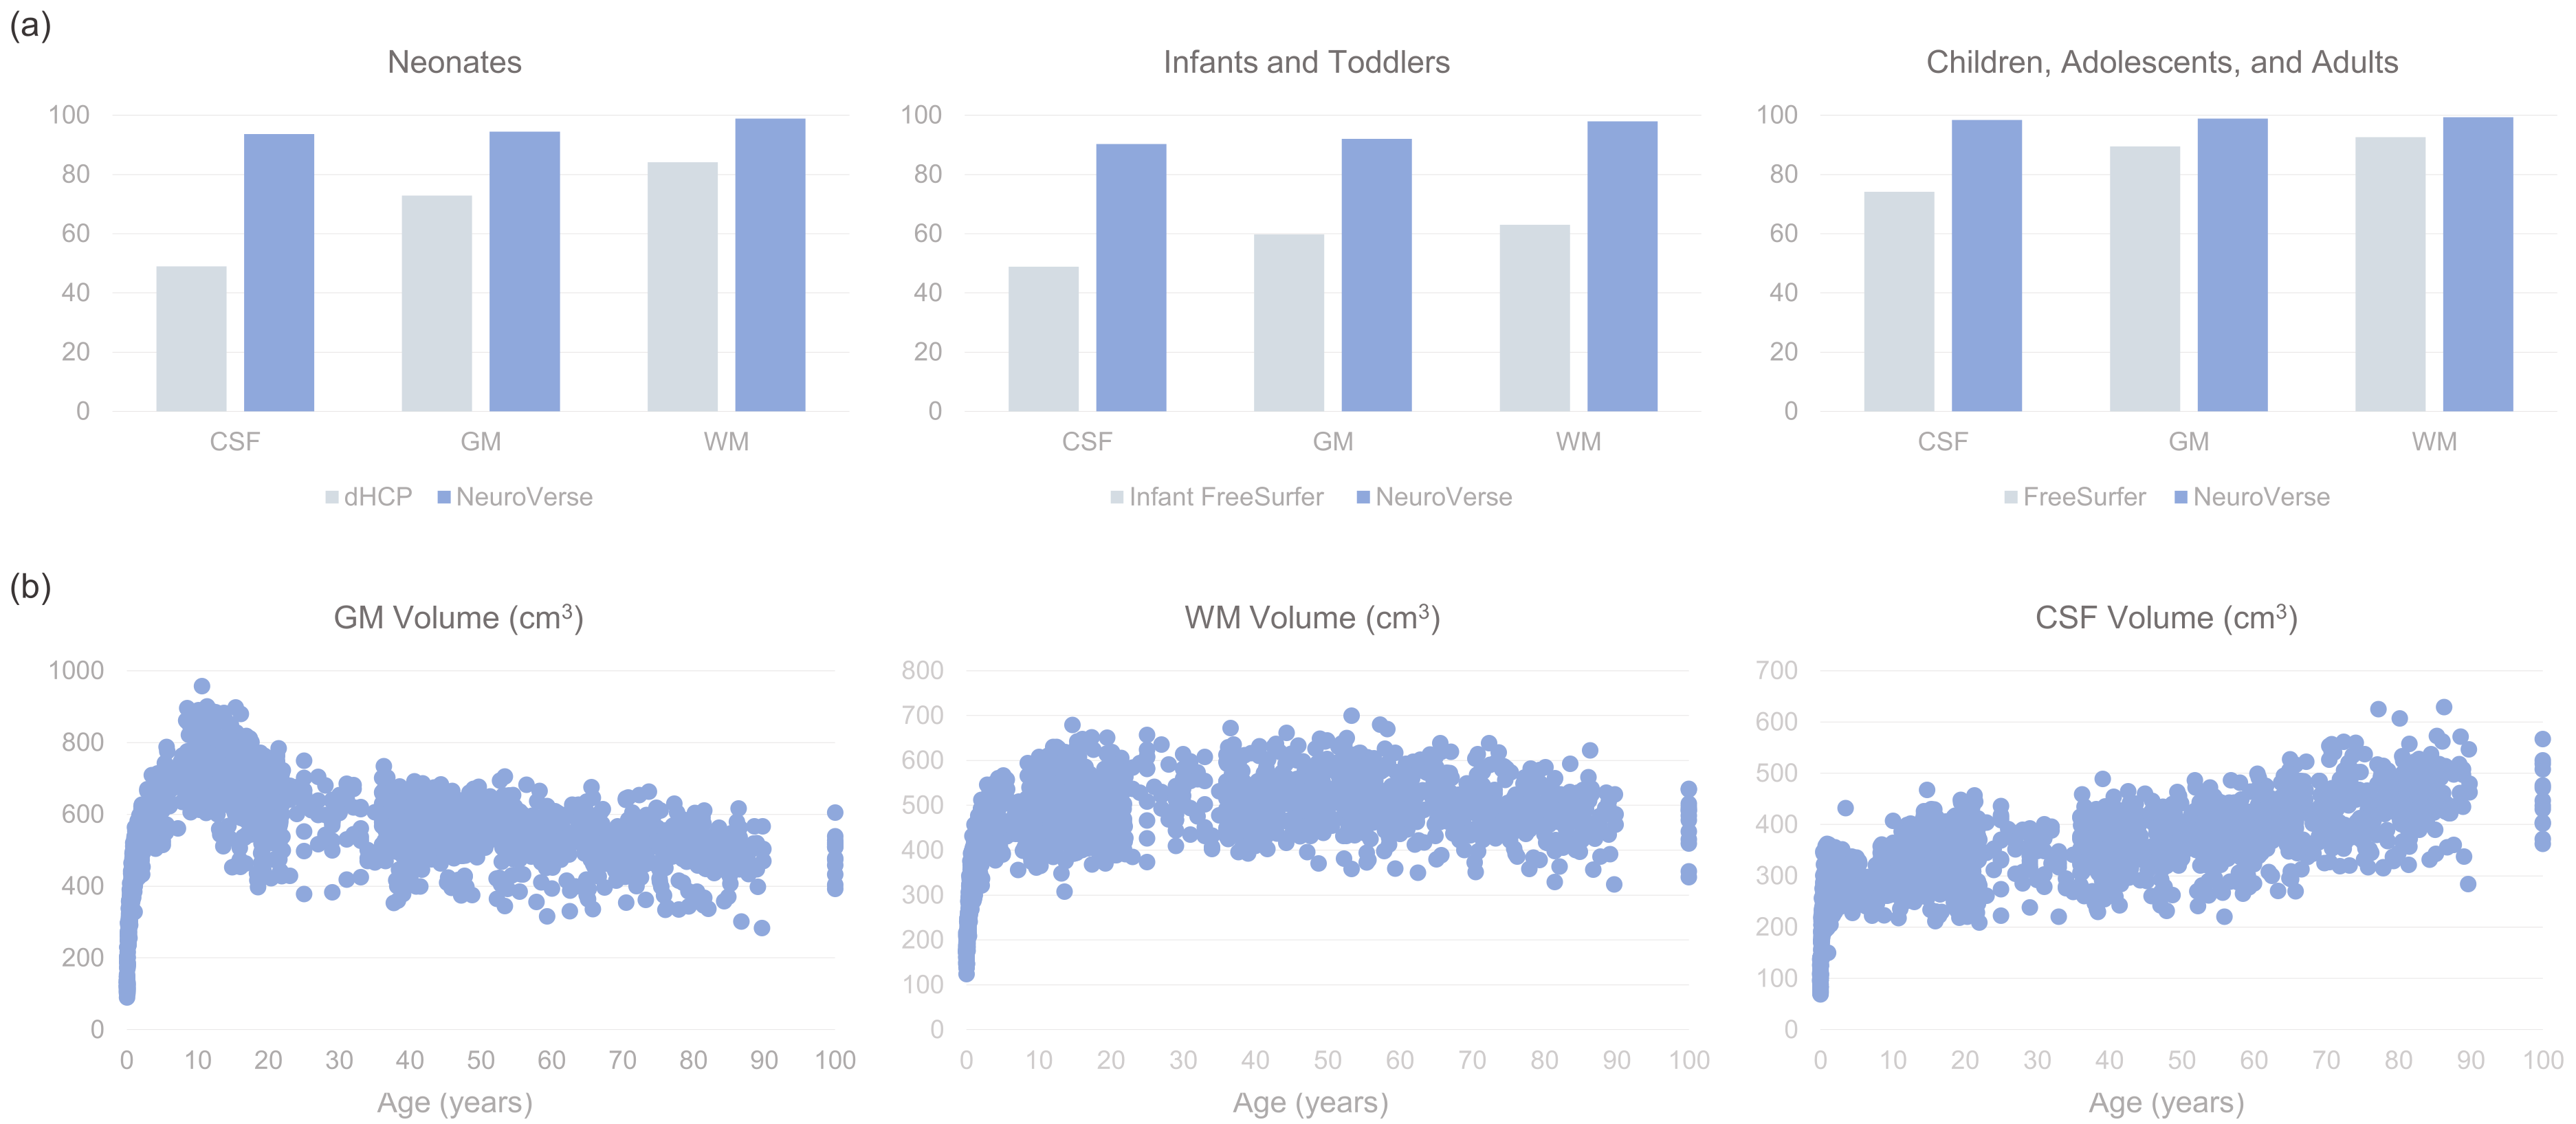
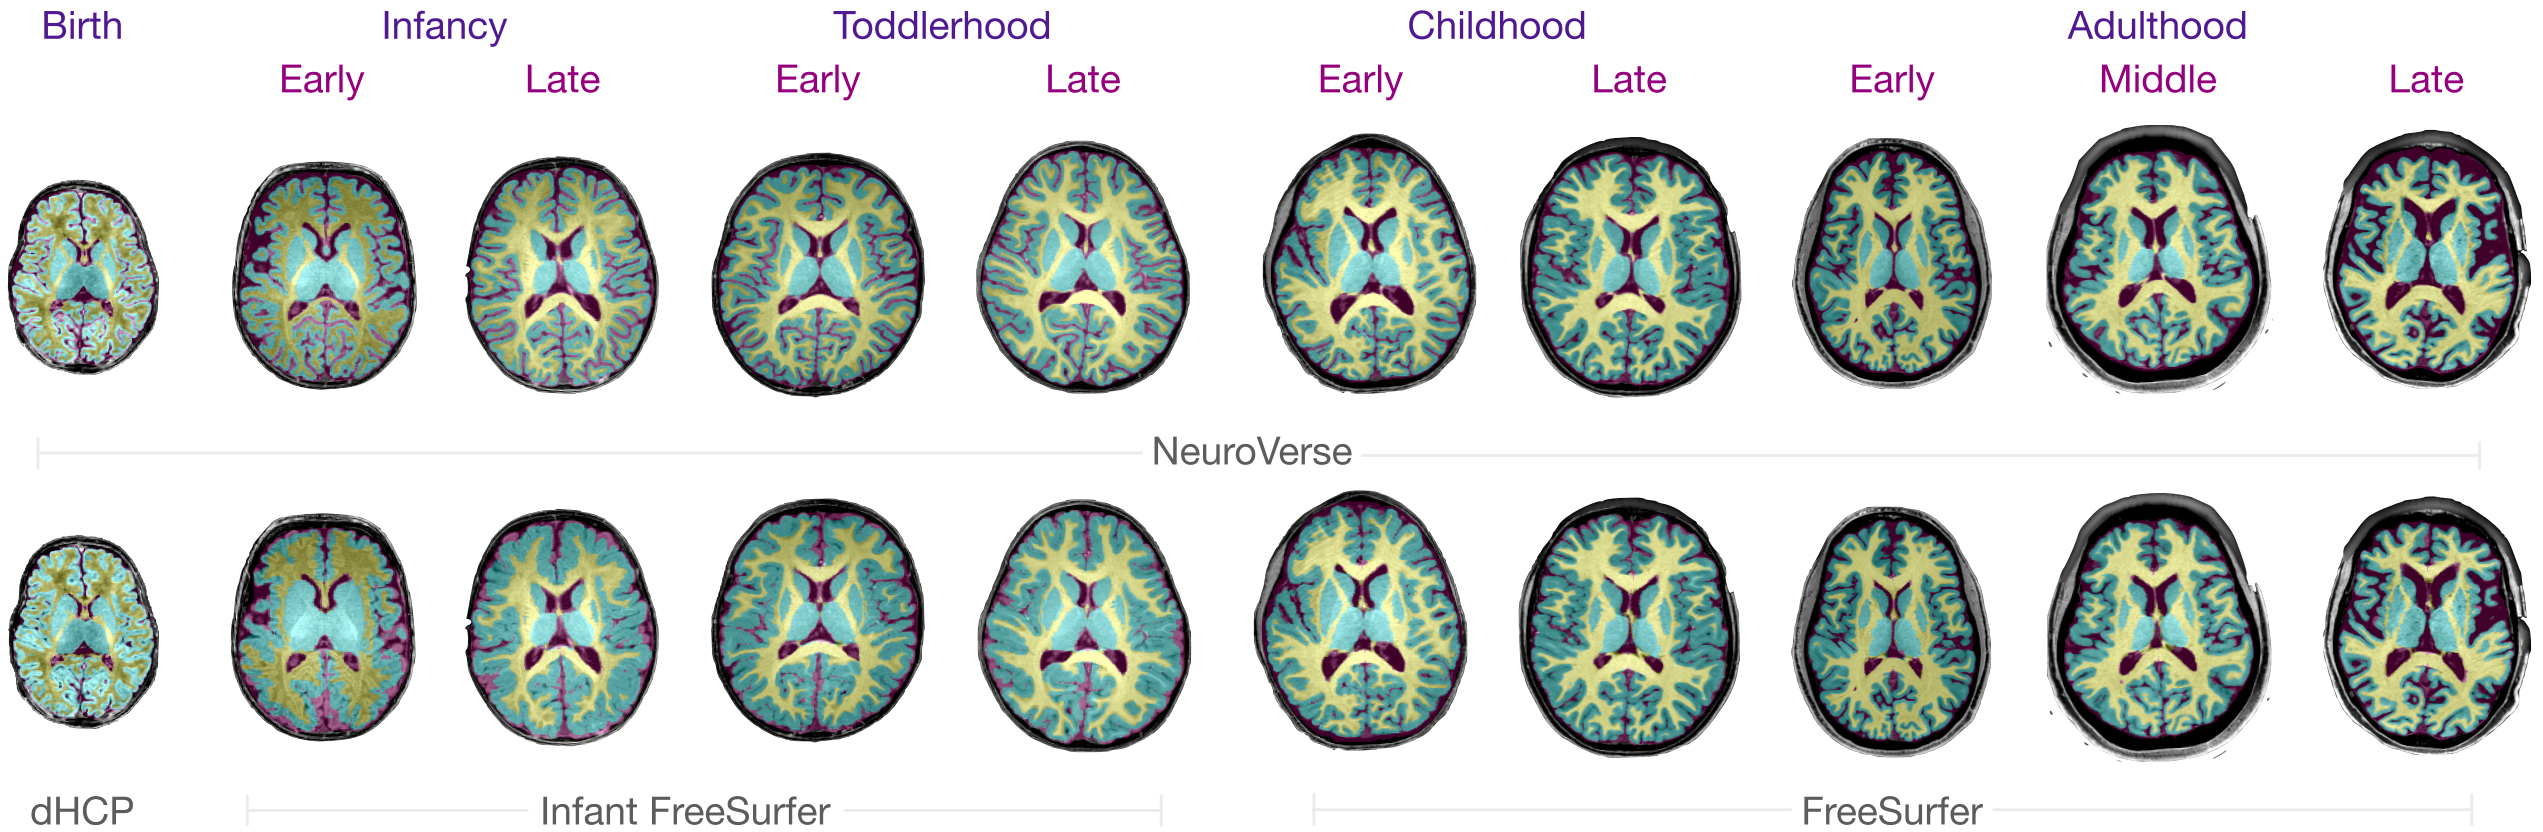
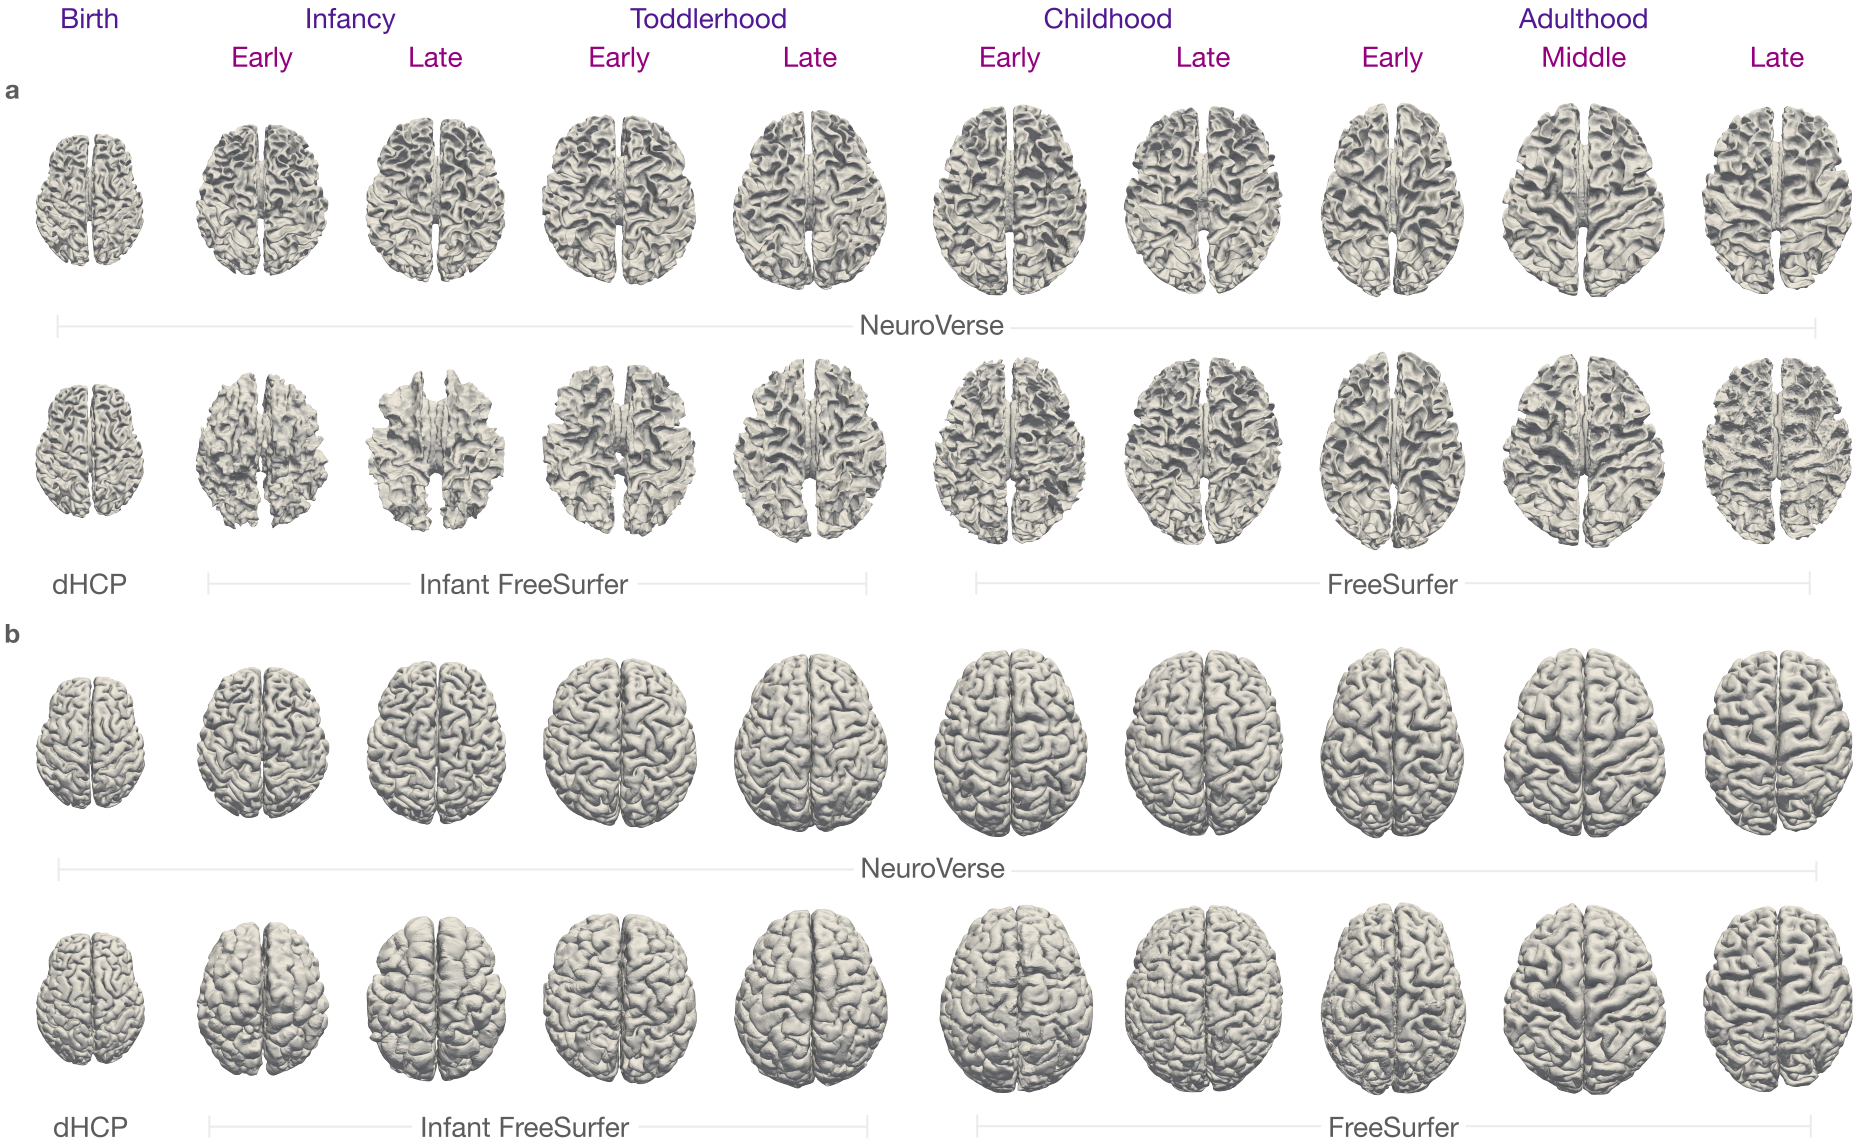
We evaluated the performance of NeuroVerse against standard segmentation methods. We computed the dice ratio between the predicted and ground truth tissue labels. NeuroVerse yields the highest dice ratios compared with the other methods (Figure 2a). Tissue volumes computed from segmentation maps generated by NeuroVerse vary smoothly across the lifespan (Figure 2b), which confirms that our method consistently annotates tissues from birth to 100 years of age. We also qualitatively analyzed the tissue segmentation results by overlaying tissue segmentation maps onto the T1w images (Figure 3). NeuroVerse precisely delineates brain tissues across the lifespan, whereas other methods lack accuracy. These inaccuracies are apparent in segmented tissues from birth through early childhood, where population-specific methods could not correctly label the tissues. We show white and pial surfaces of the cortex constructed with NeuroVerse and other methods in Figure 4. NeuroVerse outperforms other methods by capturing the detailed gyral and sulcal folds across the lifespan. Infant FreeSurfer11 generates malformed cortical surfaces and FreeSurfer12 results in unsmooth meshes.Conclusion
Our suite of brain MRI processing tools (NeuroVerse) can accommodate data from all life periods, generating accurate tissue segmentation maps and cortical surfaces across the human lifespan.Acknowledgements
This work was supported in part by the United States National Institutes of Health (NIH) through grants MH125479 and EB008374.
Data were provided by the developing Human Connectome Project, KCL-Imperial-Oxford Consortium funded by the European Research Council under the European Union Seventh Framework Programme (FP/2007-2013) / ERC Grant Agreement no. [319456]. We are grateful to the families who generously supported this trial.
Data were provided [in part] by the Human Connectome Project, WU-Minn Consortium (Principal Investigators: David Van Essen and Kamil Ugurbil; 1U54MH091657) funded by the 16 NIH Institutes and Centers that support the NIH Blueprint for Neuroscience Research; and by the McDonnell Center for Systems Neuroscience at Washington University.
References
1. Bethlehem R, et al. Brain charts for the human lifespan. Nature. 2022;604:525 - 533.
2. Rutherford S, et al. Charting brain growth and aging at high spatial precision. eLife. 2022;11:e72904.
3. Makropoulos A, et al. The developing human connectome project: A minimal processing pipeline for neonatal cortical surface reconstruction. NeuroImage. 2018;173:88 - 112.
4. Howell BR, et al. The UNC/UMN Baby Connectome Project (BCP): An overview of the study design and protocol development. NeuroImage. 2019;185:891 - 905.
5. Essen DCV, et al. The Human Connectome Project: a data acquisition perspective. NeuroImage. 2013;62(4):2222 - 2231.
6. Glasser MF, et al. The minimal preprocessing pipelines for the Human Connectome Project. NeuroImage 2013;80:105 - 124.
7. Esteban O, et al. fMRIPrep: a robust preprocessing pipeline for functional MRI. Nature Methods. 2019;16:111 - 116.
8. Isensee F, et al. nnU-Net: a self-configuring method for deep learning-based biomedical image segmentation. Nature Metods. 2021;18:203 - 211.
9. Bazin PL, et al. Topology correction of segmented medical images using a fast marching algorithm. Computer Methods and Programs in Biomedicine. 2007;88(2):182 - 190.
10. Han X, et al. CRUISE: Cortical reconstruction using implicit surface evolution. NeuroImage. 2004;23(3):997 - 1012.
11. Zollei L, et al. Infant FreeSurfer: An automated segmentation and surface extraction pipeline for T1-weighted neuroimaging data of infants 0–2 years. NeuroImage. 2020;218:116946.
12. Fischl B. Freesurfer. NeuroImage. 2012;62(2):774 - 781.
Figures