0803
Patient-specific computational model of interstitial fluid flow in pancreatic cancer based on DCE- and DW-MRI1Department of Human Structure and Repair, Ghent University, Ghent, Belgium, 2IBiTech – Biommeda, Ghent University, Ghent, Belgium, 3Cancer Research Institute Ghent (CRIG), Ghent, Belgium, 4Department of Radiology, Ghent University Hospital (UZGent), Ghent, Belgium, 5Ghent Institute of Functional and Metabolic Imaging (GIFMI), Ghent, Belgium, 6IBiTech – Medisip, Ghent University, Ghent, Belgium
Synopsis
Keywords: In Silico, Simulations, Biomechanics
The abnormal interstitial fluid flow (IFF) in solid tumors characterized by the elevated interstitial fluid pressure (IFP) is one of the major barriers for treating solid tumors. Here, we implemented DCE-MRI and IVIM DW-MRI in a clinical study to upgrade the existing basic mathematical framework of IFF to a patient-specific model. The results were compared with the basic model, which showed a noticeable difference regarding the prediction of the heterogeneity of IFF.
Introduction
Theoretical and experimental research previously showed that the interstitial fluid pressure (IFP) in solid tumors is typically elevated compared to normal tissue, resulting in a poor prognosis and treatment resistance [1]. Despite this knowledge, tumor pressure is not currently used as a biomarker in cancer therapy due to the absence of practical measurement methods [1]. In the past three decades, several attempts have been made to map the IFP non-invasively, particularly with contributions of computational simulations as well as medical imaging (i.e. MRI) [2-5]. In this study, we present a 3D computational fluid dynamics (CFD) modeling approach coupled with dynamic contrast-enhanced MRI (DCE-MRI) as well as Intravoxel Incoherent Motion MRI (IVIM-MRI) to develop a patient-specific approach to simulate IFF.Methods
Data acquisitionAs part of a translational clinical study (EC/2019/1330, approved by the local ethical committee) images were acquired on a patient with a pancreatic tumor using a 3T clinical MR system (PrismaFit, Siemens Healthineers, Germany). The pancreatic MR imaging protocol includes coronal respiratory triggering fat-suppressed HASTE T2-weighted imaging, 3D-T2 weighted coronal SPACE imaging with and without fat-suppression, Intravoxel Incoherent Motion (IVIM) DW-MRI, and transversal 3D gradient echo (3D-GRE) volumetric interpolated breath-hold examination (VIBE) T1-weighted imaging. Axial breath-hold 3D GRE VIBE T1-weighted imaging was performed without administration of contrast agent for anatomical location of the tumor. A T1 map was obtained using the variable flip angle method. Finally, a transversal free-breathing prototype 3D GRASP-VIBE [6] dynamic contrast-enhanced scan sequence was continuously obtained with an offline-reconstructed temporal resolution of 2.1 s, after intravenous injection of 0.1 mmol/kg of Prohance contrast agent with 20 ml saline flush at the rate of 2.0 ml/s.
Data analysis
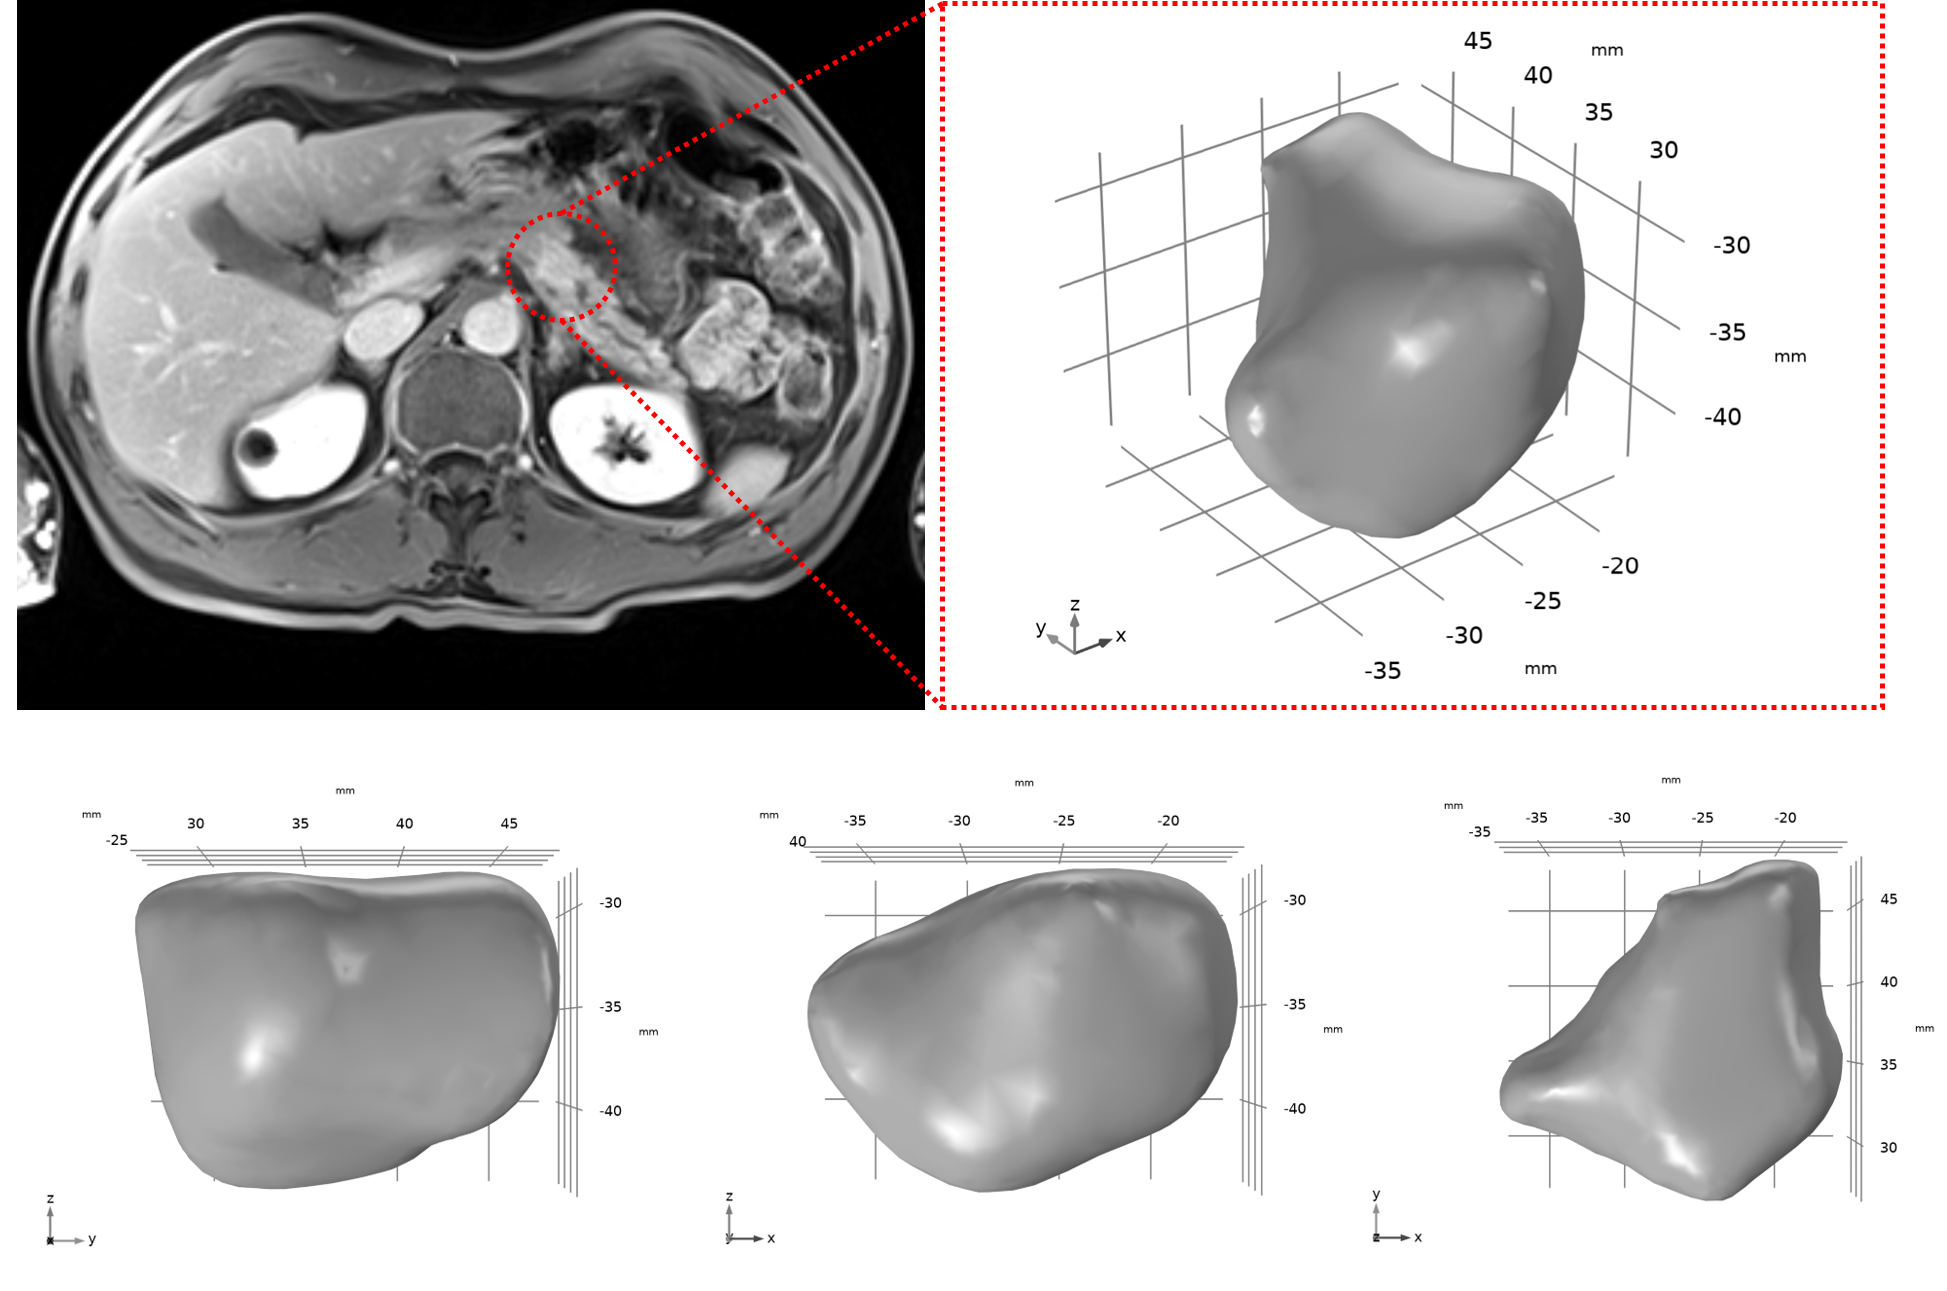
Image analysis was done using an open source software, 3D Slicer [7]. Image motion correction and co-registration were performed using groupwise registration [8]. The DCE-MRI data was quantified via the extended-Tofts model to derive the volume transfer constant (Ktrans) map [9]. Also, the arterial input function (AIF) was measured from the abdominal aorta. The IVIM DW-MRI data was analyzed by standard methods to estimate the apparent diffusion coefficient (ADC). The contours of the tumor were delineated by an experienced abdominal radiologist. The 3D geometry of the tumor was reconstructed according to these contours.
Computational fluid dynamics (CFD) modeling of IFP
The interstitial fluid flow throughout the tumor was simulated in COMSOL Multiphysics (Inc., Burlington, USA) using the reconstructed 3D geometry. The interstitial flow in the tumor domain was described by Darcy’s law (Eq. 1) and the continuity equation, in which the interstitial fluid source was expressed by Starling’s law (Eq. 2) accounting for a high tumor vascular permeability [1]. In this framework, Ktrans and ADC maps were incorporated to account for heterogeneities in microvascular permeability (LP) and hydraulic conductivity of tumor tissue (K), respectively. No lymphatic vessels were assumed to be present in the tumor and the IFP at the tumor boundary was set to 0 mmHg.
$$$u_i=-K\triangledown P, K=\frac{ADC}{\overline{ADC}}K_0$$$ (Eq. 1)
$$$\triangledown.u_i=L_p\frac{S}{V}(p_v-p_i-\sigma(\pi_v-\pi_i)), L_p=\frac{K^{trans}}{\overline{K^{trans}}}{L_{p}}_{0}$$$ (Eq. 2)
With pi the IFP, ui the interstitial fluid velocity (IFV), S/V the surface area per unit volume, pv the vascular pressure, σ the osmotic reflection coefficient, πv the vascular osmotic pressure and πi the interstitial osmotic pressure. K0 and Lp0 are the baseline values for hydraulic conductivity and vascular permeability, respectively.
Results
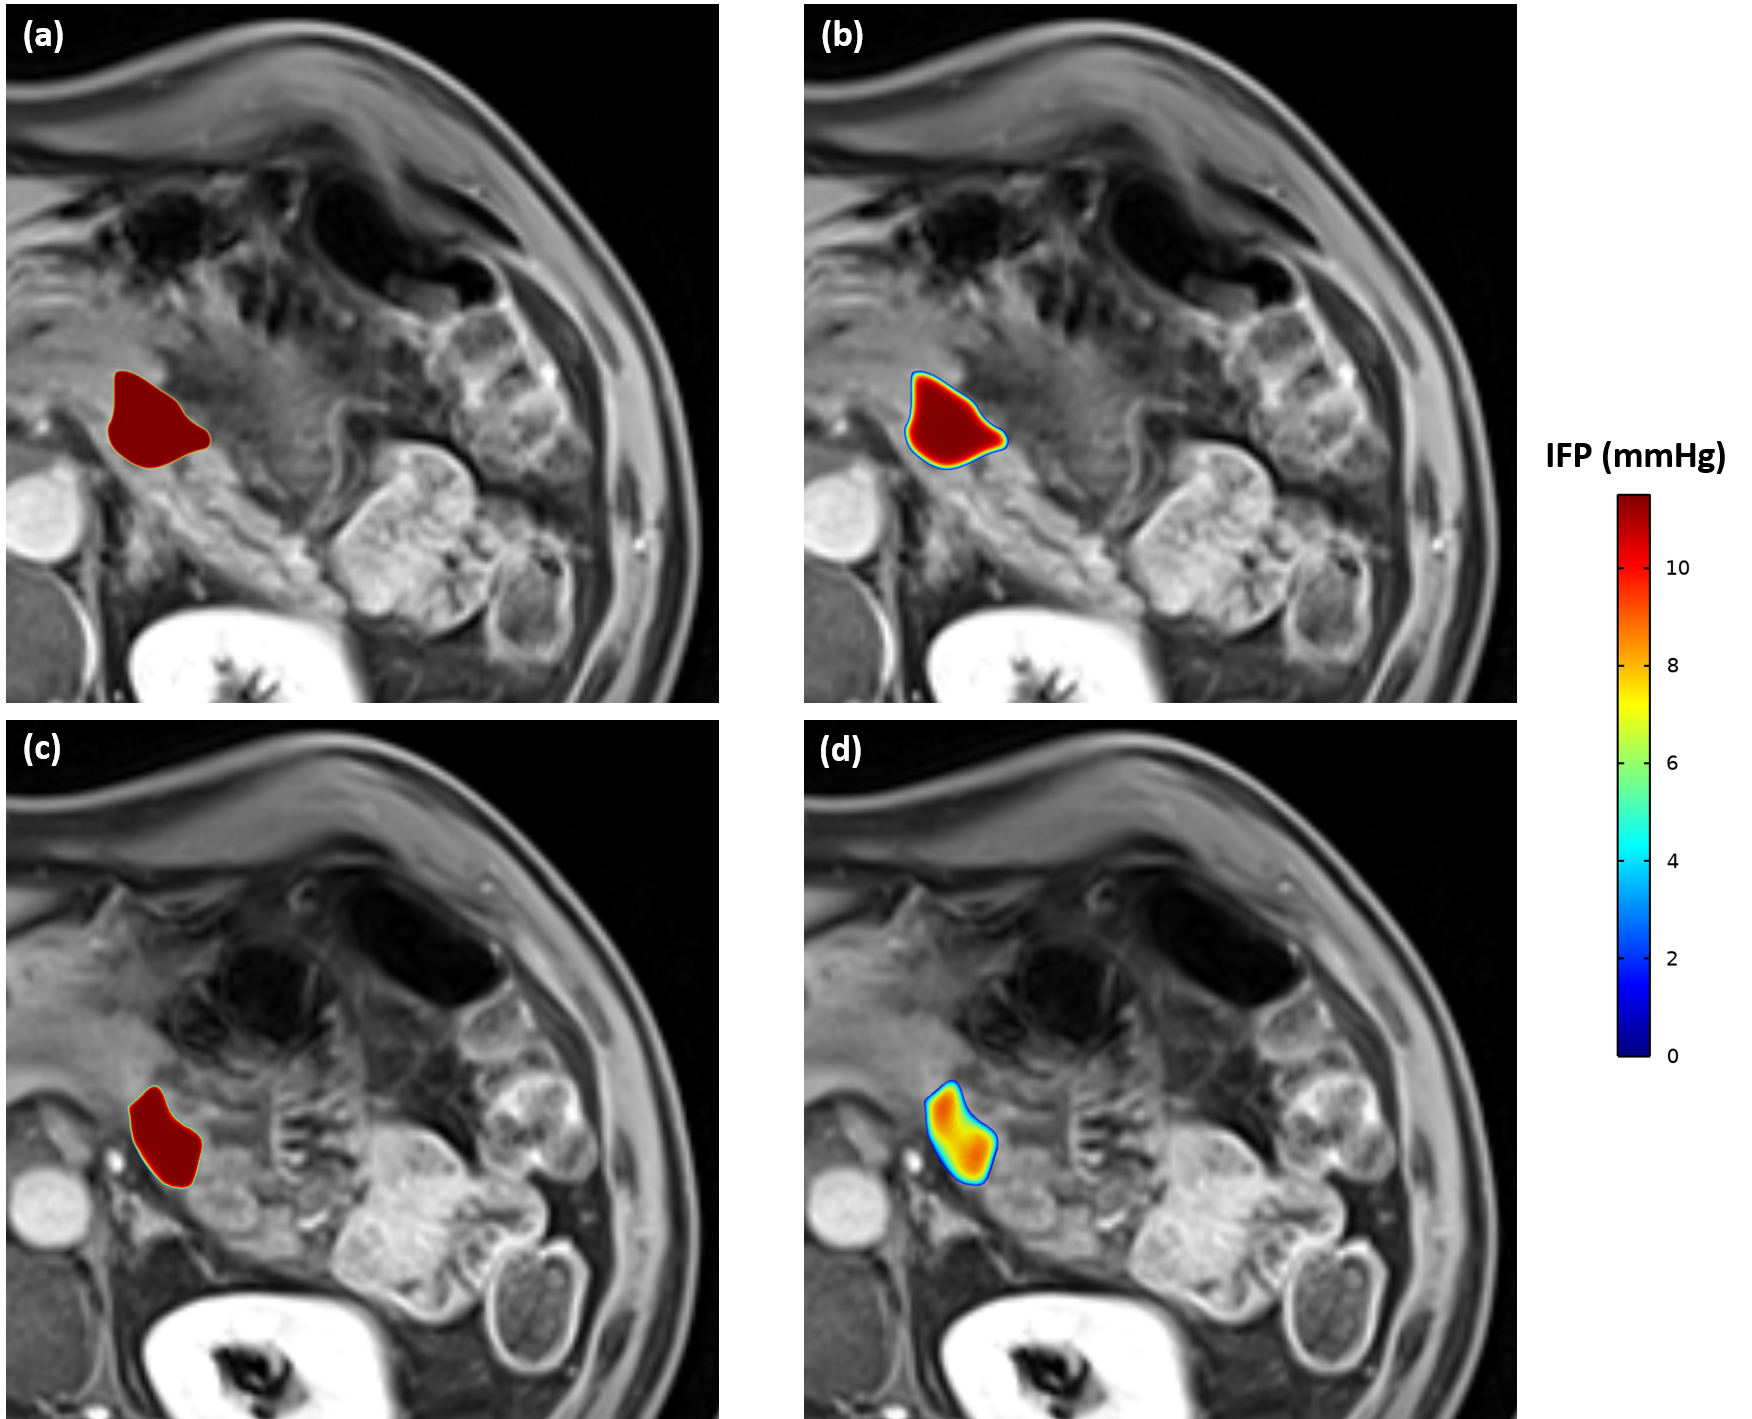
The results for IFP profiles inside the tumor (Fig 1; volume 3250 mm3) are illustrated in Fig 2. Comparing the results of the basic model (Fig 2a & c) with the personalized model (Fig 2b & d), the distribution of IFP in the basic model is almost homogenous throughout the tumor except close to the surface of the tumor, where the IFP rapidly decreases to normal tissue IFP (i.e. 0 mmHg). In contrast, the IFP is much more heterogenous when implementing the quantitative imaging data (Ktrans and ADC maps), especially at the outer layers of the tumor (Fig 2 c & d). Also, Despite the different IFP profiles, the highest IFP was the same in both models (11.5 mmHg), and located at the central region of the tumor.Discussion and conclusion
A quantitative image-based CFD model of tumor interstitial flow demonstrated the heterogeneity of IFP inside a pancreatic tumor. Implementing other patient-specific data using other imaging sequences (e.g. MR elastography) as well as ex-vivo and in-vitro tests can provide additional vital inputs for fully personalized computational models of solid tumors, promising a new diagnostic tool in clinical oncology.Acknowledgements
No acknowledgement found.References
1. Salavati, H., et al., Interstitial fluid pressure as an emerging biomarker in solid tumors. Biochimica et Biophysica Acta (BBA)-Reviews on Cancer, 2022: p. 188792.
2. LoCastro, E., et al., Computational modeling of interstitial fluid pressure and velocity in head and neck cancer based on dynamic contrast-enhanced magnetic resonance imaging: feasibility analysis. Tomography, 2020. 6(2): p. 129.
3. Sefidgar, M., et al., Numerical modeling of drug delivery in a dynamic solid tumor microvasculature. Microvascular research, 2015. 99: p. 43-56.
4. Pishko, G.L., et al., Sensitivity analysis of an image-based solid tumor computational model with heterogeneous vasculature and porosity. Annals of biomedical engineering, 2011. 39(9): p. 2360.
5. Baxter, L.T. and R.K. Jain, Transport of fluid and macromolecules in tumors. I. Role of interstitial pressure and convection. Microvascular research, 1989. 37(1): p. 77-104.
6. Feng, L., et al., Golden‐angle radial sparse parallel MRI: combination of compressed sensing, parallel imaging, and golden‐angle radial sampling for fast and flexible dynamic volumetric MRI. Magnetic resonance in medicine, 2014. 72(3): p. 707-717.
7. Fedorov, A., et al., 3D Slicer as an image computing platform for the Quantitative Imaging Network. Magnetic resonance imaging, 2012. 30(9): p. 1323-1341.
8. Huizinga, W., et al., PCA-based groupwise image registration for quantitative MRI. Medical image analysis, 2016. 29: p. 65-78.
9. Tofts, P.S., et al., Estimating kinetic parameters from dynamic contrast‐enhanced T1‐weighted MRI of a diffusable tracer: standardized quantities and symbols. Journal of Magnetic Resonance Imaging: An Official Journal of the International Society for Magnetic Resonance in Medicine, 1999. 10(3): p. 223-232.
Figures