0801
Differentiating Benign from Malignant Gallbladder Wall Thickening in Non-Contrast MRI Imaging: Preliminary Study of a Combined Indicator
Wen-Wen He1, Hai-Ge Li1, Jian-Guo Zhu1, Dmytro Pylypenko2, Fei Liu1, Mei Wang1, Yue-Fei Wu3, and Jun Tian3
1Radiology, The Second Affiliated Hospital of Nanjing Medical University, Nanjing, China, 2GE Healthcare, China, Beijing, Beijing, China, 3The Second Affiliated Hospital of Nanjing Medical University, Nanjing, China
1Radiology, The Second Affiliated Hospital of Nanjing Medical University, Nanjing, China, 2GE Healthcare, China, Beijing, Beijing, China, 3The Second Affiliated Hospital of Nanjing Medical University, Nanjing, China
Synopsis
Keywords: Cancer, Biliary
This study evaluated the diagnostic accuracy of image features for differentiating benign from malignant gallbladder wall thickening disease with non-contrast MRI and constructed the optimal diagnostic indicator. 23 patients with wall thickening type gallbladder carcinoma and 61 patients with benign wall thickening disease were included. Six image indicators (the layered pattern on T2WI and DWI images, T2WI signal intensity, papillary growth, ADC value, and ratio of the ADC value of the lesion to that of liver parenchyma) were shown to have high diagnostic accuracy. The layered pattern on DWI combined with papillary growth was demonstrated as the optimal indicator.Background
Gallbladder (GB) wall thickening is a common radiological manifestation in benign and malignant diseases and frequently leads to diagnostic dilemmas. It is worthwhile to explore the diagnostic value of non-contrast MRI examination, which provides shorter scan time, lower costs, less patient inconvenience, and fewer health concerns for patients worried about the use of gadolinium. Several useful diagnostic indicators have been confirmed to have high diagnostic accuracy for wall thickening type gallbladder carcinoma (GBC). [1-3] However, few previous studies have attempted to perform a comprehensive comparison of the diagnostic accuracy of these indicators and no research to our knowledge has been focused on constructing a combined diagnosis indicator that may improve diagnostic accuracy for wall thickening type GBC with non-contrast MRI. Therefore, we hypothesize that there are differences in these image features of wall thickening type GBC in terms of diagnostic accuracy, and an optimal diagnostic indicator can be constructed.Methods
A total of 84 patients with gallbladder wall thickening were enrolled, including 21 cases of acute cholecystitis, 35 cases of chronic cholecystitis, 5 cases of xanthogranulomatous cholecystitis, 23 cases of GBC, and 13 cases of adenomyomatosis accompanied with acute and chronic cholecystitis. MR scans were performed on 3.0-T (HDxt, GE Medical System, Milwaukee) with 8-channel body coil. Patients were asked to fast for a minimum of 4 h. The MR scan sequences included axial T2WI with fat suppression, liver acquisition with acceleration volume acquisition, coronal fast imaging employing steady-state acquisition, and three-dimensional MR cholangiopancreatography, Diffusion weighted imaging (DWI). DWI was performed with 2 diffusion weightings (b=0s/mm2, 800s/mm2). Detailed scan parameters are shown in Table 1. Two abdominal radiologists with 10 years of experience who disregarded the clinicopathologic information retrospectively reviewed images independently. Referring to previous studies, [1-3] the following imaging characteristics were selected to be evaluated: (a) presence of papillary configuration on T2WI; (b) low, moderate, high, and nondetectable recorded signal intensity of the lesions relative to the spleen on T2WI; (c) the layered pattern on T2WI; (d) the layered pattern on DWI. Based on the research of Lee NK et al.,[3] GB lesions were classified into five types according to T2WI and DWI images (Table 2). These patterns were categorized as benign (types 1, 2, 5) and malignant group (types 3, 4) on T2WI and DWI images, respectively. Two other abdominal radiologists with 5-10 years of experience measured the apparent diffusion coefficient (ADC) value at Workstation 4.6 (GE Healthcare). ADC values of the lesion and normal liver parenchyma on the same images were quantified by manually drawing circular regions of interest on the ADC map of the DWI. Lesion to liver parenchyma ratio (LLR) was defined as the ratio of the mean ADC value of lesion and mean ADC value of normal liver parenchyma. The diagnostic performance of six image features including the layered pattern on T2-weighted imaging and diffusion-weighted imaging images, T2WI signal intensity, papillary growth, the ADC value, and the LLR of gallbladder were evaluated and compared. The receiver operating characteristic (ROC) curve and binary logistic regression analysis were used to construct the optimally combined indicator. The interobserver reliability was calculated by the Cohen's Kappa coefficient for categorical data and the intraclass correlation coefficient (ICC) for quantitative data. Cohen’s kappa and ICC results were classified as follows: >0.80, excellent; 0.61 to 0.80, good; 0.41 to 0.60, medium; and <0.4, poor. Analysis was calculated using MedCalc (version 19.1.2; Mariakerke, Belgium) and SPSS (version 26; Chicago, IL). Differences with a P value less than 0.05 were considered statistically significant.Results
The agreements were ‘good’ to ‘excellent’ for pattern analysis on T2WI and DWI images, T2 signal intensity, and papillary growth between two reviewers (kappa values were 0.772, 0.862, 0.707, and 0.772, respectively). ICC values for mean ADC value measurements at GB lesions and normal liver parenchyma were ‘good’ to ‘excellent’ (ICCs were 0.849 and 0.797, respectively) between two radiologists. There were significant differences between benign and malignant groups in the pattern analysis on T2WI and DWI images, T2WI signal intensity, papillary growth (Table 3). A case of GBC is shown in Fig.1. The layered pattern on DWI and LLR had the highest AUC value (0.904), followed by the layered pattern on T2WI (0.883), T2WI signal intensity (0.859), ADC value (0.836), and papillary growth (0.796). There was no statistically significant difference in the AUC among indicators for pairwise comparisons. A combination of layered patterns on DWI and papillary growth was shown to be the optimal indicator by binary logistic regression analysis. The AUC value of the combination (0.972) was higher than the layered pattern on DWI (0.904) and papillary growth (0.796) (P<0.001). Details are shown in Fig.2.Conclusions
The results of this study suggest that all the image indicators (the layered pattern on T2WI and DWI images, T2 signal intensity, papillary growth, ADC, and LLR) were shown to have high diagnostic accuracy. In addition, the layered pattern on DWI combined with papillary growth was demonstrated as the optimal indicator for differentiating benign GB thickening diseases and wall-thickening type GBC in non-contrast MR scans.Acknowledgements
No acknowledgement found.References
[1] Cha SY, Kim YK, Min J, Lee J, Cha D, Lee S. Usefulness of noncontrast MRI in differentiation between gallbladder carcinoma and benign conditions manifesting as focal mild wall thickening. Clinical imaging. 2019;54:63-70.
[2] Jung S, Lee J, Lee K, et al. Gallbladder wall thickening: MR imaging and pathologic correlation with emphasis on layered pattern. European Radiology. 2004;15:694-701.
[3] Lee NK, Kim S, Kim T, Kim D, Seo HI, Jeon T. Diffusion-weighted MRI for differentiation of benign from malignant lesions in the gallbladder. Clinical radiology. 2014;69 2:e78-85.
Figures
Table 1 MRI
sequences and parameters
Table 2 Classification
of layered patterns on T2WI and DWI images for wall-thickening type gallbladder
diseases
Table 2 Non-quantitative MRI image features in two groups of subjects with gallbladder carcinoma and benign disease
Fig. 1 (a) ROC curves of layered pattern on T2WI and DWI, T2 signal intensity,
papillary growth, ADC and LLR; The AUC was 0.883, 0.904, 0.796, 0.859, 0.836,
0.904 for layered pattern on T2WI, layered pattern on DWI, T2 signal intensity,
papillary growth, ADC and LLR, respectively; (b) ROC curves of layered pattern on DWI, papillary growth, and the combination of them; The AUC of the combination was
0.972, which was higher than that of layered pattern on DWI and papillary growth alone (P<0.01).
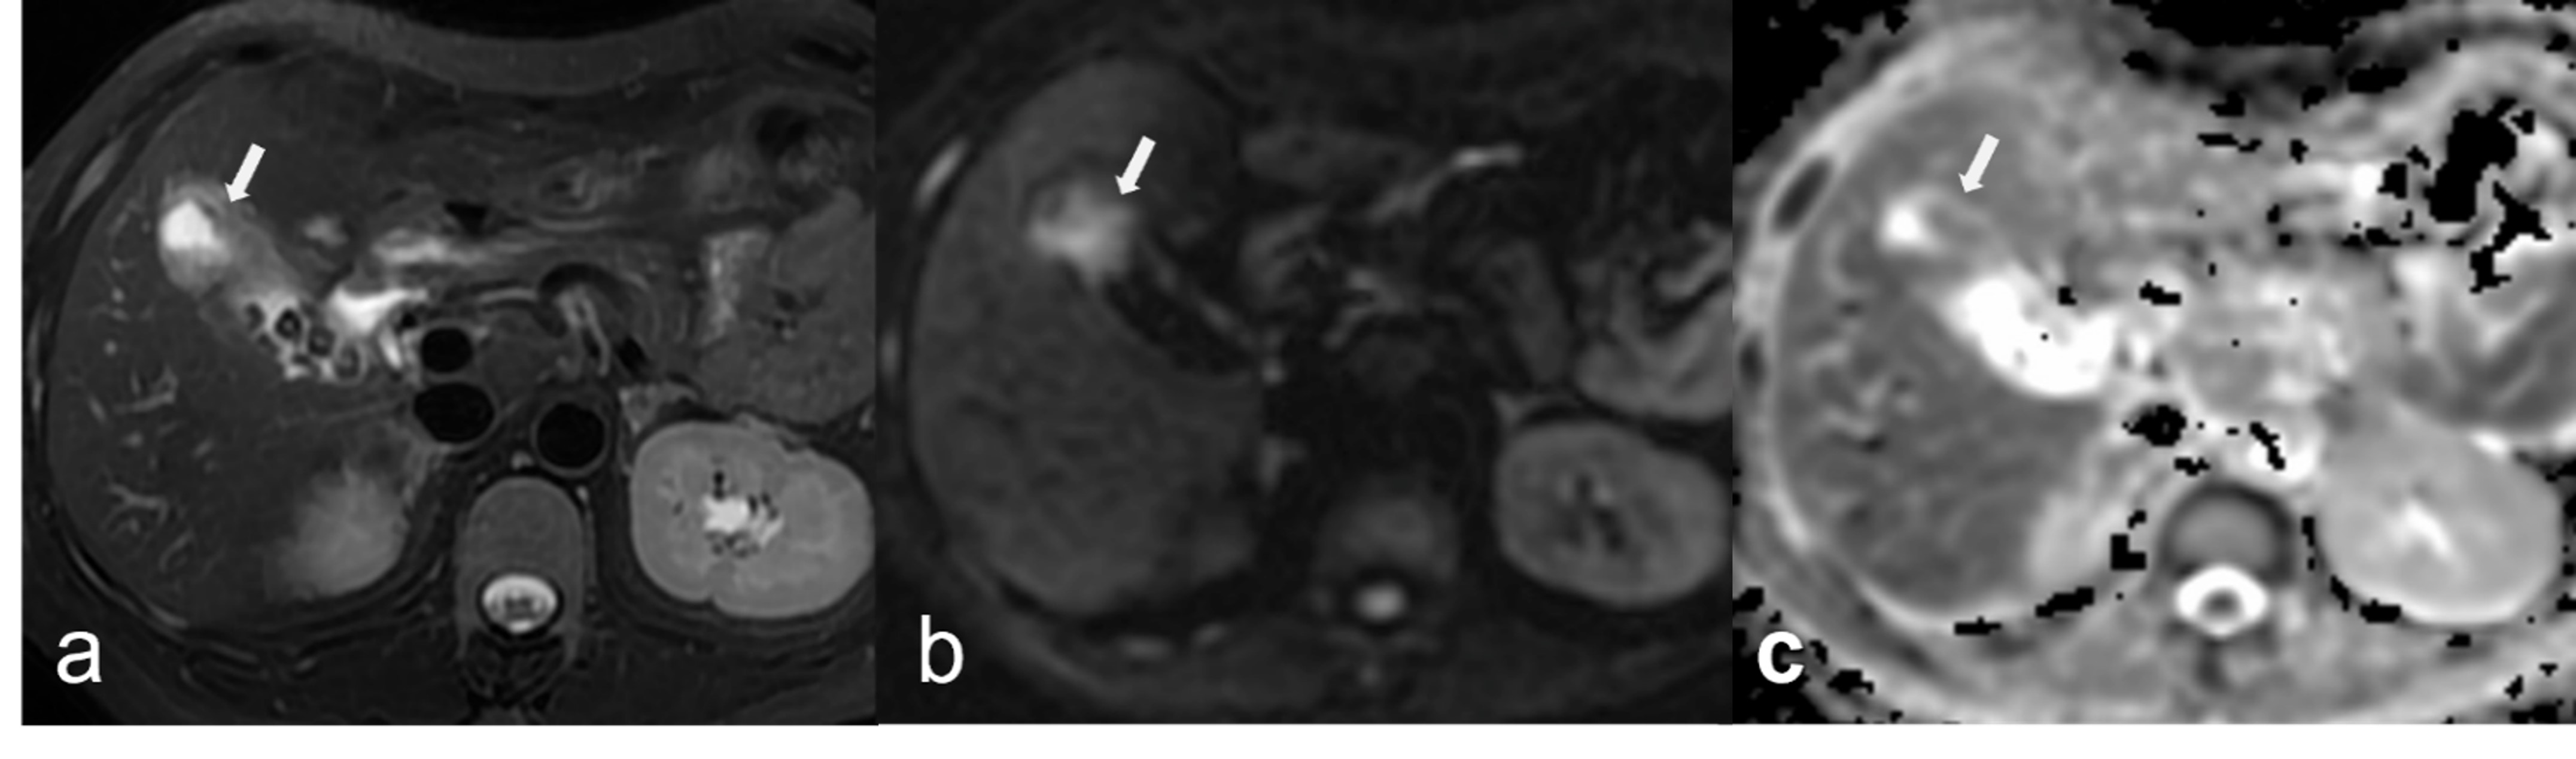
Fig. 2 Moderately-poorly
differentiated gallbladder adenocarcinoma in a 48-year-old female
(a) Focal wall thickening without layered
appearance in the fundus of gallbladder (arrow) was shown on T2WI fat
saturation image (type 3), with papillary growth
pattern; (b, c) Localized hyperintensity (arrow) was shown on DWI and
hypointensity (arrow) on ADC map, without layered pattern (type 3).
DOI: https://doi.org/10.58530/2023/0801