0800
Prediction of microvascular invasion in solitary hepatocellular carcinoma using bi-regional quantitative dynamic contrast-enhanced MRI1Department of Diagnostic Radiology, National Cancer Center/National Clinical Research Center for Cancer/Cancer Hospital, Chinese Academy of Medical Sciences and Peking Union Medical College, Beijing, China, 2GE healthcare, China, Beijing, China
Synopsis
Keywords: Liver, Tumor, Pathology, Microvascular invasion
The peri-tumoral region (PTR) of liver is the main-site of microvascular invasion (MVI) taken place, and contains perfusion information which could reflected the hemodynamic change during MVI. This study investigated the value of quantitative dynamic contrast-enhanced MRI (DCE-MRI) to evaluate the MVI status of hepatocellular carcinoma (HCC) in both intra-tumoral region (ITR) and PTR. The result showed quantitative DCE-MRI perfusion parameters could predict the MVI status in both ITR and PTR. Combining parameters from ITR and PTR could improve the prediction performance. Our study suggest quantitative DCE-MRI perfusion parameters could be employed as an efficient approach to predicting MVI status.Introduction
Microvascular invasion (MVI) is a significant risk factor for tumor recurrence after radical resection of hepatocellular carcinoma (HCC) [1-3]. Preoperative assessments of MVI via various imaging modalities mainly focused on features inside of tumor, while the peri-tumoral areas have been less explored. Pathologically, peritumoral areas is the first area of incidence of MVI. Therefore, comparing to the tumor area, imaging features involving peri-tumoral areas may reveal a more direct association with MVI [4]. Quantitative dynamic contrast-enhanced MRI (DCE-MRI) could obtain quantitative perfusion parameters [5-7]. However, whether DCE-MRI perfusion parameters could improve the predictive performance of MVI from core tumoral and peritumoral regions is not clear. In this study, we aimed to investigate the potential value of quantitative DCE-MRI perfusion parameters for predicting MVI of hepatocellular carcinoma in both intra-tumoral and peri-tumoral regions, and establish prediction model to predict MVI in HCC patients.Materials and Methods
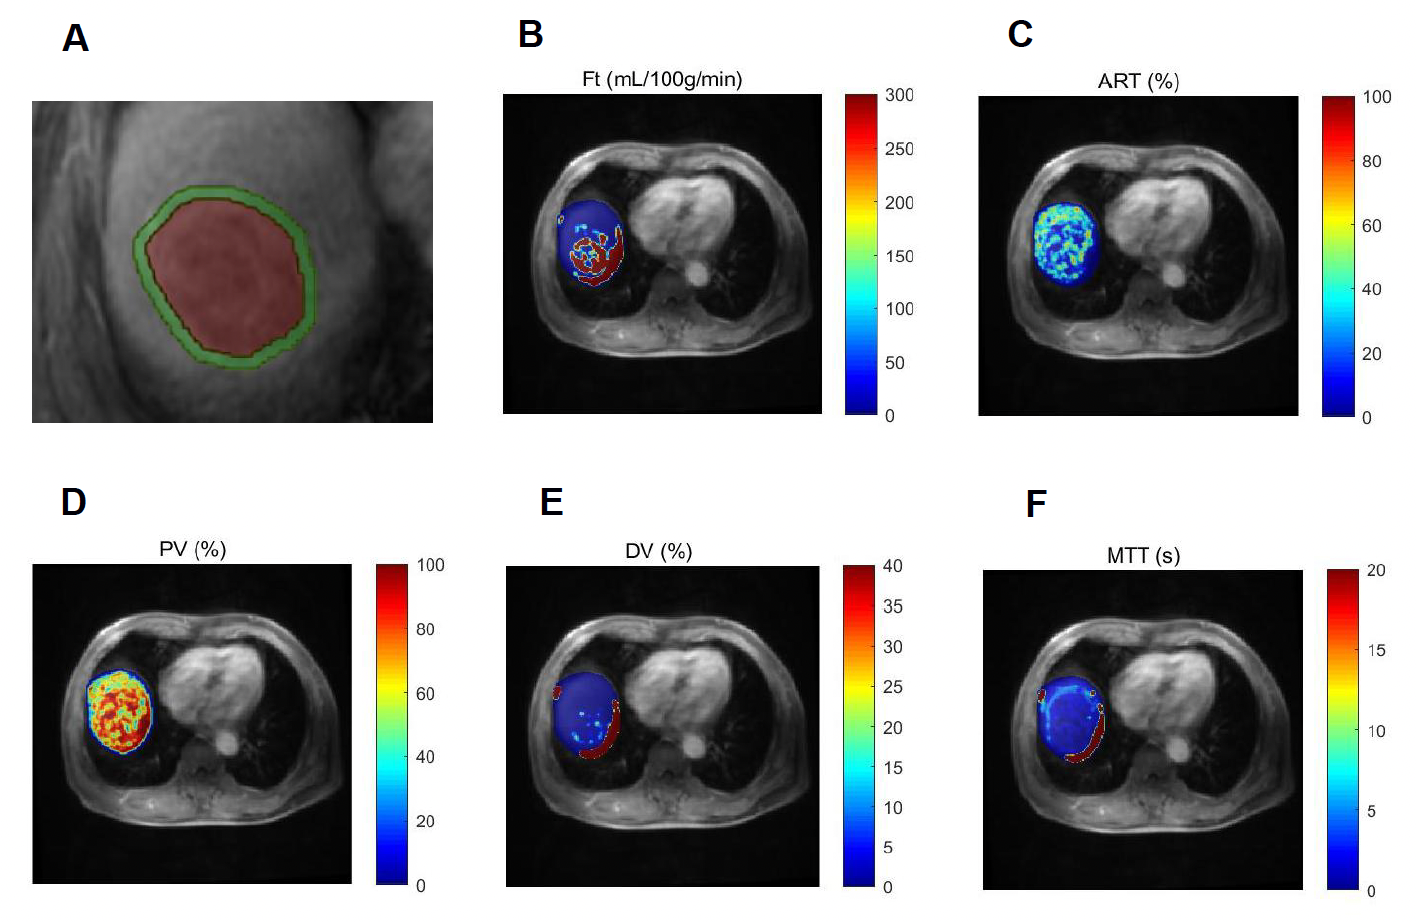
Suspected HCC patients who underwent quantitative DCE-MRI studies between January 2020 and September 2022 were enrolled in our hospital. All patients underwent contrast enhanced MR examination on a 3.0T MRI system (SIGNATM Architect, GE Healthcare, Milwaukee, WI, USA) equipped with AIRTM anterior array coil 15 days prior to radical hepatectomy. The diagnosis of HCC was confirmed by pathology postoperatively. Quantitative DCE-MRI was performed by using LAVA-XV sequence with breath-hold. According to our previous study [8], a dynamic scan with 42 consecutive phases was performed with a temporal resolution of 6 s/phase. A bolus of gadopentetate dimeglumine (Magnevist, Bayer Schering, Germany) at a constant dose of 0.1 mmol/kg was power injected, followed by a 20 mL saline flush at a rate of 2.5 mL/s for all patients. The acquisition time was 18 s for each of the three consecutive phases with an interval of 5-10 s; and the total scanning time for DCE-MRI was 5-6 min. The DCE perfusion analysis was performed on MATLAB R2018b (Mathworks, Natick, MA, USA). A dual-input single compartment model was used to fit the time activity curves [9]. The following pseudocolor maps of the perfusion parameters were generated: total blood flow (Ft, ml/ min/100 g), arterial fraction (ART, %), portal venous fraction (PV, %), distribution volume (DV, %), and mean transit time (MTT, sec). Subsequently, intratumoral ROIs along the tumor boundaries and peritumoral ROIs with 5 mm from the tumor border placed on DCE-MR images, which illustrated in Figure 1. The ROIs were then transferred to the same regions on all parametric maps and the perfusion parameters were extracted. All statistical analyses were conducted using R software. Variables were compared using Student’s t-test, Mann-Whitney U, χ2, or Fisher’s exact test as appropriate. Multivariate logistic regression analyses were performed to construct the combined model for MVI prediction using the significant perfusion parameters above and the risk for MVI were calculated. The receiver operating characteristic (ROC) curve was performed to evaluate the prediction performance, quantified by the area under the curve (AUC), sensitivity, and specificity.Results
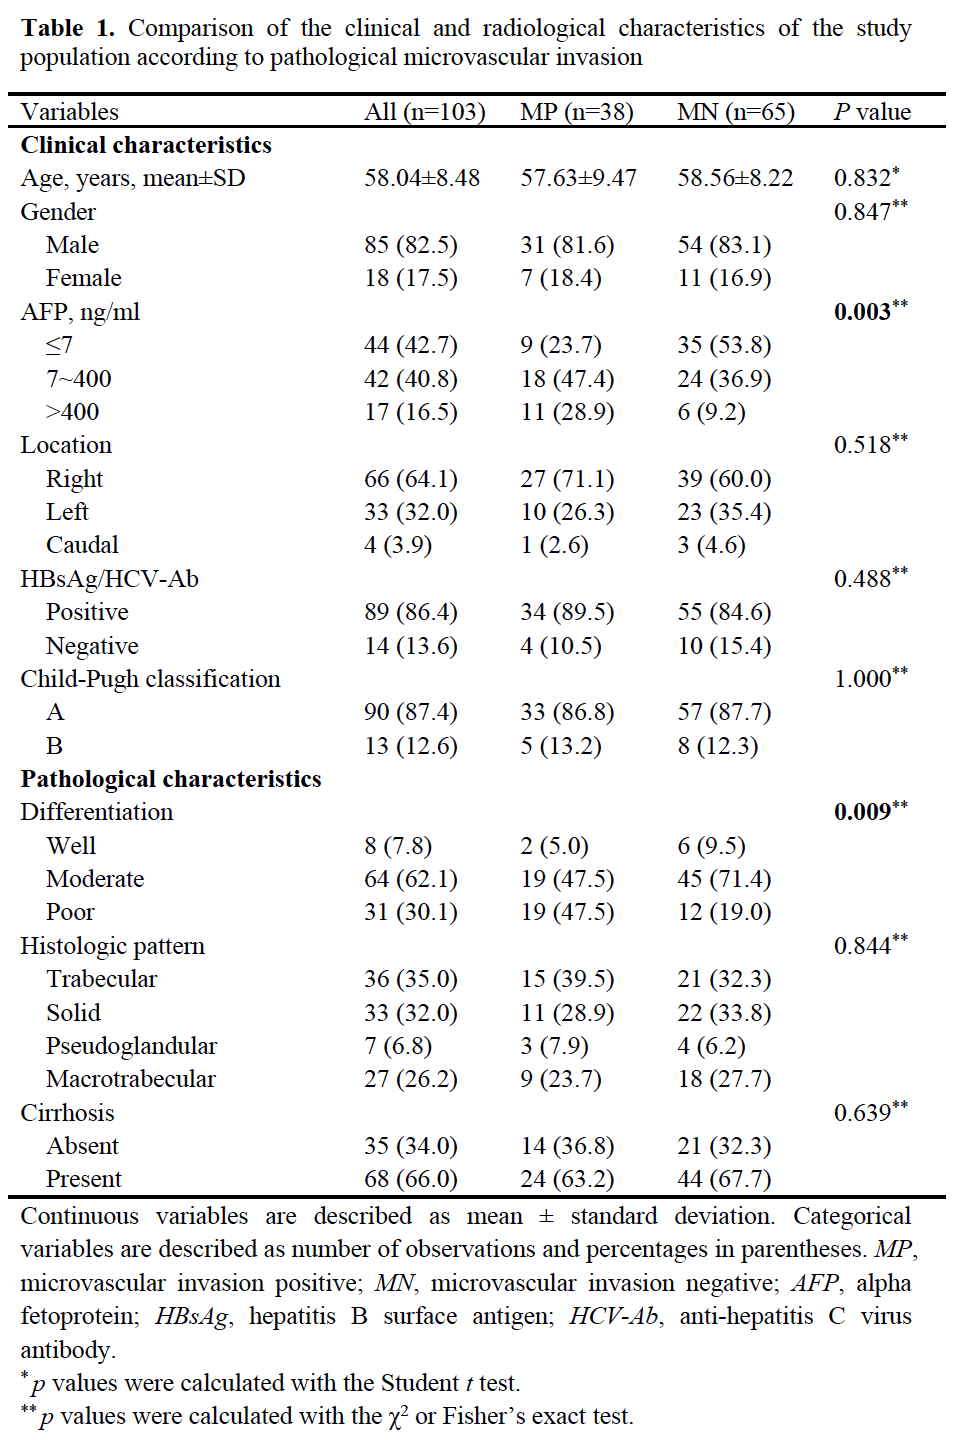
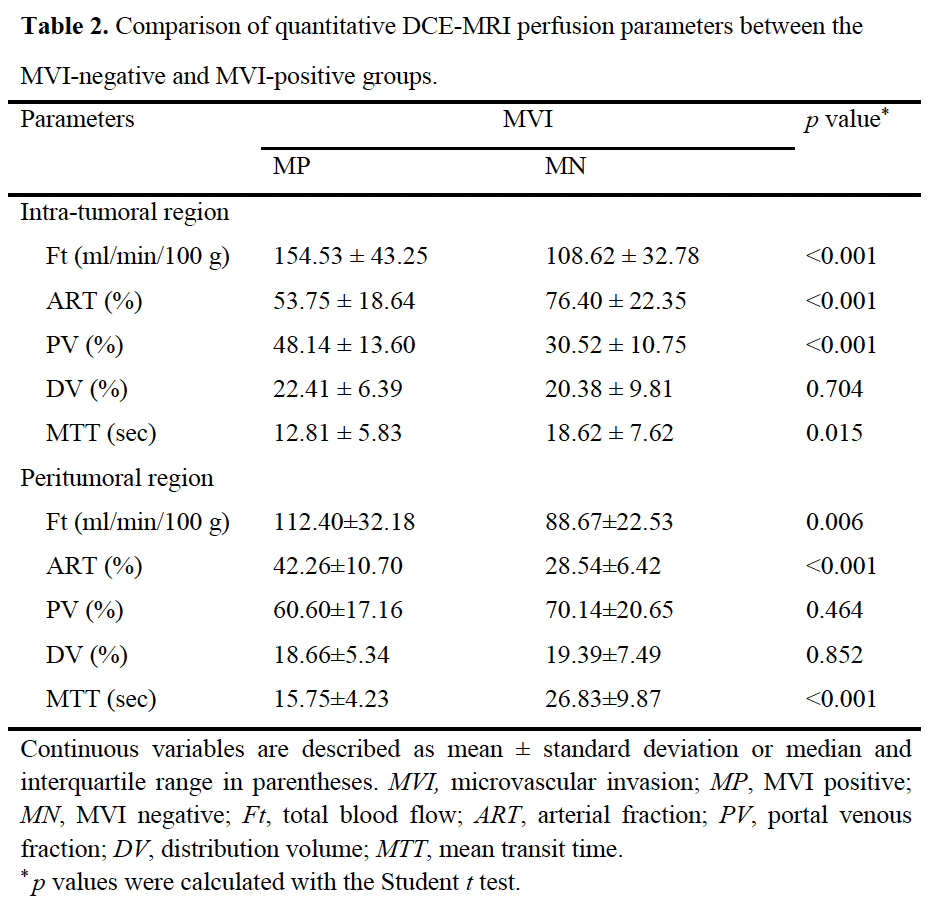
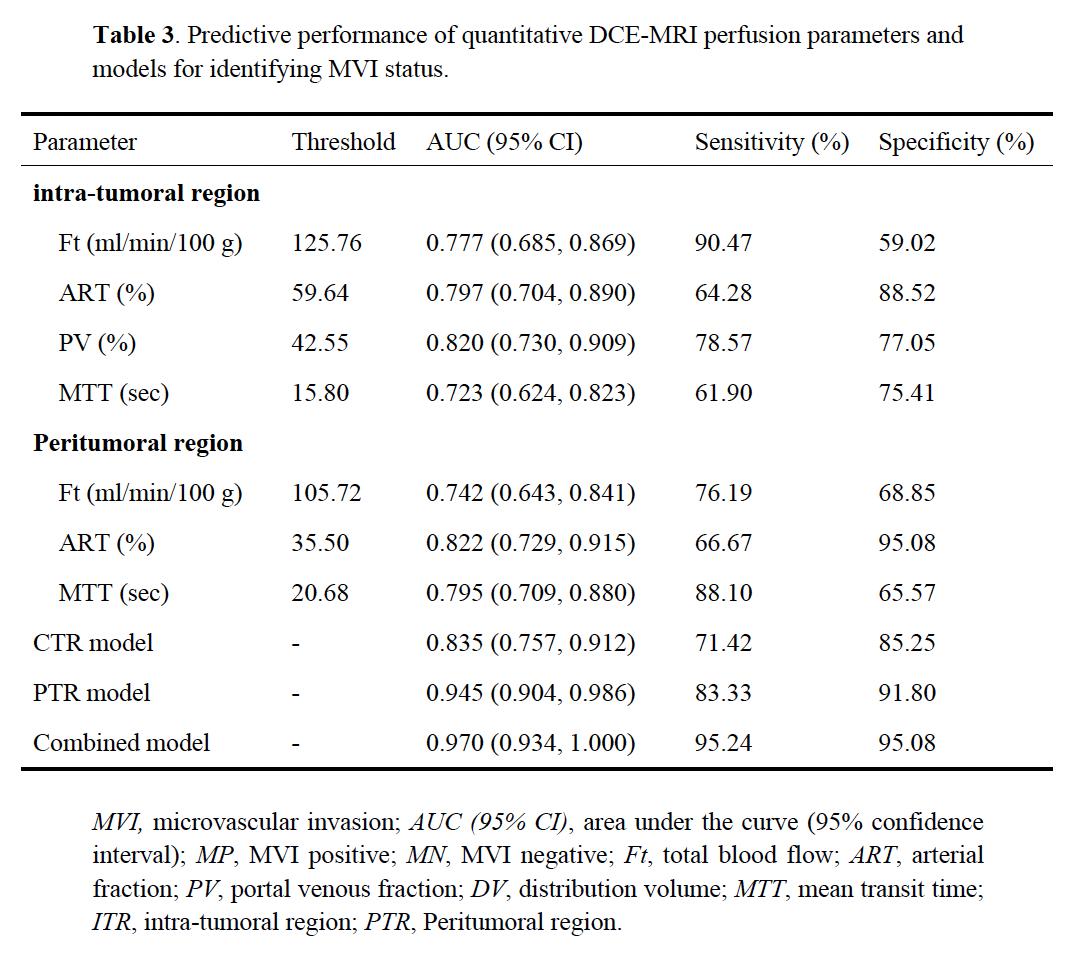
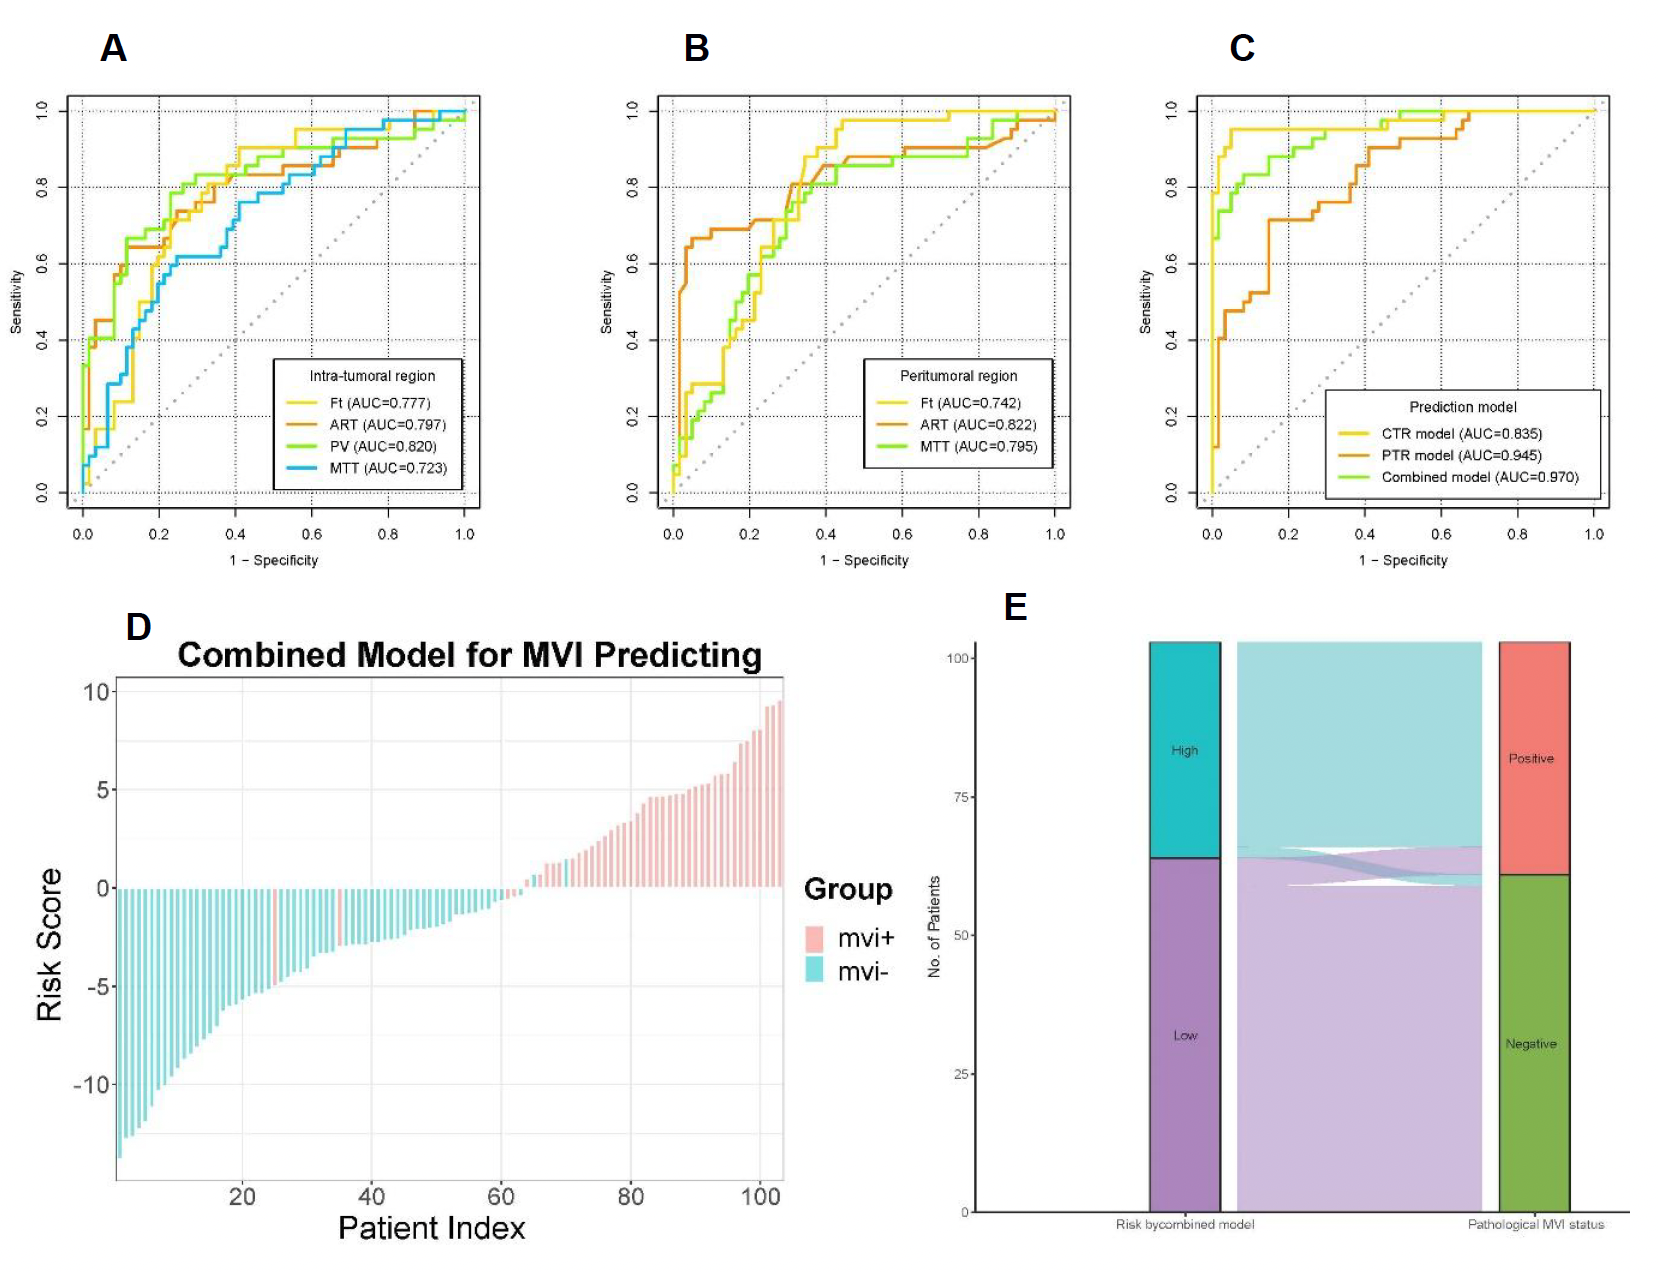
The final study cohort included 103 patients (mean age, 58 years ± 8 [SD]; 85 men and 18 women) with 38 (36.9%) MVI-positive (MP) group and 65 (63.1%) MVI-negative (MN) group. The demographics of the two groups are summarized in Table 1. Compared to MN group, MP group tended to have a higher serum AFP level (p=0.003) and lower tumor differentiation (p=0.009). Results of the comparison of quantitative DCE-MRI perfusion parameters in MP and MN groups are summarized in Table 2. The results showed that in intra-tumoral region (ITR), Ft, ART, PV, and MTT values showed significantly different in MP and MN groups (all p<0.001); while Ft, ART, and MTT values showed significantly different in MP and MN groups (all p<0.001) in peritumoral region (PTR). Example of HCC with MVI positive is shown in Figure 1. ROC analysis results using the above significant parameters are presented in Table 3. The combined model integrating ITR and PTR perfusion parameters could improve the prediction performance to an AUC of 0.970 (Figure 2).Discussion and Conclusion
This study evaluated the DCE-MRI perfusion parameters derived from dual-input single-compartment model between MVI-positive and MVI-negative in small solitary HCC. The results suggest that the DCE-MRI perfusion parameters can be used to differentiate the MVI status preoperatively and noninvasively. Parameters in PTR were superior to ITR in predicting MVI status. This was consistent with the fact that peritumoral areas is the main site of MVI occurrence. The tumor thrombus in peritumoral small vessels could influence the perfusion and hemodynamic of this liver parenchyma. Our result also implied that the ITR and PTR might have different perfusion changes in different MVI status groups in HCC. In clinical practice, the combined ITR and PTR DCE-MRI perfusion parameters might improve the predictive performance in predicting MVI status compared with ITR alone.In conclusion, quantitative DCE-MRI perfusion parameters provide an efficient approach to predicting MVI status. Additionally, using a combined model with ITR and PTR can improve prediction performance. It might be beneficial for clinicians to objectively select appropriate therapeutic approaches and to employ DCE-MR as an individualized prediction tool to improve clinical prognosis in HCC.
Acknowledgements
None
References
[1] Isik B, Gonultas F, Sahin T, Yilmaz S (2020) Microvascular venous invasion in hepatocellular carcinoma: Why do recurrences occur? J Gastrointest Cancer 51(4):1133-1136.
[2] Zhang EL, Cheng Q, Huang ZY, Dong W (2021) Revisiting surgical strategies for hepatocellular carcinoma with microvascular invasion. Front Oncol 11:691354.
[3] Zhou J, Sun H, Wang Z et al (2020) Guidelines for the diagnosis and treatment of hepatocellular carcinoma (2019 edition). Liver Cancer 9(6):682-720.
[4] Feng ST, Jia Y, Liao B et al (2019) Preoperative prediction of microvascular invasion in hepatocellular cancer: a radiomics model using Gd-EOB-DTPA-enhanced MRI. Eur Radiol 29(9):4648-4659.
[5] You SH, Choi SH, Kim TM et al (2018) Differentiation of High-Grade from Low-Grade Astrocytoma: Improvement in Diagnostic Accuracy and Reliability of Pharmacokinetic Parameters from DCE MR Imaging by Using Arterial Input Functions Obtained from DSC MR Imaging. Radiology 286:981-991.
[6] Hao Y, An R, Xue Y et al (2021) Prognostic value of tumoral and peritumoral magnetic resonance parameters in osteosarcoma patients for monitoring chemotherapy response. Eur Radiol. 31:3518-3529.
[7] Zeng Q, Hong Y, Cheng J et al (2021) Quantitative study of preoperative staging of gastric cancer using intravoxel incoherent motion diffusion-weighted imaging as a potential clinical index. Eur J Radiol 141:109627.
[8] Zhu Y, Jiang Z, Wang B et al (2022) Quantitative Dynamic-Enhanced MRI and Intravoxel Incoherent Motion Diffusion-Weighted Imaging for Prediction of the Pathological Response to Neoadjuvant Chemotherapy and the Prognosis in Locally Advanced Gastric Cancer. Front Oncol 12:841460.
[9] Hagiwara M, Rusinek H, Lee VS et al (2008) Advanced liver fibrosis: diagnosis with 3D whole-liver perfusion MR imaging--initial experience. Radiology 246(3):926-34.
Figures