0798
Magnetic resonance fingerprinting for objective and contrast-free focal liver lesion characterization: A preliminary study1Department of Radiology, Juntendo University, Tokyo, Japan, 2Department of Radiology, The University of Tokyo, Tokyo, Japan, 3Department of Biomedical Engineering, School of Biomedical Engineering and Imaging Sciences, King’s College London, London, United Kingdom, 4Department of Radiology, University of Michigan, Ann Arbor, MI, United States, 5Department of Human Pathology, Juntendo University, Tokyo, Japan, 6MR Clinical Science, Philips Japan, Tokyo, Japan, 7Department of Hepatobiliary-Pancreatic Surgery, Juntendo University, Tokyo, Japan, 8Department of Gastroenterology, Juntendo University, Tokyo, Japan
Synopsis
Keywords: Liver, MR Fingerprinting
Objective and contrast-free methods for differentiating benign focal liver lesions from malignant lesions (e.g., hepatocellular carcinomas and metastases) are desired. Herein, we evaluated the diagnostic capability of liver magnetic resonance fingerprinting (MRF) in patients with focal liver lesions. Liver MRF provided repeatable T1, T2, T2*, and fat-fraction values for various focal liver lesions. The liver MRF T1 and T2 relaxation times showed high agreement with separate conventional quantitative mapping measurements. Measurements of liver MRF and a combination of MRF relaxation times provided good differentiation of focal liver lesions (AUC of 0.87 for differentiating common benign lesions from common malignant lesions).Introduction
Current focal liver diagnosis is subjective and requires the use of contrast injection, which may be contraindicated in some populations1. Therefore, a less invasive, objective, and quantitative method to assess focal liver disease is desirable.Magnetic resonance fingerprinting (MRF)2 in a single breath-hold scan enables simultaneous T1, T2, T2*, and fat-fraction (FF) mapping of the liver, which is suitable for diagnosing diffuse liver diseases3,4. Quantitative T1 and T2 maps are promising imaging biomarkers in the assessment and follow-up of focal liver lesions5-9.
Herein, we evaluated the agreement between liver MRF-derived values and reference standard imaging in patients with focal liver lesions, and evaluated the scan-rescan repeatability of the liver MRF measurement. We also investigated the diagnostic performance of the multiparametric liver MRF for focal liver lesions.
Methods
Study populationThis prospective study was approved by our institutional review board. Written informed consent was obtained from each participant prior to magnetic resonance (MR) examination. Hepatobiliary and pancreatic surgery and gastroenterology patients in whom a liver mass of ≥ 1 cm was noted on CT or ultrasound were included. Forty-nine patients (24 men and 25 women; age 65.0±13.5 [32-89] years) with 49 focal liver lesions (size:36.7±31.2 mm [10-180]; 30 malignant tumors:14 hepatocellular carcinomas, 9 metastatic tumors, 7 intrahepatic cholangiocarcinomas; 19 benign lesions: 13 hemangiomas, 4 focal nodular hyperplasias, 2 simple cysts) were enrolled.
MR imaging and reconstruction
Liver MRF acquisition is based on a 9-echo, golden-angle radial gradient-echo (GRE) acquisition with bipolar readouts and varying inversion recovery and T2 preparation pulses, allowing simultaneous liver T1, T2, T2*, and FF mapping in a single ~20-s breath-hold scan4, 10. Each conventional mapping was acquired in three separate breath-holds: T1-modified Look-Locker inversion recovery [MOLLI], T2 gradient spin echo [GraSE], and multi-echo GRE for T1, T2, and T2*/FF estimations, respectively. The liver MRF was also rescanned at the end of the same session. All measurements were performed using a 1.5-T scanner (Ingenia; Philips Healthcare, Best, Netherlands).
Analysis
For each parameter map, seven circular regions of interest (ROIs) were manually drawn in the focal liver lesion (whole mass), surrounding liver parenchyma (two different areas), spleen (two different areas), and erector spinae muscle (one on each side). The mean value of each ROI was recorded. Each focal liver lesion ROI was compared with the corresponding reference measurements. The scan-rescan repeatability of each MRF parameter map of the focal liver lesion was assessed using the coefficient of variation (CV), defined as the standard deviation of the quantitative maps derived from the scan and rescan over the mean of both maps. The Wilcoxon signed-rank and Kruskal-Wallis tests were used to compare theMRF values among the focal liver lesions. The ability of T1, T2, and the combination of T1 and T2 (T1+T2) to differentiate lesions was analyzed by the area under the curve (AUC) using receiver operating characteristic (ROC) analysis.
Results
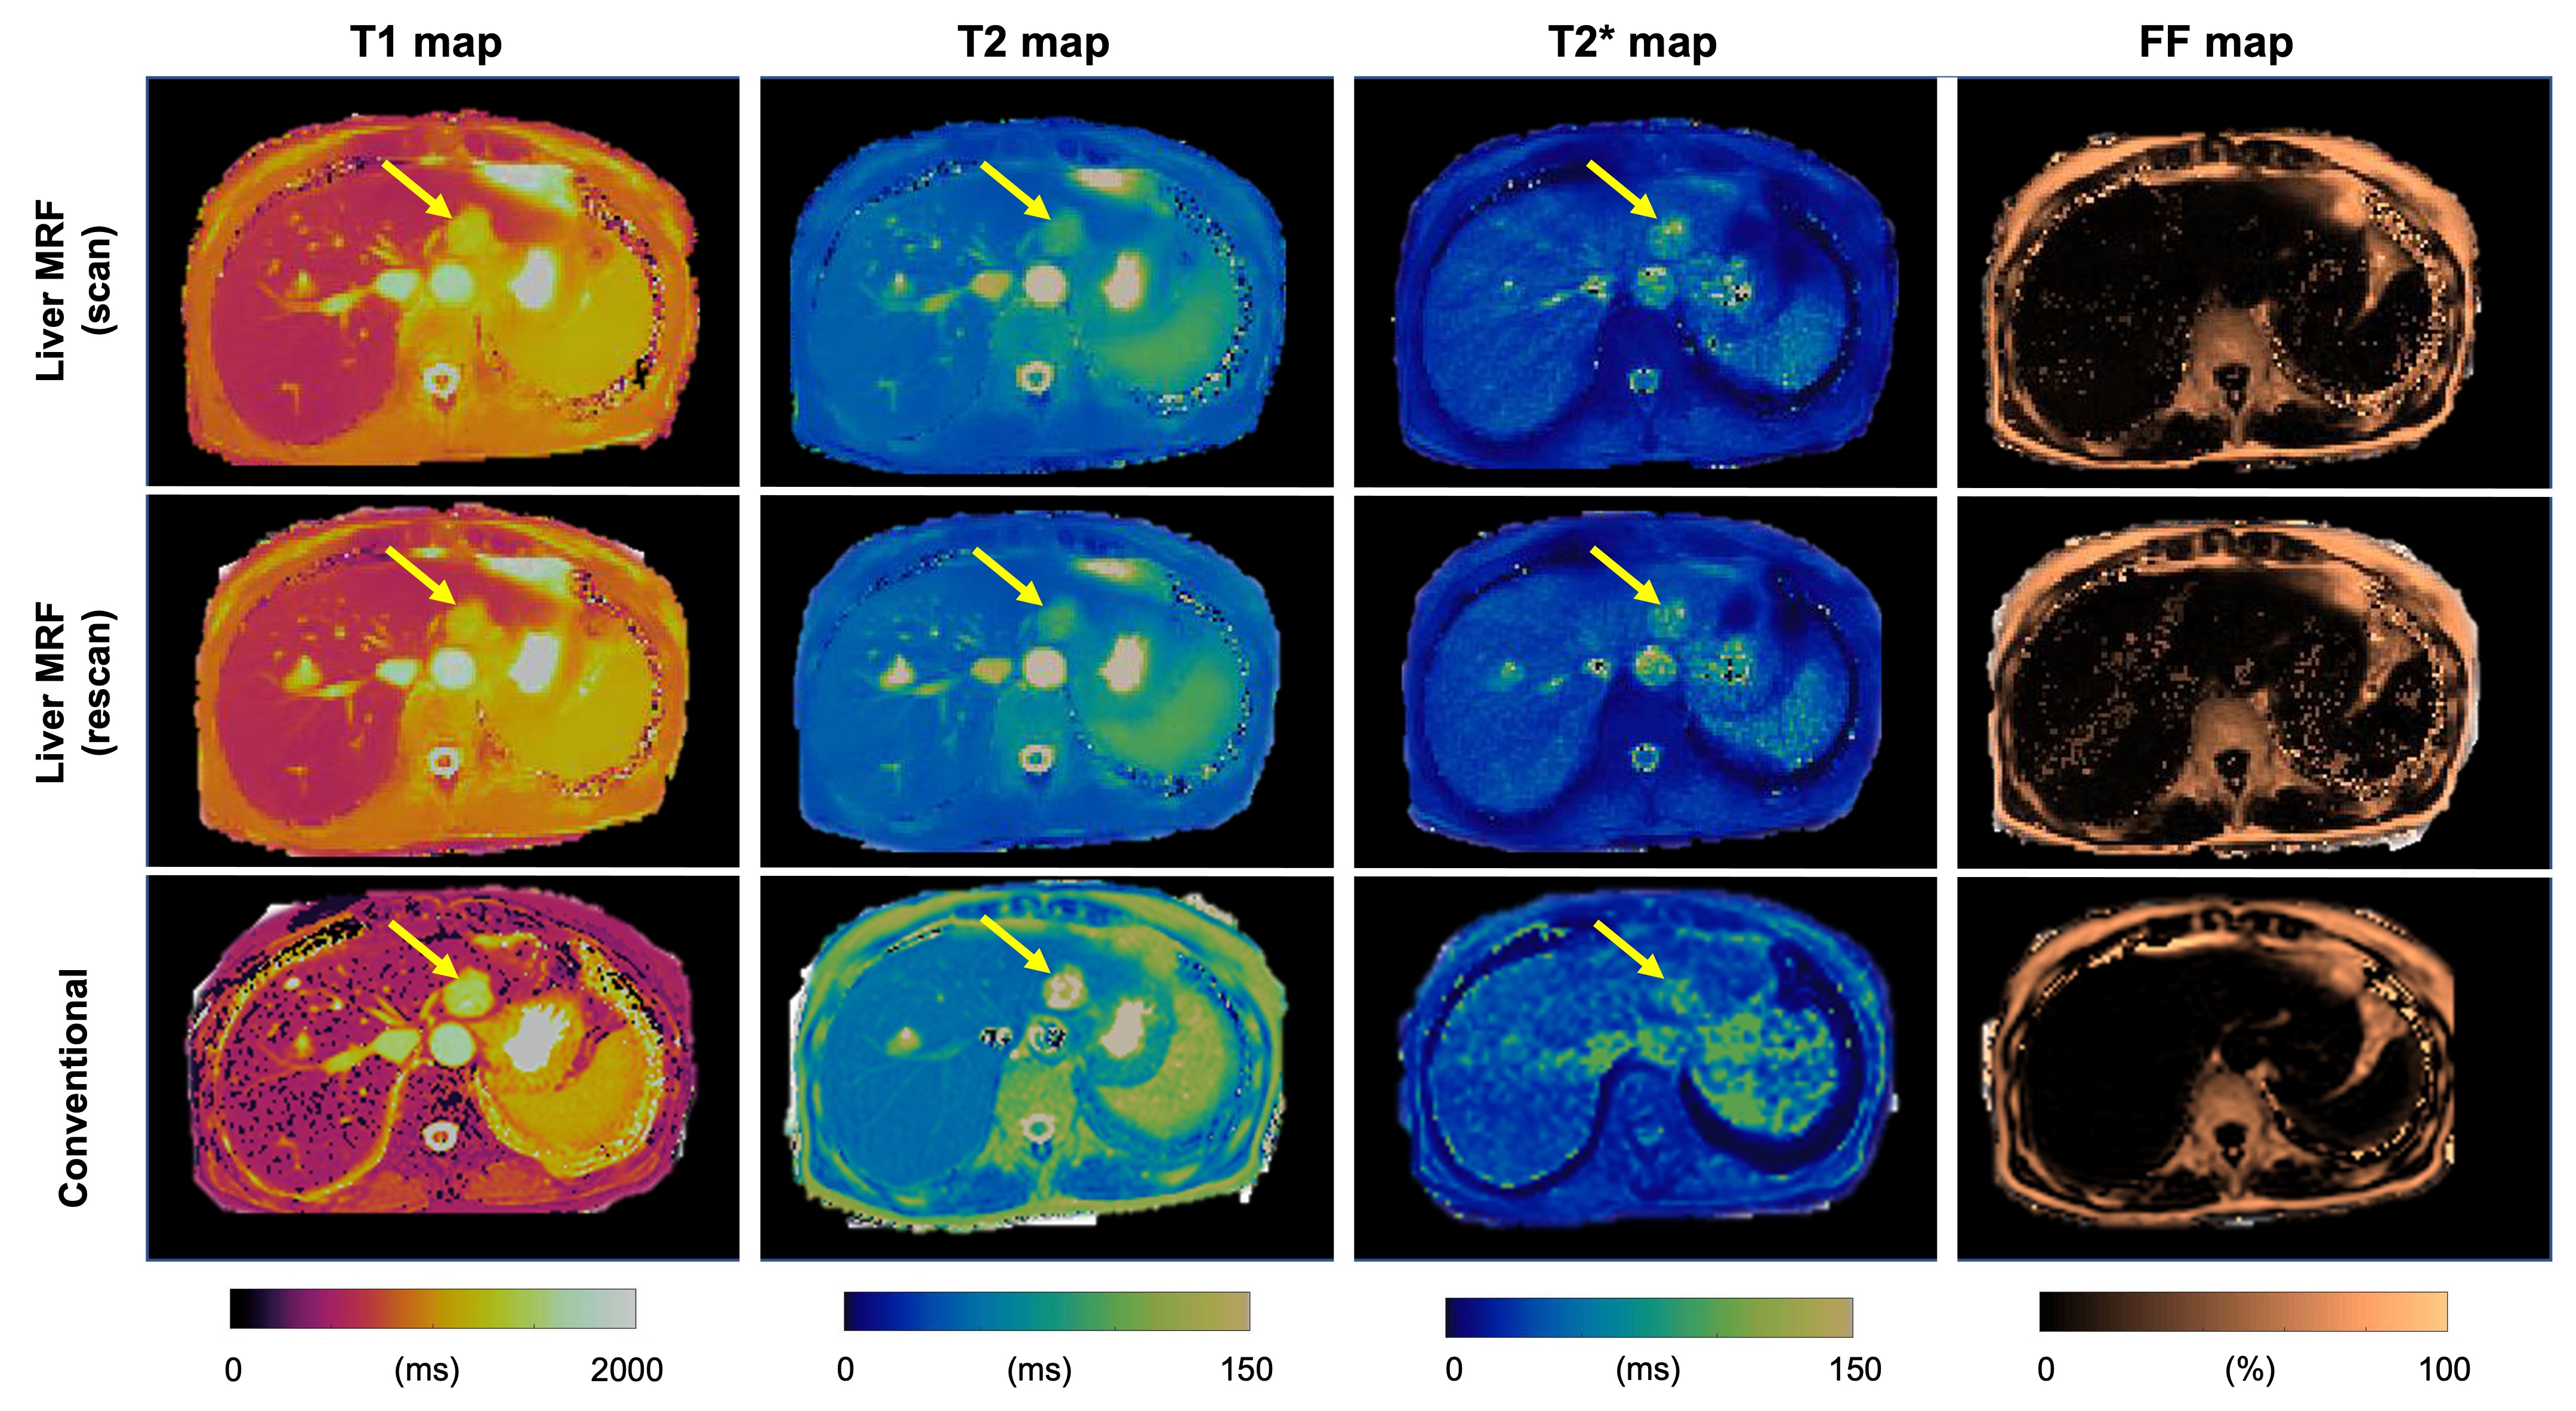
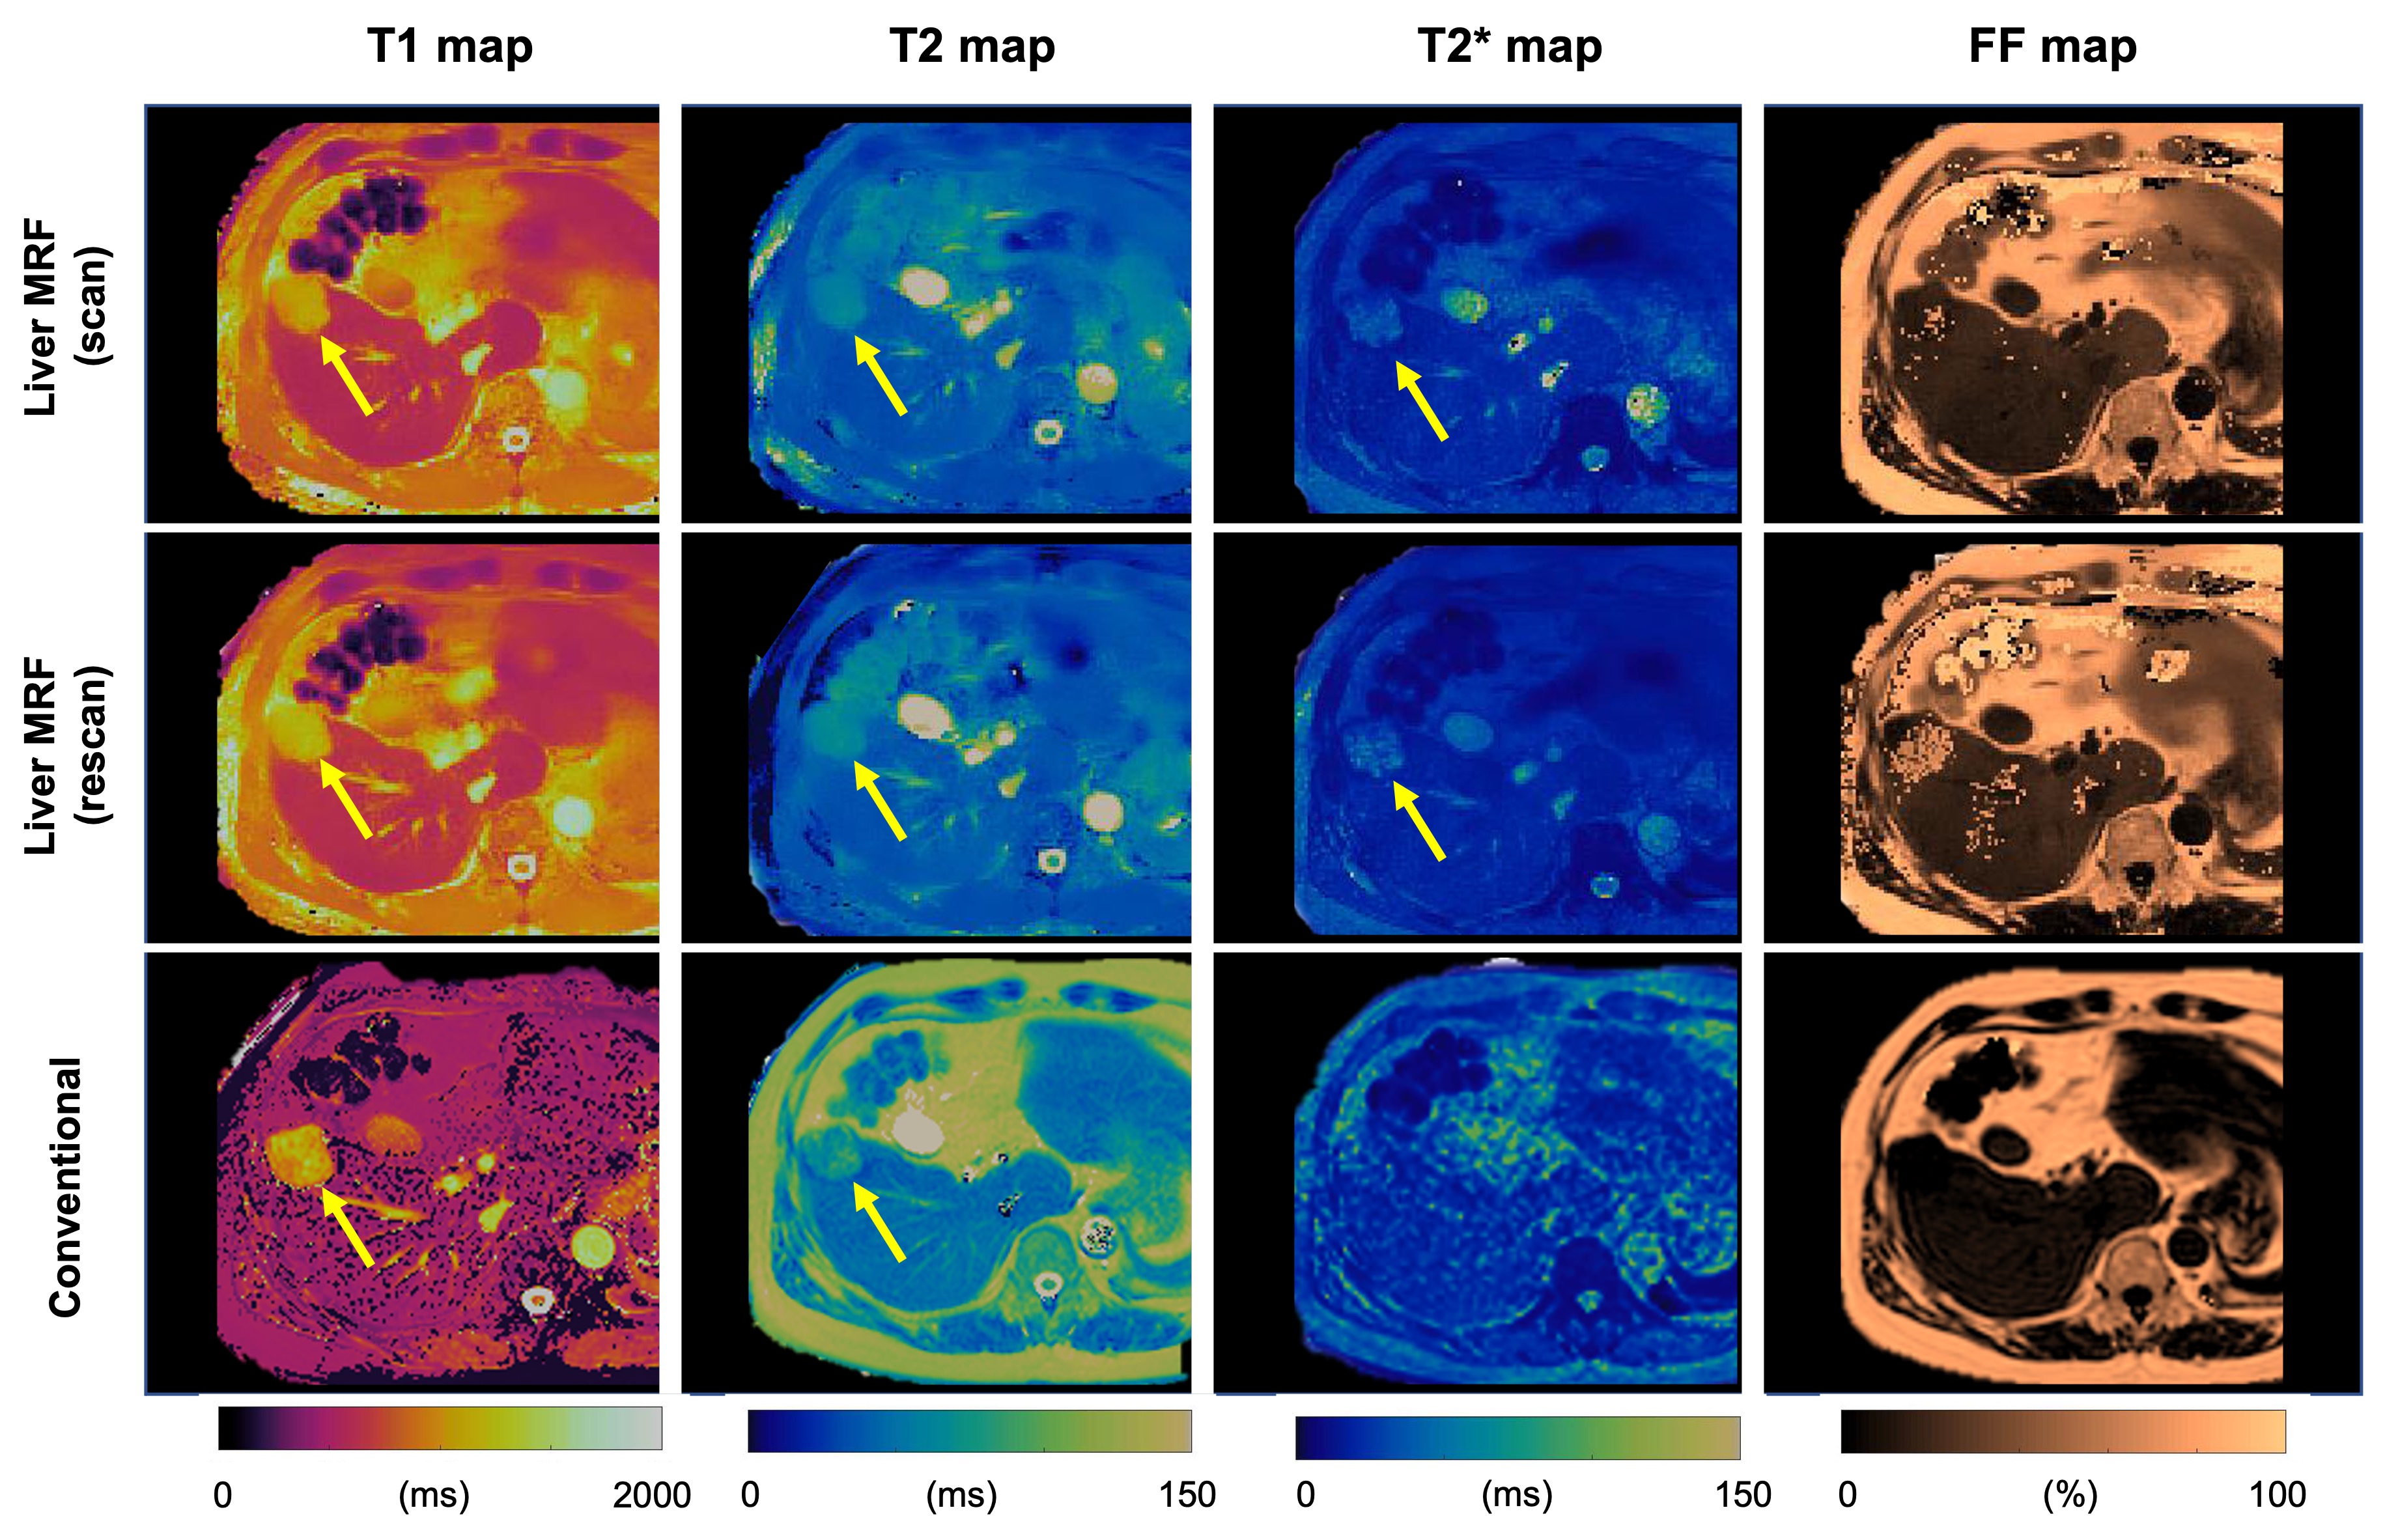
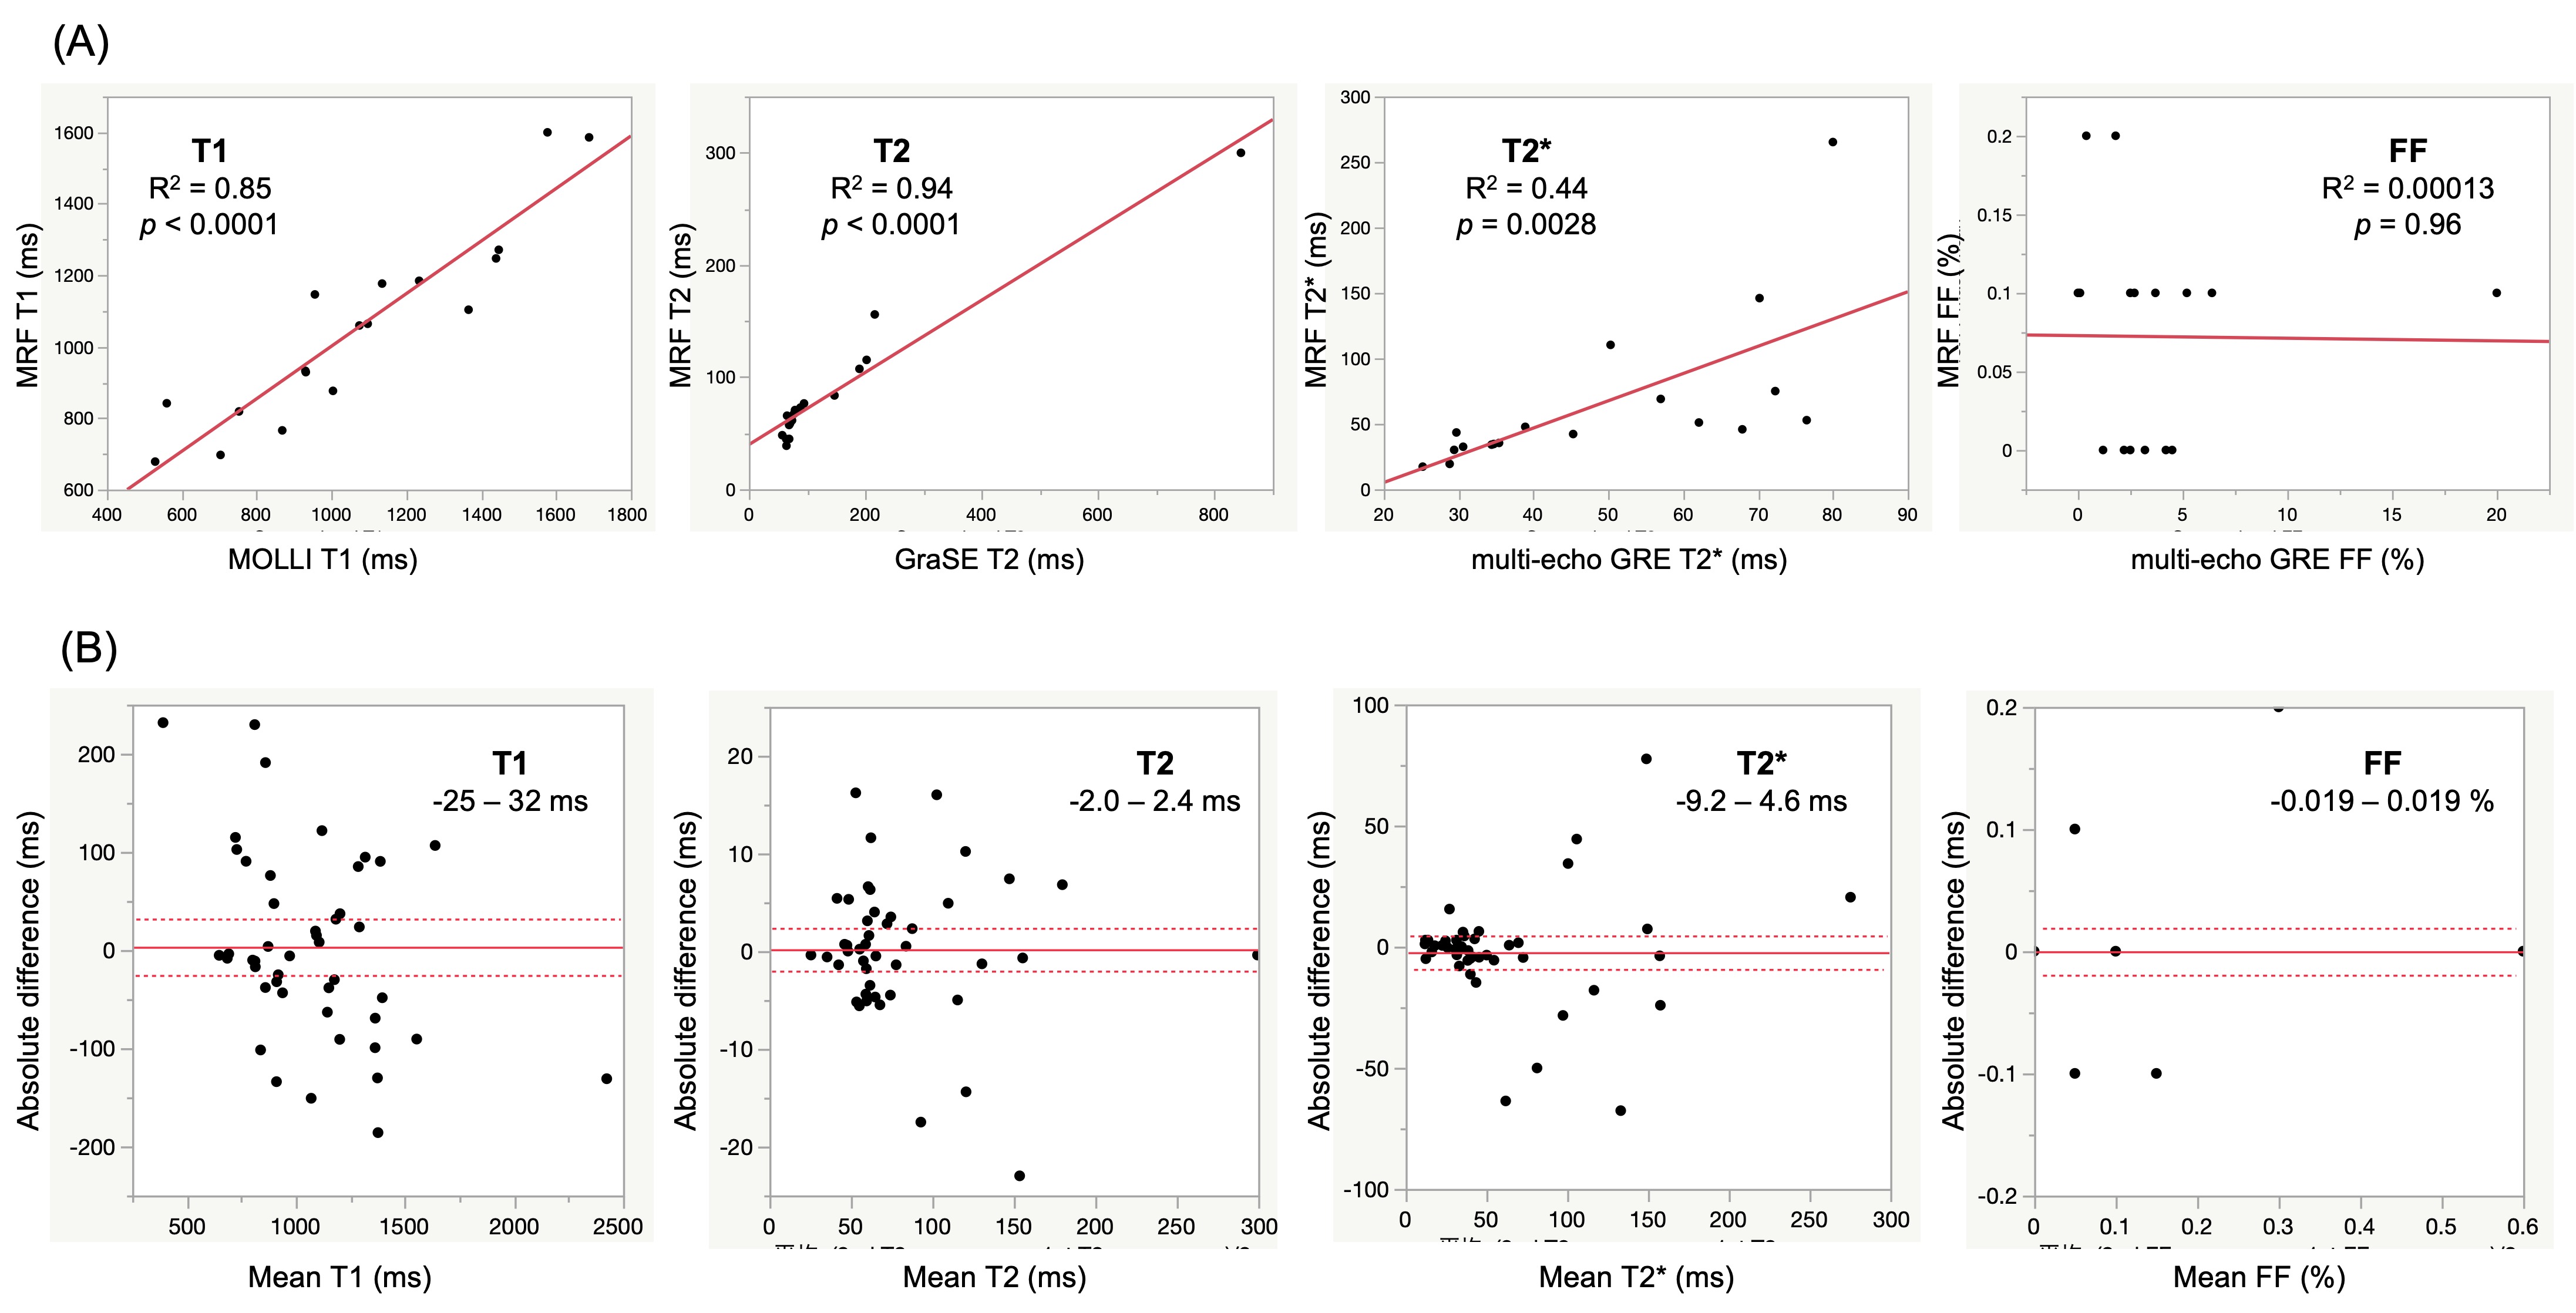
Comparison with reference standard imaging and repeatability of MRF valuesFigures 1 and 2 show representative MRF and conventional T1, T2, T2*, and FF maps of patients with hemangiomas and hepatocellular carcinomas, respectively. Agreement with the reference standard measurements in patients with focal liver lesions is shown in Figure 3A (R2=0.85, 0.94, 0.33, and 0.00013 for T1, T2, T2*, and FF, respectively). The scan-rescan repeatability of each parameter acquired using the MRF is shown in Figure 3B. The overall CV values for repeatability were 5.2%, 4.4%, and 12.7% for T1, T2, and T2*, respectively. We did not calculate the CV of the FF maps because of their small FF values.
Lesion analysis and differentiation by liver MRF
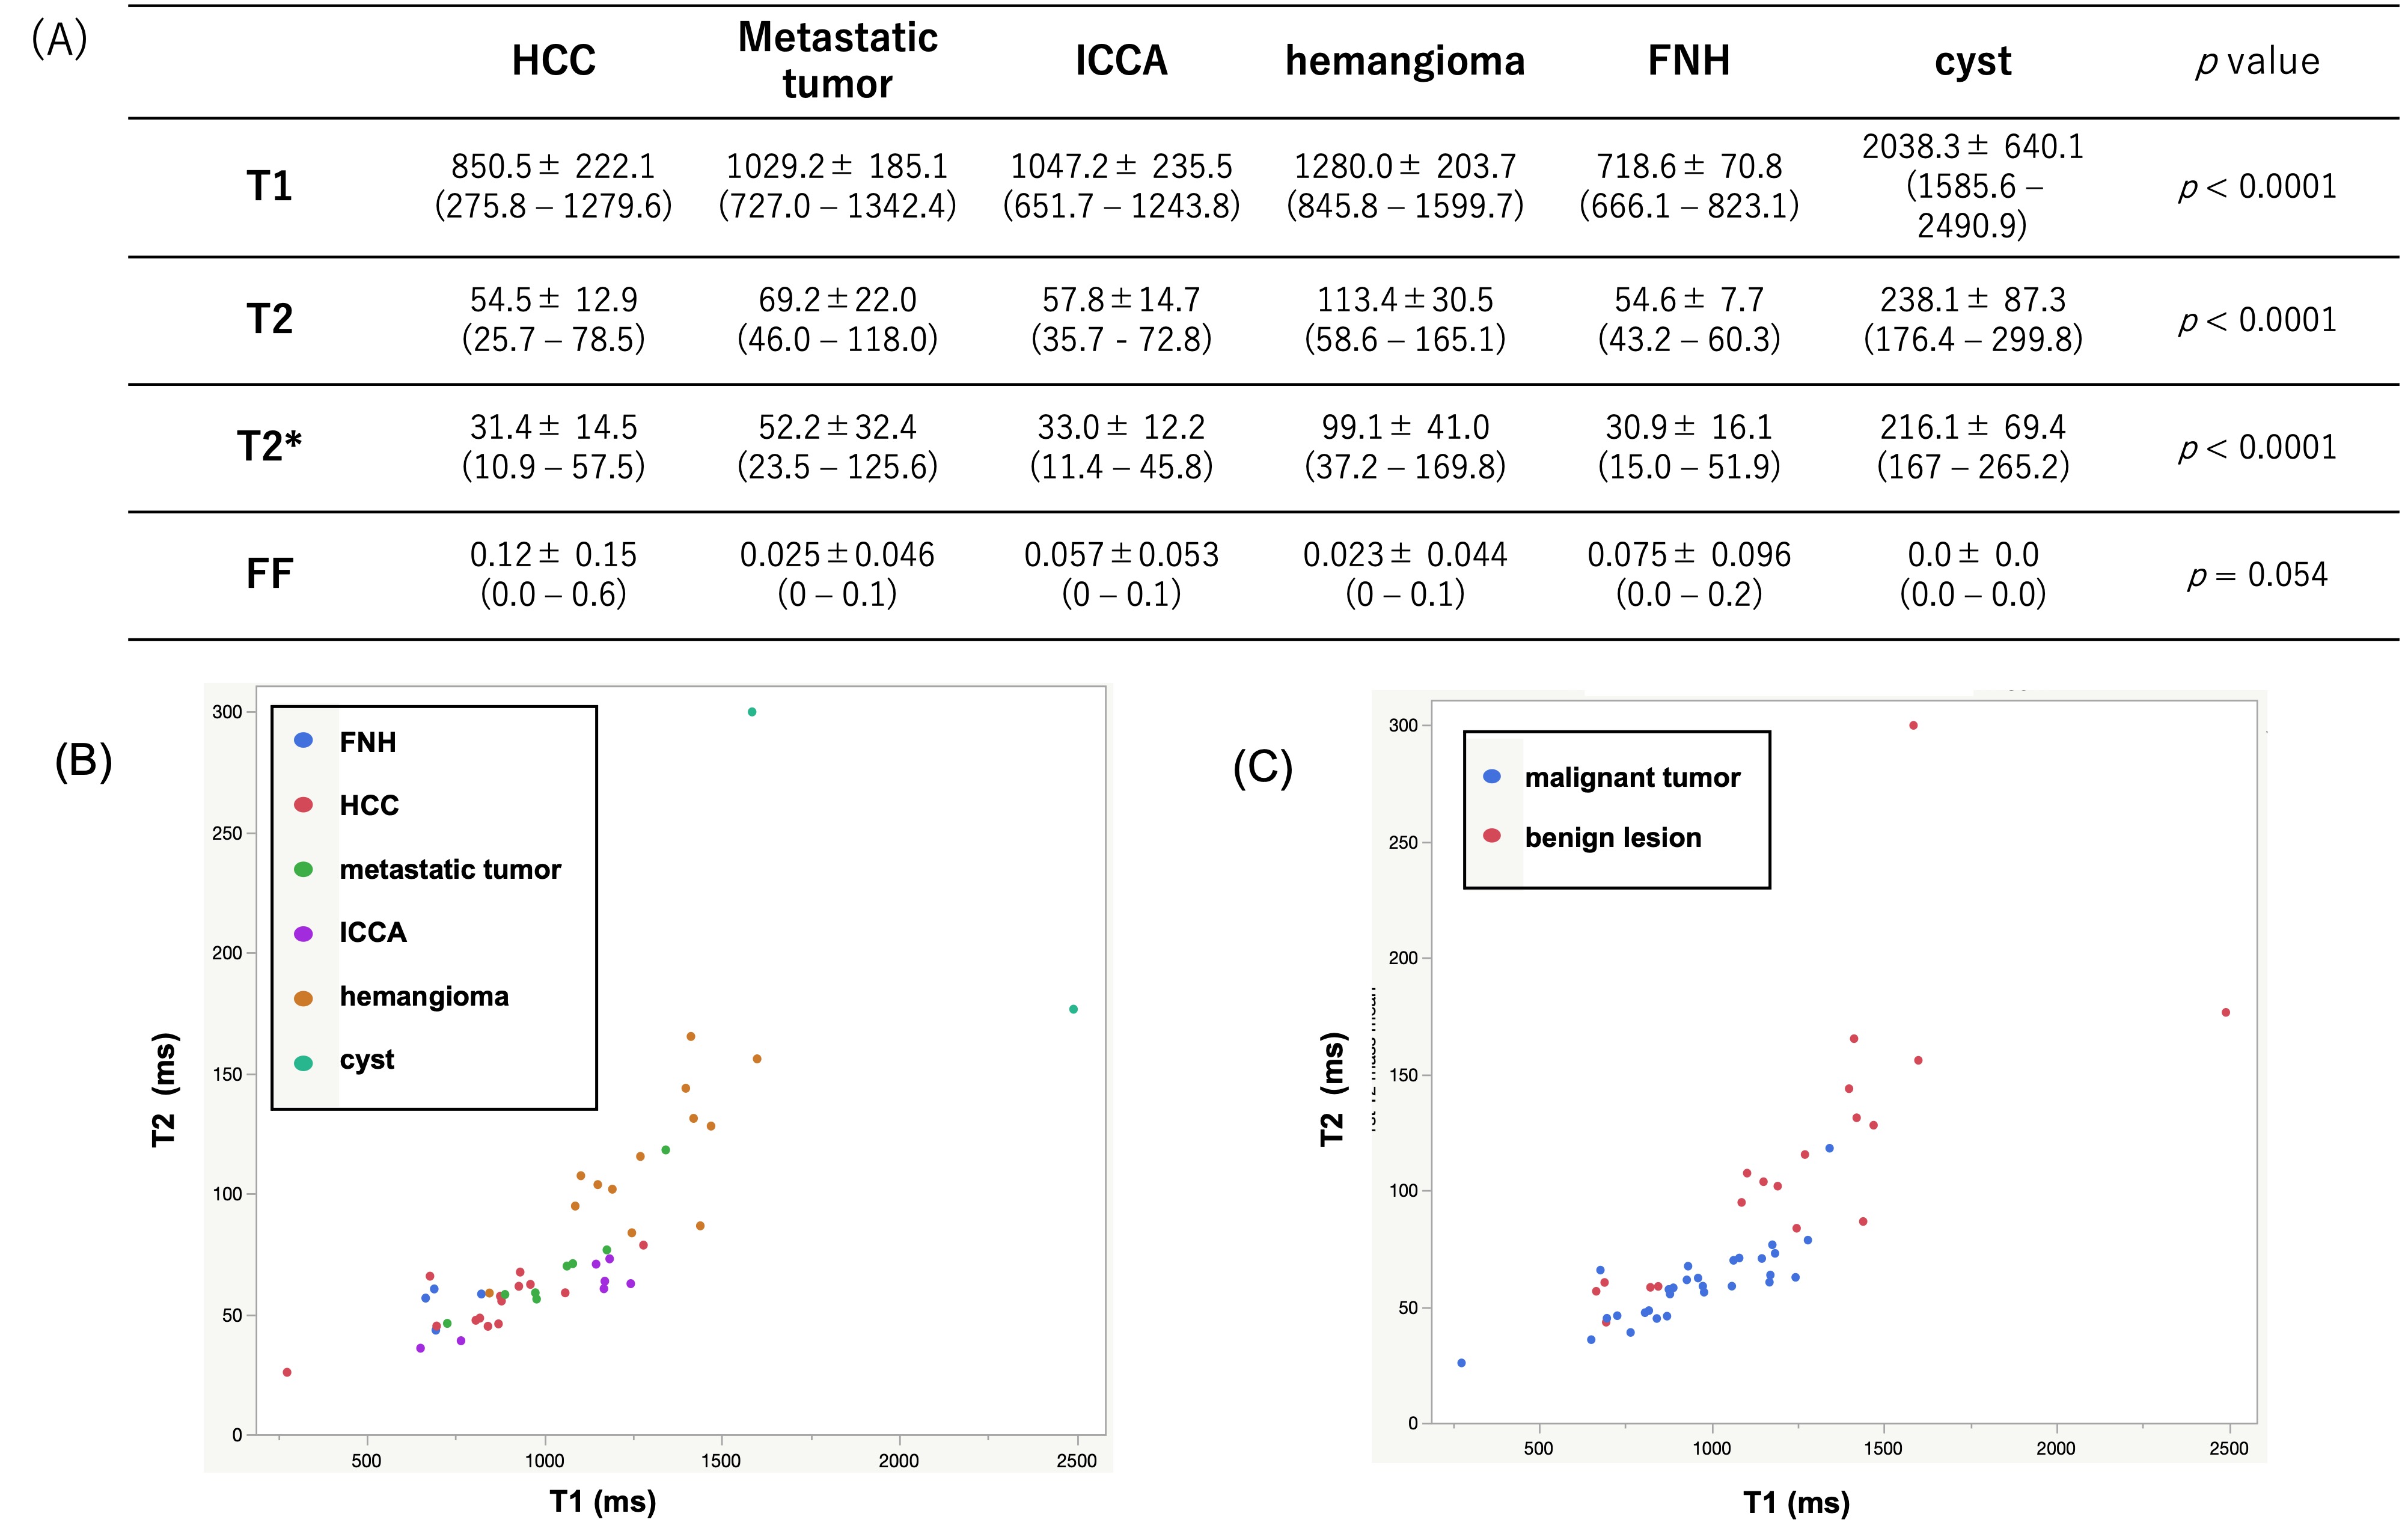
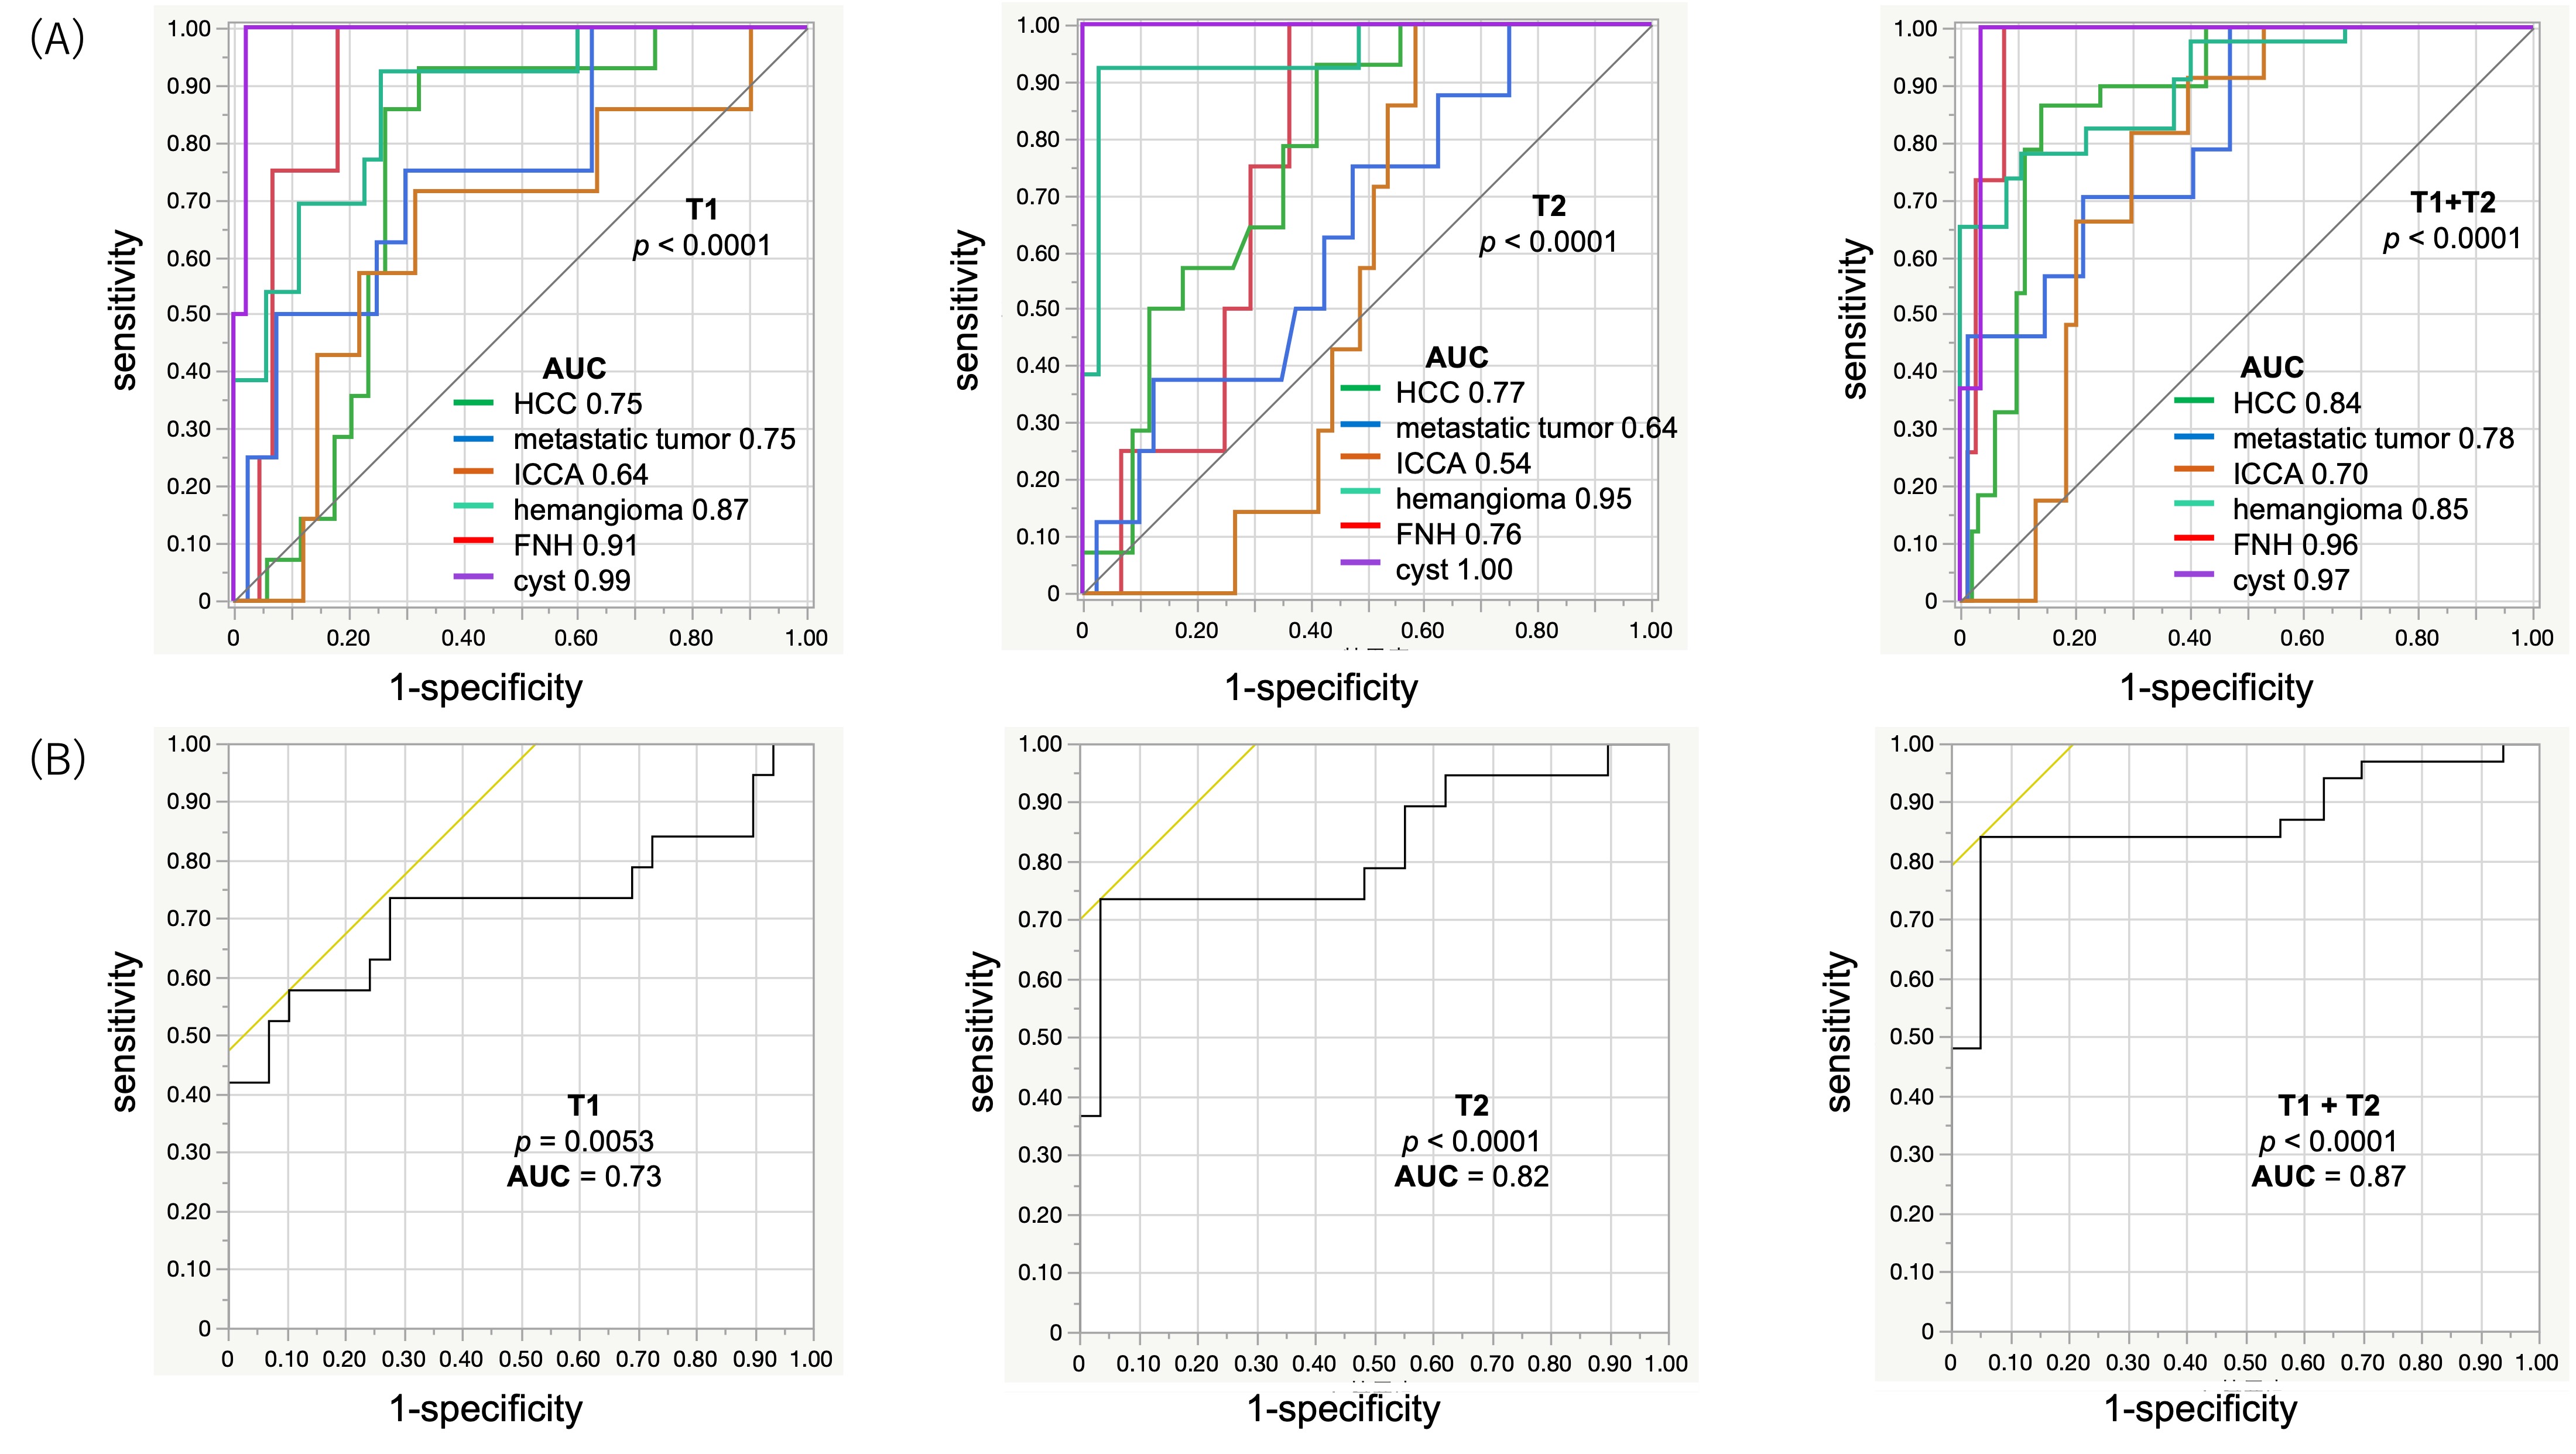
The mean T1, T2, T2*, and FF values for each lesion are shown in Figure 4A. The T2 values with respect to the T1 values were plotted on scatter plots for each lesion (Fig. 4B), benign lesion, and malignant tumor (Fig. 4C). The differentiation of each lesion by T1 and T2 values using ROC analysis is shown in Fig. 5A. The AUC of the differentiation of benign lesions and malignant tumors by T1 and T2 values using ROC analysis is shown in Fig. 5B. The AUC of the combined T1 and T2 values (0.87) was higher than that of the T1 and T2 values alone (0.73 and 0.82, respectively).
Discussion
MRF and standard reference imaging exhibited a good correlation for T1 and T2 relaxation times. This cohort study did not initially include masses with fat or iron deposits, so it is not helpful with respect to T2* or FF. Further accumulation of such cases is required in the future. The ability of MRF parameters to differentiate lesions was improved by combining T1 and T2 values with those of contrast-free MRF.Conclusion
Multiparametric liver MRF provides repeatable T1 and T2 maps with high agreement with measurements of separate conventional quantitative mapping in patients with focal liver lesions. Measurements of liver MRF enabled good differentiation of focal liver lesions. Furthermore, the combination of T1 and T2 values shows a higher diagnostic performance than those of T1 or T2 values alone and can improve the diagnostic performance of liver MRI.Acknowledgements
We thank Wataru Uchida for data handling.References
1. Kanda T, Nakai Y, Oba H, Toyoda K, Kitajima K, Furui S. Gadolinium deposition in the brain. Magn Reson Imaging 2016;34(10):1346-1350.
2. Ma D, Gulani V, Seiberlich N, Liu K, Sunshine JL, Duerk JL, Griswold MA. Magnetic resonance fingerprinting. Nature 2013;495(7440):187-192.
3. Fujita S, Sano K, Cruz G, Fukumura Y, Kawasaki H, Fukunaga I, Morita Y, Yoneyama M, Kamagata K, Abe O, Ikejima K, Botnar RM, Prieto C, Aoki S. MR Fingerprinting for Liver Tissue Characterization: A Histopathologic Correlation Study. Radiology 2022:220736.
4. Jaubert O, Arrieta C, Cruz G, Bustin A, Schneider T, Georgiopoulos G, Masci PG, Sing‐Long C, Botnar RM, Prieto C. Multi‐parametric liver tissue characterization using MR fingerprinting: Simultaneous T <sub>1</sub> , T <sub>2</sub> , T <sub>2</sub> *, and fat fraction mapping. Magnetic Resonance in Medicine 2020;84(5):2625-2635.
5. Farraher SW, Jara H, Chang KJ, Ozonoff A, Soto JA. Differentiation of hepatocellular carcinoma and hepatic metastasis from cysts and hemangiomas with calculated T2 relaxation times and the T1/T2 relaxation times ratio. Journal of Magnetic Resonance Imaging 2006;24(6):1333-1341.
6. Cieszanowski A, Anysz-Grodzicka A, Szeszkowski W, Kaczynski B, Maj E, Gornicka B, Grodzicki M, Grudzinski IP, Stadnik A, Krawczyk M, Rowinski O. Characterization of focal liver lesions using quantitative techniques: comparison of apparent diffusion coefficient values and T2 relaxation times. European Radiology 2012;22(11):2514-2524.
7. Morisaka H, Seno D, Sakurai Y, Sano K, Akamine Y, Ichikawa T, Okada Y. Quantitative analysis of gadoxetic acid-enhanced MRI for the differential diagnosis of focal liver lesions: Comparison between estimated intralesional gadoxetic acid retention by T1 mapping and conventional processing methods. Eur J Radiol 2021;138:109620.
8. Yoshimura N, Saito K, Saguchi T, Funatsu T, Araki Y, Akata S, Tokuuye K. Distinguishing hepatic hemangiomas from metastatic tumors using T1 mapping on gadoxetic-acid-enhanced MRI. Magn Reson Imaging 2013;31(1):23-27.
9. Tomaszewski MR, Dominguez‐Viqueira W, Ortiz A, Shi Y, Costello JR, Enderling H, Rosenberg SA, Gillies RJ. Heterogeneity analysis of MRI T2 maps for measurement of early tumor response to radiotherapy. NMR in Biomedicine 2021;34(3).
10. Jaubert O, Cruz G, Bustin A, Schneider T, Lavin B, Koken P, Hajhosseiny R, Doneva M, Rueckert D, Botnar RM, Prieto C. Water–fat Dixon cardiac magnetic resonance fingerprinting. Magnetic Resonance in Medicine 2020;83(6):2107-2123.
Figures