0790
Preoperative Prediction of CK19 Expression and Early Recurrence of Hepatocellular Carcinoma using T1 mapping on Gadoxetic acid-enhanced MRI1Department of Radiology, Guangzhou First People’s Hospital, Guangzhou, China, 2Philips Healthcare, Guangzhou, China
Synopsis
Keywords: Liver, Liver, Hepatocellular carcinoma; T1 mapping.
Cytokeratin 19 (CK19) is well acknowledged as a progenitor cell marker and tumor stem cell marker that plays an important role in promoting the malignant property of HCC. If the preoperative CK19 expression status in HCC can be accurately predicted noninvasively, it may provide important information for clinical decision-making. T1 mapping is useful for preoperative prediction of CK19 expression and early recurrence of HCC. The clinical-quantitative model combining alpha-fetoprotein and quantitative features showed good performance and robustness in predicting CK19 expression. T1 relaxation time on hepatobiliary phase was an independent predictor of CK19 expression and recurrence-free survival.Introdution
CK19 is well acknowledged as a biliary/progenitor cell marker and tumor stem cell marker that plays an important role in promoting the malignant property of HCC [1]. Compared with patients with CK19-negative HCCs, CK19-positive HCCs are associated with clinical aggressiveness due to more tumor invasion, a higher rate of intrahepatic recurrence, and poorer prognosis after resection and liver transplantation [2, 3]. If the preoperative CK19 expression status in HCC can be accurately predicted noninvasively, it may provide important information for clinical decision-making and interpretation of prognosis.The imaging findings associated with poor prognosis for CK19-positive HCCs have been assessed. For instance, rim arterial phase hyperenhancement (APHE), lower tumor-to-liver ADC ratio, and lower tumor-to-liver signal intensity ratio on hepatobiliary phase (HBP) imaging are significant independent variables for potentially predicting the CK19 expression status [4–6]. In addition, the radiomic score can be used as a reliable imaging biomarker to determine the expression of CK19 [7, 8]; however, the complexity of the process and the poor generalization and resolvability of the model are not conducive to the clinical application [9, 10]. T1 mapping is a non-invasive method for quantitative analysis of T1 values in tissues. Currently, T1 mapping has important applications in the histological grading of liver fibrosis [11, 12], degree of HCC differentiation [13, 14], and microvascular invasion [15]. However, to the best of our knowledge, the quantitative evaluation of CK19 expression in HCC using T1 mapping and the correlation between T1 mapping and the prognosis of HCC after hepatectomy have not been well established. Therefore, the purpose of this study was to preoperatively identify the CK19 expression status of HCC and to assess early recurrence after hepatectomy with T1 mapping on gadoxetic acid-enhanced magnetic resonance imaging (MRI).
Materials and methods
This retrospective study included 158 patients with surgically-proven HCC who underwent preoperative T1 mapping on gadoxetic acid-enhanced MRI from two institutions. Patients from institution I (n = 102) and institution II (n = 56) were assigned to training and test sets, respectively. This retrospective study was approved by the Institutional Ethics Review Board; the patients were exempted from signing informed consent.MRI examinations in all patients from institution I and institution II were performed using a 1.5T (Magnetom Aera; Siemens Healthcare, Erlanger, Germany) and 3.0T (Magnetom Trio A Tim; Siemens Healthcare) MR scanner, respectively.
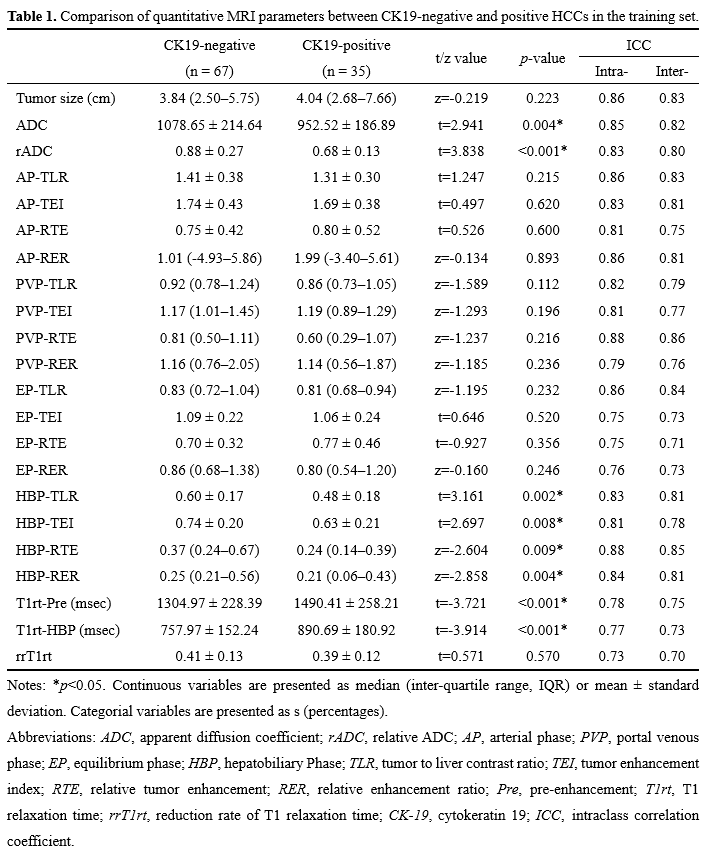
The region of interest (ROI) was placed as far as possible in the area with enhancement in lesions to avoid necrosis, hemorrhage, fat, and artifacts. The area of ROI was approximately 1.0~1.5cm2; the same lesion was measured three times with the same ROI, and then average amounts were calculated. Precontrast and postcontrast T1 relaxation times were measured before and 20 min after the contrast medium administration (recorded as T1rt-Pre and T1rt-HBP, respectively), and the reduction rate of T1 relaxation time (rrT1rt) was calculated. In addition, quantitative parameters also included the tumor-to-liver contrast ratio (TLR), tumor enhancement index (TEI), relative tumor enhancement (RTE), relative enhancement ratio (RER), and tumor-to-liver ADC values (recorded as relative ADC, rADC).
Univariable and multivariable logistic regression analyses were performed to investigate the association of clinicoradiological variables and CK19. Prognostic factors associated with early recurrence after surgical resection were identified using Cox proportional hazard regression analyses. The R software (version 4.1.0) was used for the analysis. All differences were considered statistically significant with a p-value of <0.05.
Results
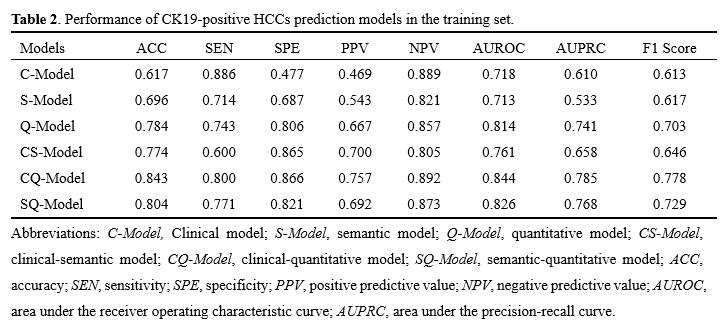
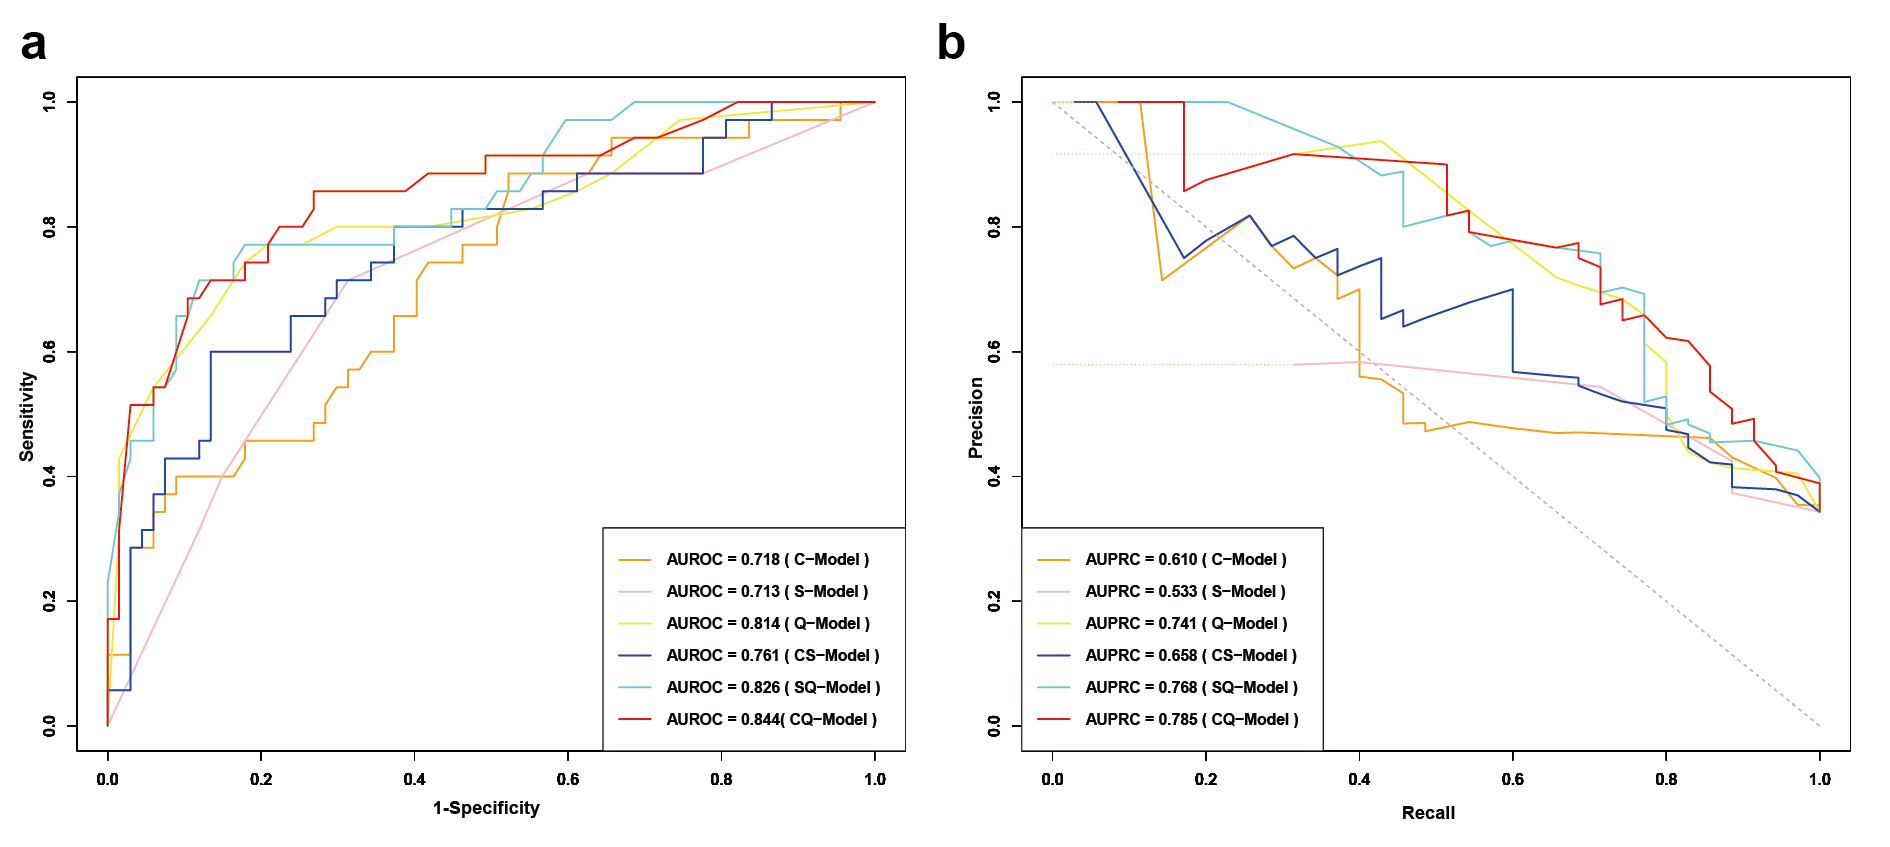
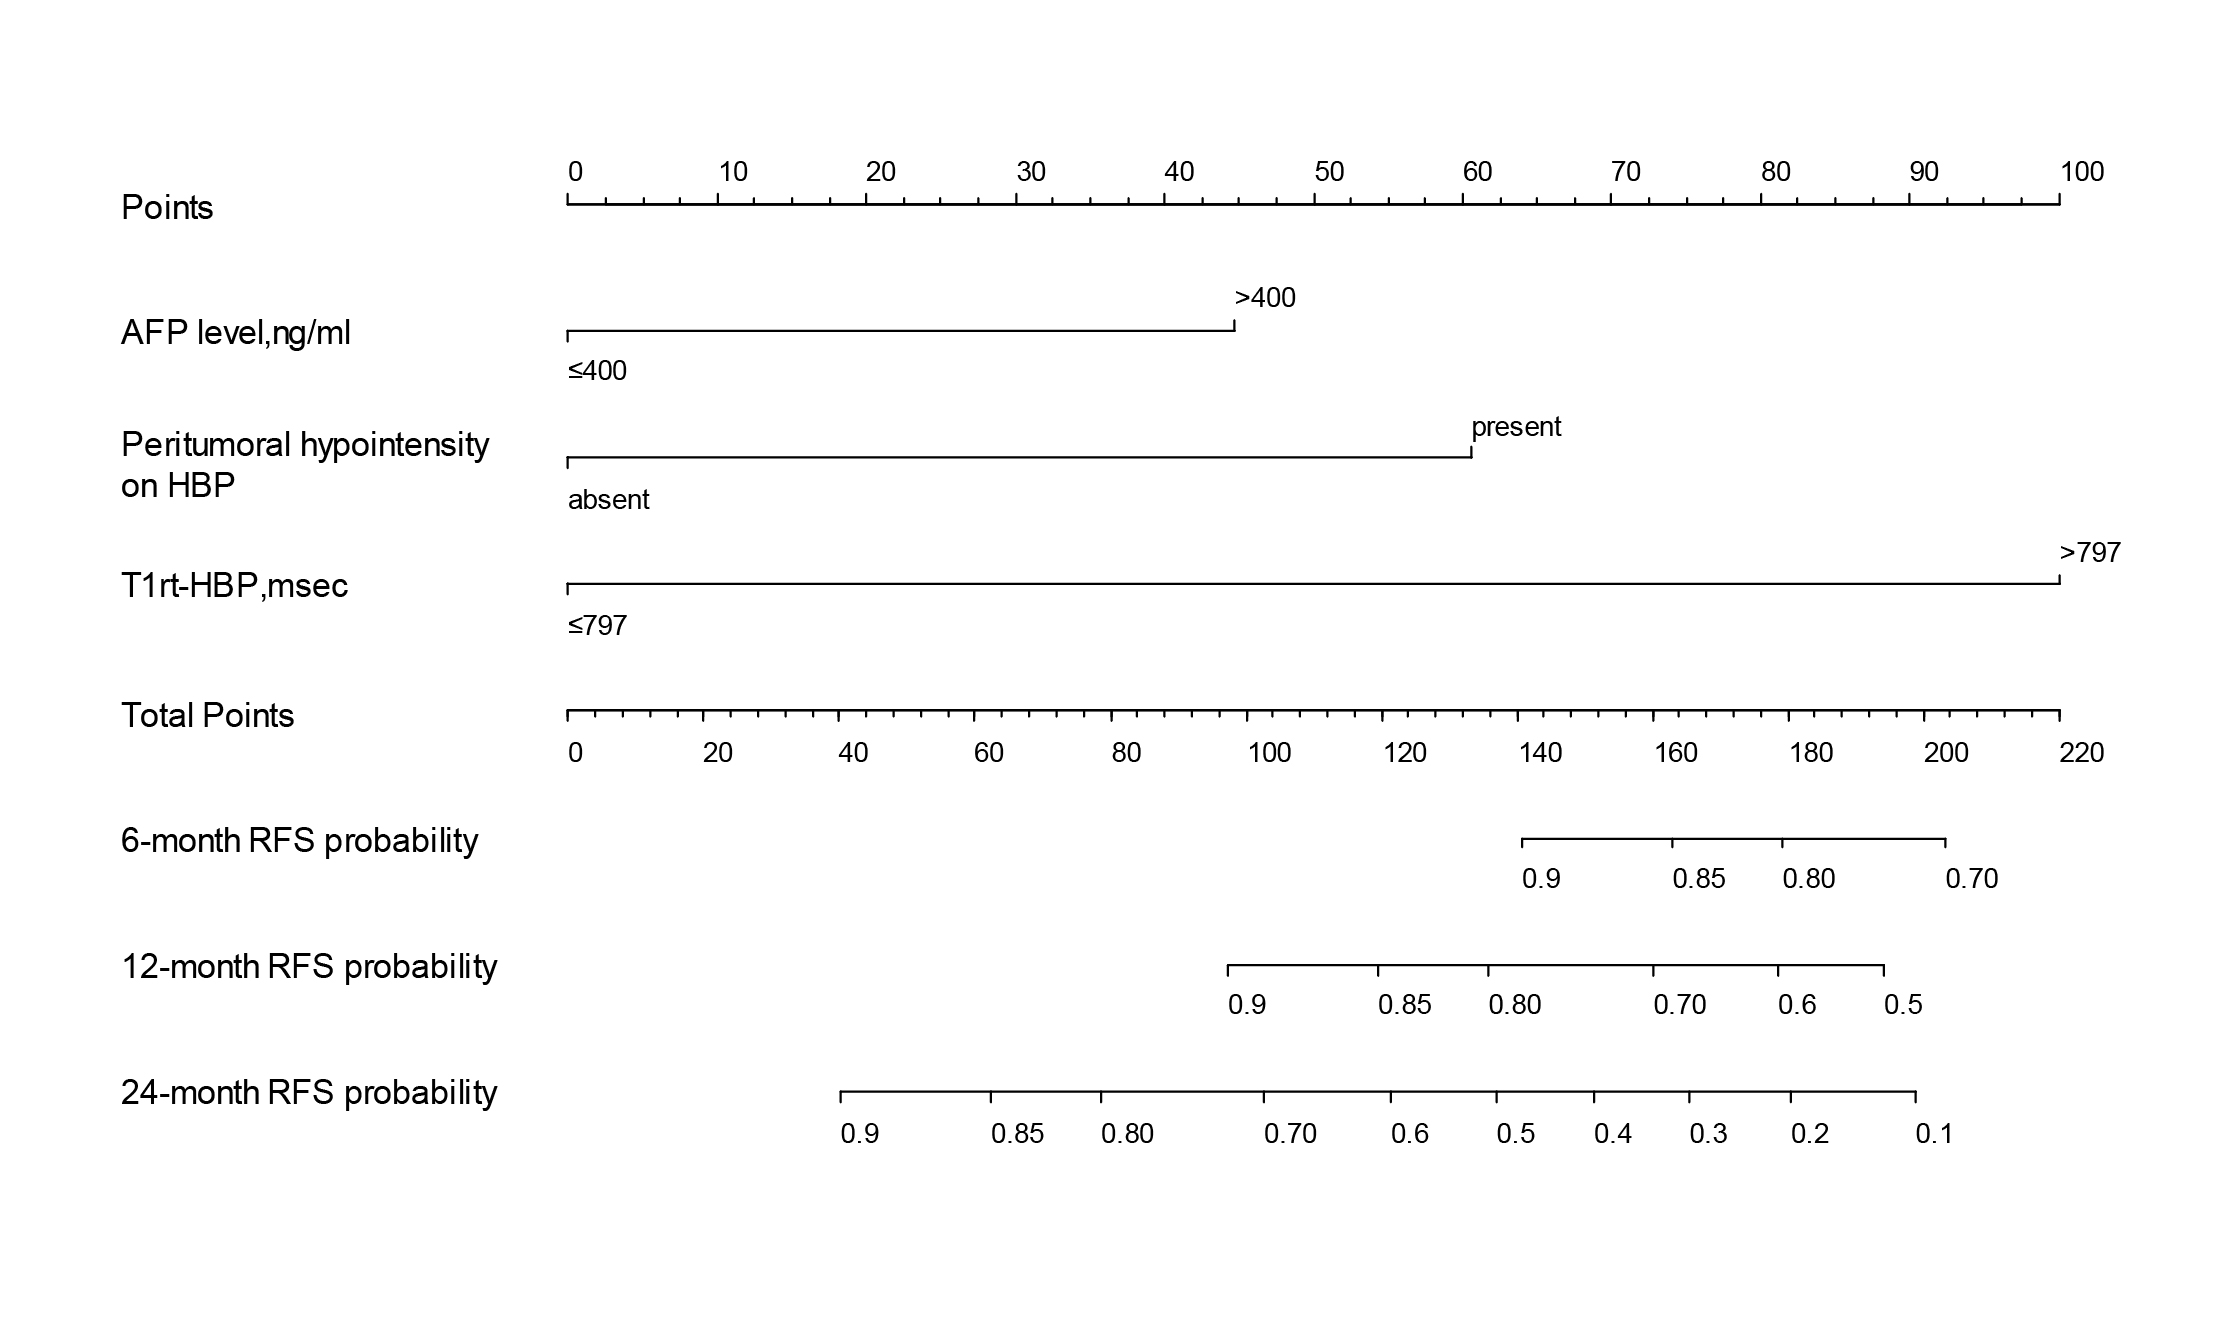
For predicting CK19 expression, multivariable logistic regression analysis showed AFP>400ng/ml (OR=4.607, 95%CI: 1.098-19.326; p=0.037), relative apparent diffusion coefficient (rADC)≤0.71 (OR=3.450, 95%CI: 1.126-10.567; p=0.030), T1 relaxation time in the 20-minute hepatobiliary phase (T1rt-HBP)>797msec (OR=4.509, 95%CI: 1.301-15.626; p=0.018) were significant independent predictors of CK19 expression, and pre-enhanced T1 relaxation time (T1rt-Pre)>1437msec (OR=2.974, 95%CI :0.957-9.235; p=0.059) was marginally significant as a predictor of CK19 expression. The clinical-quantitative model (CQ-Model) constructed based on these significant variables had the best predictive performance with an area under the ROC curve of 0.844, an area under the precision-recall curve of 0.785 and an F1 score of 0.778. The nomogram constructed based on CQ-model demonstrated satisfactory performance with C index of 0.844 (95%CI: 0.759-0.908) and 0.818 (95%CI: 0.693-0.902) in the training and test sets, respectively.For predicting early recurrence of HCC, multivariable Cox analysis showed AFP>400ng/ml (HR:2.32, 95%CI: 1.07-5.06; p=0.034), peritumoral hypointensity on hepatobiliary phase (HR:2.69, 95%CI: 1.31-5.54; p=0.007) and T1rt-HBP>797msec (HR:6.15, 95%CI: 1.42-26.50; p=0.015) were independent risk factors for early recurrence. Based on the independent risk factors of early recurrence, a nomogram was developed to predict 6-month, 12-month, and 24-month recurrence-free survival probabilities for HCC patients, and the C index was 0.757 (95%CI: 0.686-0.828) and 0.685 (95%CI: 0.568-0.773) in the training and test sets, respectively.
Conclusion
T1 mapping based on gadoxetic acid-enhanced MRI exhibits good predictive efficacy for preoperative prediction of CK19 expression and early recurrence of HCC, which can improve individualized risk stratification and further treatment decisions of HCC patients.Acknowledgements
We gratefully acknowledge all the members of Department of Radiology, Guangzhou First People’s Hospital, for continuous assistance.References
[1] Rhee H, Kim H, Park YN (2020) Clinico-Radio-Pathological and Molecular Features of Hepatocellular Carcinomas with Keratin 19 Expression. Liver Cancer 9:663–681. https://doi.org/10.1159/000510522
[2] Fatourou E, Koskinas J, Karandrea D, et al (2015) Keratin 19 protein expression is an independent predictor of survival in human hepatocellular carcinoma: European Journal of Gastroenterology & Hepatology 27:1094–1102. https://doi.org/10.1097/MEG.0000000000000398
[3] Lee S-H, Lee J-S, Na G-H, et al (2017) Immunohistochemical markers for hepatocellular carcinoma prognosis after liver resection and liver transplantation. Clin Transplant 31:e12852. https://doi.org/10.1111/ctr.12852
[4] Choi S-Y, Kim SH, Park CK, et al (2018) Imaging Features of Gadoxetic Acid–enhanced and Diffusion-weighted MR Imaging for Identifying Cytokeratin 19-positive Hepatocellular Carcinoma: A Retrospective Observational Study. Radiology 286:897–908. https://doi.org/10.1148/radiol.2017162846
[5] Hu X-X, Wang W-T, Yang L, et al (2019) MR features based on LI-RADS identify cytokeratin 19 status of hepatocellular carcinomas. European Journal of Radiology 113:7–14. https://doi.org/10.1016/j.ejrad.2019.01.036
[6] Wang H, Yang C, Zeng M, et al (2019) Magnetic resonance texture analysis for the identification of cytokeratin 19-positive hepatocellular carcinoma. European Journal of Radiology 117:164–170. https://doi.org/10.1016/j.ejrad.2019.06.016
[7] Chen Y, Chen J, Zhang Y, et al (2021) Preoperative Prediction of Cytokeratin 19 Expression for Hepatocellular Carcinoma with Deep Learning Radiomics Based on Gadoxetic Acid-Enhanced Magnetic Resonance Imaging. JHC Volume 8:795–808. https://doi.org/10.2147/JHC.S313879
[8] Wang W, Gu D, Wei J, et al (2020) A radiomics-based biomarker for cytokeratin 19 status of hepatocellular carcinoma with gadoxetic acid–enhanced MRI. Eur Radiol 30:3004–3014. https://doi.org/10.1007/s00330-019-06585-y
[9] Hosny A, Parmar C, Quackenbush J, et al (2018) Artificial intelligence in radiology. Nat Rev Cancer 18:500–510. https://doi.org/10.1038/s41568-018-0016-5
[10] Yasaka K, Akai H, Kunimatsu A, et al (2018) Deep learning with convolutional neural network in radiology. Jpn J Radiol 36:257–272. https://doi.org/10.1007/s11604-018-0726-3
[11] Li J, Liu H, Zhang C, et al (2020) Native T1 mapping compared to ultrasound elastography for staging and monitoring liver fibrosis: an animal study of repeatability, reproducibility, and accuracy. Eur Radiol 30:337–345. https://doi.org/10.1007/s00330-019-06335-0
[12] Luetkens JA, Klein S, Träber F, et al (2018) Quantification of Liver Fibrosis at T1 and T2 Mapping with Extracellular Volume Fraction MRI: Preclinical Results. Radiology 288:748–754. https://doi.org/10.1148/radiol.2018180051
[13] Peng Z, Jiang M, Cai H, et al (2016) Gd-EOB-DTPA-enhanced magnetic resonance imaging combined with T1 mapping predicts the degree of differentiation in hepatocellular carcinoma. BMC Cancer 16:625. https://doi.org/10.1186/s12885-016-2607-4
[14] Qin X, Yang T, Huang Z, et al (2019) Hepatocellular carcinoma grading and recurrence prediction using T1 mapping on gadolinium‑ethoxybenzyl diethylenetriamine pentaacetic acid‑enhanced magnetic resonance imaging. Oncol Lett. https://doi.org/10.3892/ol.2019.10557
[15] Rao C, Wang X, Li M, et al (2020) Value of T1 mapping on gadoxetic acid-enhanced MRI for microvascular invasion of hepatocellular carcinoma: a retrospective study. BMC Med Imaging 20:43. https://doi.org/10.1186/s12880-020-00433-y
Figures