0788
Cerebral Amyloid Angiopathy (CAA) is associated with gray matter R2 relaxation rate: An ex-vivo MRI and pathology study1Biomedical Engineering, Illinois Institute of Technology, Chicago, IL, United States, 2Rush Alzheimer's Disease Center, Rush University Medical Center, Chicago, IL, United States
Synopsis
Keywords: Blood vessels, Aging, Alzheimer’s disease, Dementia, Ex-vivo applications
Cerebral amyloid angiopathy (CAA) is characterized by accumulation of amyloid-β protein in the walls of cortical and leptomeningeal small vessels. CAA is common in older adults and is associated with intracerebral hemorrhage, microbleeds, cognitive decline and dementia. The present study in a large number of community-based older adults (N=802) combined ex-vivo MRI and detailed neuropathology and showed for the first time that CAA is associated with higher transverse relaxation rate, R2, in gray matter, independent of other neuropathologies and demographics. The regions that showed this association included cortical regions in the temporal and frontal lobes as well as subcortical structures.INTRODUCTION
Cerebral amyloid angiopathy (CAA) is characterized by accumulation of amyloid-β (Aβ) protein in the walls of cortical and leptomeningeal small vessels1. CAA is common in older adults and is often comorbid with Alzheimer’s disease (AD). It has been linked to intracerebral hemorrhage, microbleeds, microinfarcts, cortical superficial siderosis2-4, and has been associated with cognitive decline and dementia5-7. Unfortunately, despite its prevalence and deleterious effects, definitive diagnosis of CAA can only be conducted at autopsy. To date, the association of CAA with the transverse relaxation rate8,9, R2, in gray matter remains unknown. Therefore, the aim of this study was to investigate the association of CAA with R2 values in cortical and subcortical gray matter from a large number of community-based older adults.METHODS
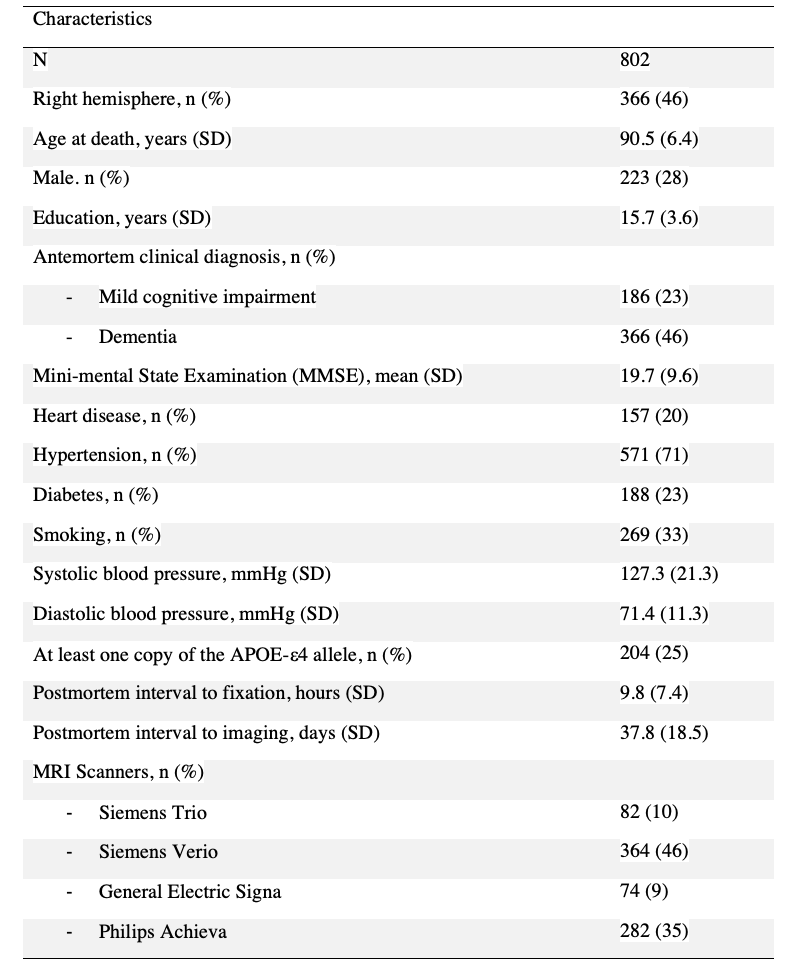
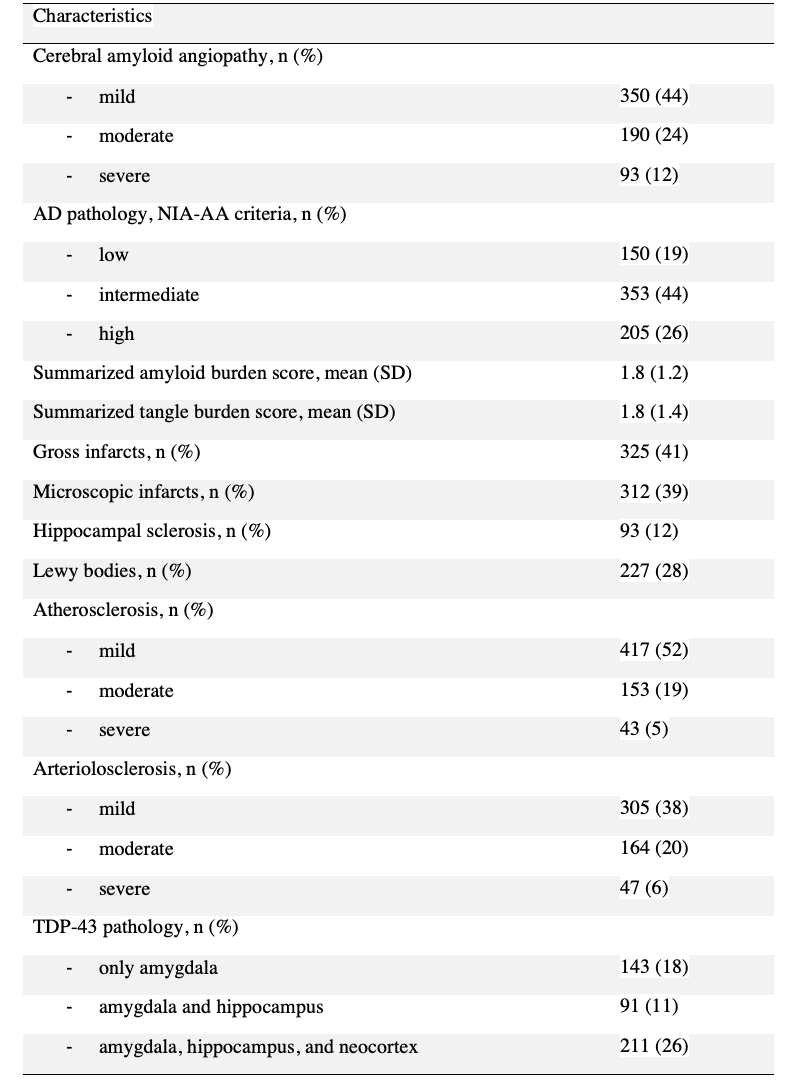
Cerebral hemispheres from 802 older adults participating in five cohort studies of aging10,11, the Rush Memory and Aging Project, the Minority Aging Research Study, the Religious Orders Study, the Clinical Core and Latino Core of the Rush Alzheimer’s Disease Research Center (ADRC) (Table 1) were included in this work. All hemispheres were imaged ex-vivo at room temperature, while immersed in phosphate-buffered 4% formaldehyde solution at approximately 30 days postmortem using 3T clinical MRI scanners8,9. R2 maps were generated from multi-echo spin-echo data. Gray matter was segmented into 34 cortical and 8 subcortical regions using a multi-atlas segmentation approach12. Median R2 values were obtained from each region and each participant.Following ex-vivo MRI, all hemispheres underwent detailed neuropathologic assessment (Table 2). CAA pathology was assessed in meningeal and parenchymal vessels from four neocortical regions using immunostaining: middle frontal, middle temporal, inferior parietal and calcarine cortices13, and regional CAA scores were combined into a measure representing global CAA pathology. Other pathologies that were assessed included: Aβ plaques, neurofibrillary tangles14, gross infarcts, microscopic infarcts, limbic-predominant age-related TDP-43 encephalopathy neuropathological change (LATE-NC), hippocampal sclerosis (HS), Lewy bodies, atherosclerosis, and arteriolosclerosis.
Multiple linear regression was conducted in each segmented gray matter region separately to test the association of the corresponding median R2 value with the global CAA score, controlling for all other neuropathologies, age at death, sex, years of education, postmortem interval to fixation and to imaging, and scanner. False discovery rate (FDR) was used to correct for multiple comparisons. Statistical significance was set at p<0.05.
RESULTS
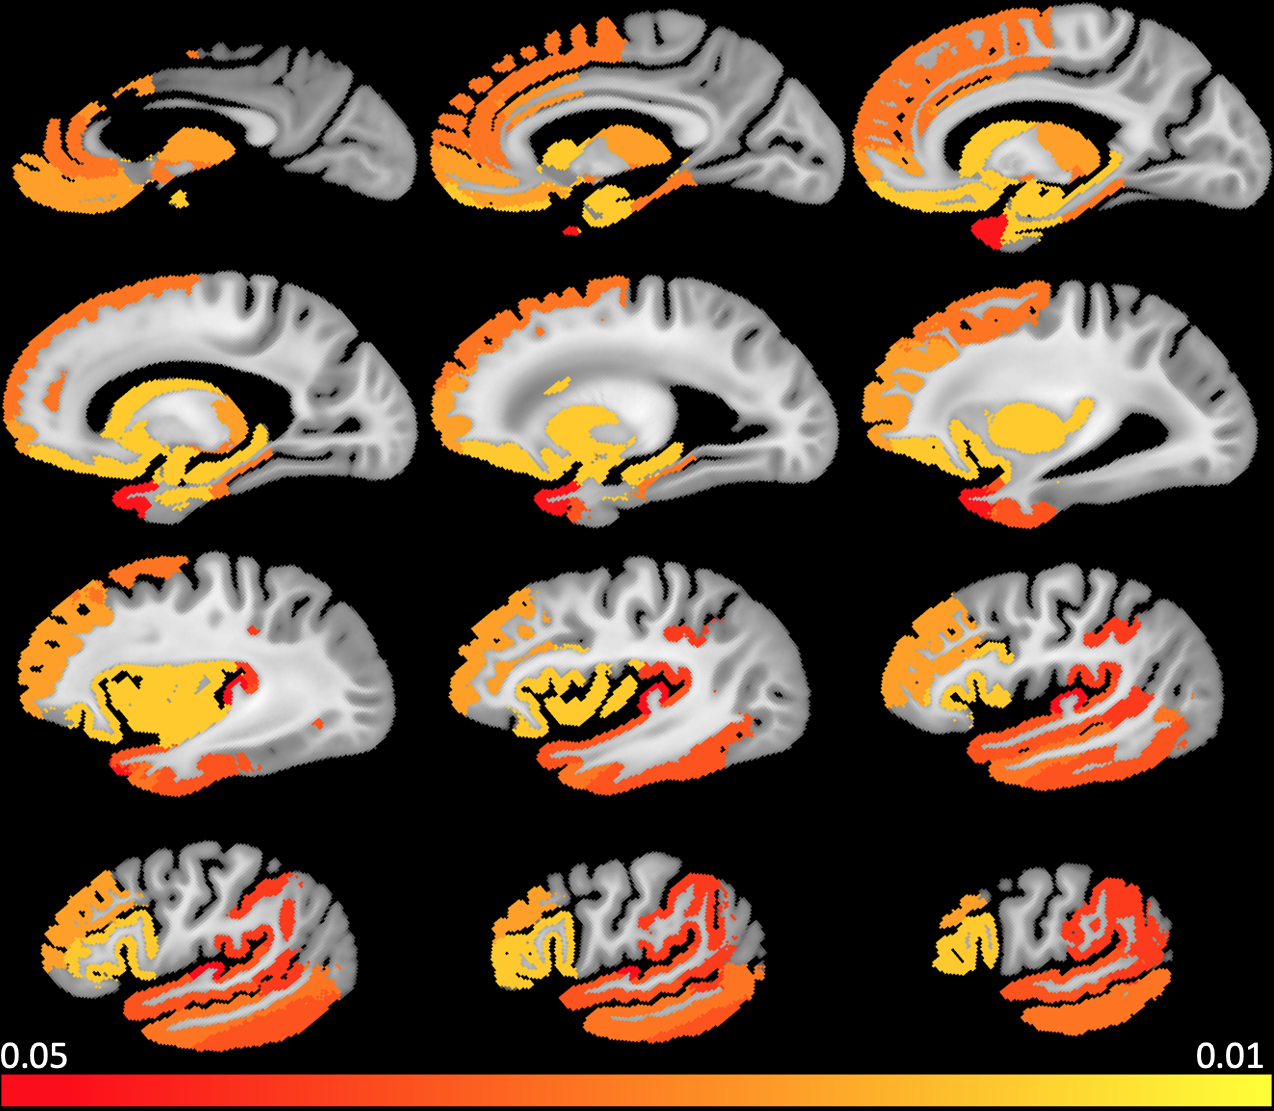
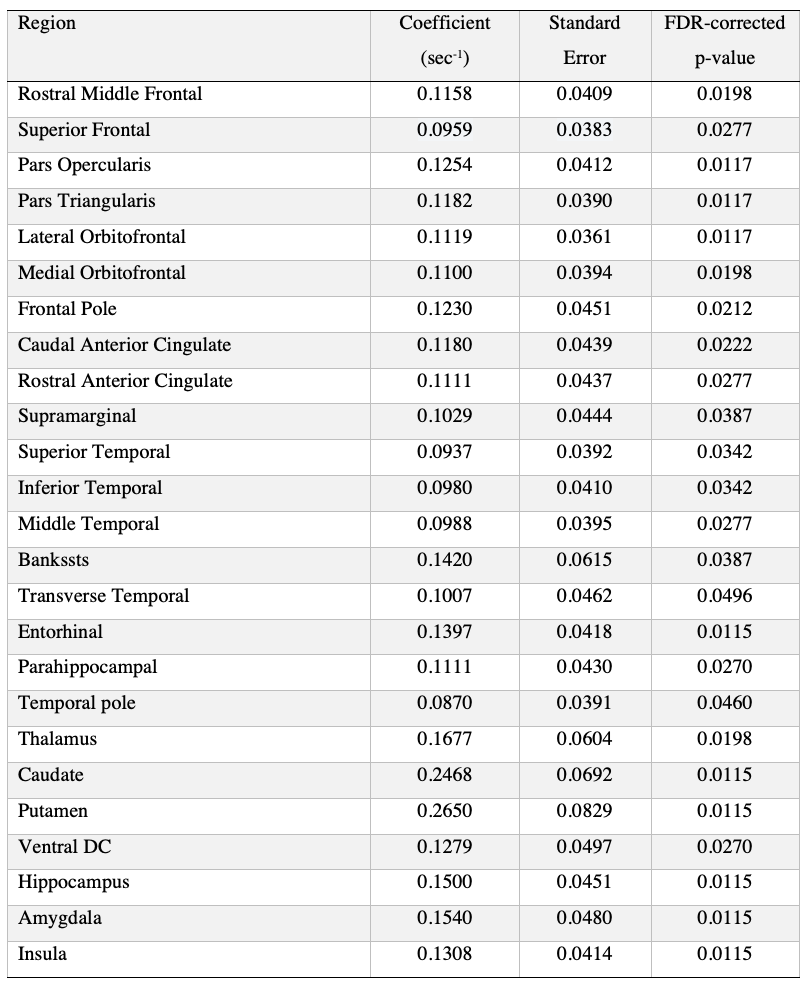
A significant positive association of median R2 with CAA pathology was found in several cortical regions of the temporal and frontal lobes as well as in subcortical structures (Figure. 1). These regions are listed in Table 3. No gray matter region showed lower median R2 for higher CAA score. Furthermore, we obtained similar findings when also controlling in the linear regression models for normalized regional volume and for clinical variables such as history of hypertension, diabetes, smoking, blood pressure levels, and the presence of the APOE ε4 allele.DISCUSSION
This is the first study of the association of CAA with regional gray mater R2 in a large number of community-based older adults. We showed that CAA is associated with regional R2 elongation, and that this association is independent of other neuropathologies and demographics. The finding of R2 lengthening (T2 shortening) with CAA burden suggests a possible accumulation of iron15. CAA has indeed been linked to elevated iron levels in the cortex and cerebrospinal fluid16,17, and a linear relation of iron content with R2 values in gray matter has previously been shown18,19. Future work will focus on unraveling the neurochemical and biologic mechanisms supporting our findings. Finally, although MRI was conducted ex-vivo, we expect the results to translate well to in-vivo, since we have previously shown that a linear relationship exists between ex-vivo and in-vivo R2 for the same methodology as that used in the present work8.CONCLUSION
This investigation combined ex-vivo MRI and detailed neuropathology in a large number of community-based older adults and showed that CAA is associated with elongated transverse relaxation rate in cortical regions of the temporal and frontal lobes as well as in subcortical structures. This relation was independent of other neuropathologies and demographics. Future work will evaluate if regional R2 measurements can enhance the performance of the Boston criteria 2.0 for in-vivo diagnosis of CAA20.Acknowledgements
National Institute of Neurological Disorders and Stroke (NINDS) UH2-UH3NS100599
National Institute of Neurological Disorders and Stroke (NINDS) UF1NS100599
National Institute on Aging (NIA) R01AG064233
National Institute on Aging (NIA) R01AG067482
National Institute on Aging (NIA) R01AG017917
National Institute on Aging (NIA) R01AG015819
National Institute on Aging (NIA) RF1AG022018
National Institute on Aging (NIA) R01AG056405
National Institute on Aging (NIA) R01AG052200
National Institute on Aging (NIA) P30AG010161
National Institute on Aging (NIA) P30AG072975
References
1. Vinters HV. Cerebral amyloid angiopathy. A critical review. Stroke. 1987;18(2):311–324.
2. Greenberg SM, Al-Shahi Salman R, Biessels GJ, et al. Outcome markers for clinical trials in cerebral amyloid angiopathy. Lancet Neurol. 2014;13(4):419–428.
3. Chao CP, Kotsenas AL and Broderick DF. Cerebral Amyloid Angiopathy: CT and MR Imaging Findings. Radiographics. 2006;26(5):1517–1531.
4. van Veluw SJ, Charidimou A, van der Kouwe AJ, et al. Microbleed and microinfarct detection in amyloid angiopathy: a high-resolution MRI-histopathology study. Brain. 2016; 139(Pt 12):3151–3162.
5. Boyle PA, Yu L, Nag S, et al. Cerebral amyloid angiopathy and cognitive outcomes in community-based older persons. Neurol. 2015;85(22):1930–1936.
6. Kalaria RN, and Ballard C. Overlap between pathology of Alzheimer disease and vascular dementia. Alzheimer Dis Assoc Disord. 1999;13 Suppl 3:S115–S123.
7. Arvanitakis Z, Leurgans SE, Wang Z, et al. Cerebral amyloid angiopathy pathology and cognitive domains in older persons. Ann Neurol. 2011;69(2):320–327.
8. Dawe RJ, Bennett DA, Schneider JA, et al. Ex vivo T2 relaxation: Associations with age-related neuropathology and cognition. Neurobiol Aging. 2014;35:1549–1561.
9. Yu L, Dawe RJ, Buchman AS, et al. Ex vivo MRI transverse relaxation in community based older persons with and without Alzheimer’s dementia. Behav Brain Res. 2017;322:233–240.
10. Barnes LL, Shah RC, Aggarwal NT, et al. The Minority Aging Research Study: Ongoing Efforts to Obtain Brain Donation in African Americans without Dementia. Curr Alzheimer Res. 2013;9:734–745.
11. Bennett DA, Buchman AS, Boyle PA, et al. Religious Orders Study and Rush Memory and Aging Project. J Alzheimer’s Dis. 2018;64:S161–S189.
12. Kotrotsou A, Bennett DA, Schneider JA, et al. Ex vivo MR volumetry of human brain hemispheres. Magn Reson Med. 2014;71(1):364-374.
13. Boyle PA, Yu L, Nag S, et al. Cerebral amyloid angiopathy and cognitive outcomes in community-based older persons. Neurology. 2015;85(22):1930-1936.
14. Wilson RS, Arnold SE, Schneider JA, Tang Y, Bennett DA. The relationship between cerebral Alzheimer's disease pathology and odour identification in old age. J Neurol Neurosurg Psychiatry. 2007;78(1):30-35.
15. Drayer B, Burger P, Darwin R, Riederer S, Herfkens R, Johnson GA. MRI of brain iron. AJR Am J Roentgenol. 1986;147(1):103-110.
16. Schrag M, Crofton A, Zabel M, et al. Effect of cerebral amyloid angiopathy on brain iron, copper, and zinc in Alzheimer's disease. J Alzheimers Dis. 2011;24(1):137-149.
17. Banerjee G, Forsgard N, Ambler G, et al. Cerebrospinal fluid metallomics in cerebral amyloid angiopathy: an exploratory analysis. J Neurol. 2022;269(3):1470-1475.
18. House MJ, St Pierre TG, Kowdley KV, et al. Correlation of proton transverse relaxation rates (R2) with iron concentrations in postmortem brain tissue from alzheimer's disease patients. Magn Reson Med. 2007;57(1):172-180.
19. Langkammer C, Krebs N, Goessler W, et al. Quantitative MR imaging of brain iron: a postmortem validation study [published correction appears in Radiology. 2011 Mar;258(3):962]. Radiology. 2010;257(2):455-462.
20. Charidimou A, Boulouis G, Frosch MP, et al. The Boston criteria version 2.0 for cerebral amyloid angiopathy: a multicentre, retrospective, MRI-neuropathology diagnostic accuracy study. Lancet Neurol. 2022;21(8):714-725.
Figures