0785
Effects of Aquaporin-4 Inhibition on Relative Cerebrovascular Reactivity using Resting-state Functional MRI1Ophthalmology, New York University Grossman School of Medicine, New York, NY, United States, 2Radiology, New York University Grossman School of Medicine, New York, NY, United States
Synopsis
Keywords: Blood vessels, fMRI (resting state), Cerebrovscular reactivity
Aquaporin-4 (AQP4) is most abundant water channel responsible for cerebrospinal fluid influx in the brain, and has important bearings on cerebrovascular diseases. However, it remains unclear how aquaporin-4 functions in the cerebrovasculature. We used relative cerebrovascular reactivity (rCVR) mapping derived from task-free, resting-state blood-oxygenation-level-dependent functional MRI to determine the effects of AQP4 suppression on the healthy mouse brains using the AQP4 inhibitor TGN020. We observed different patterns of rCVR responses across cortical and subcortical brain regions, indicating the heterogeneity of AQP4 functions in the cerebrovasculature, which may explain the varying vulnerability of different brain regions to cerebrovascular diseases.INTRODUCTION
Vascular pulsation is a major driver of cerebrospinal fluid (CSF) dynamics1-3. Hence, cerebrovascular reactivity and CSF dynamics may play complementary roles and shared mechanisms in brain homeostasis and cerebrovascular diseases4. Recent studies have demonstrated increased amyloid-β production with concomitant decrease in cerebral blood flow. Amyloid-β accumulation can also be a feature of glymphatic dysfunction. However, the role of impaired glymphatic clearance in cerebrovascular diseases remains unclear. Since glymphatic brain waste clearance depends on the functions of the aquaporin-4 (AQP4) water channel, in this study, we performed relative cerebrovascular reactivity (rCVR) mapping without gas challenge in healthy adult mice before, during and after inhibition of the AQP4 function using TGN020. Such an approach would allow for the understanding of the role AQP4 water channels in different brain regions and hence their susceptibility to cerebrovascular diseases in relation to glymphatic impairments.METHODS AND MATERIALS
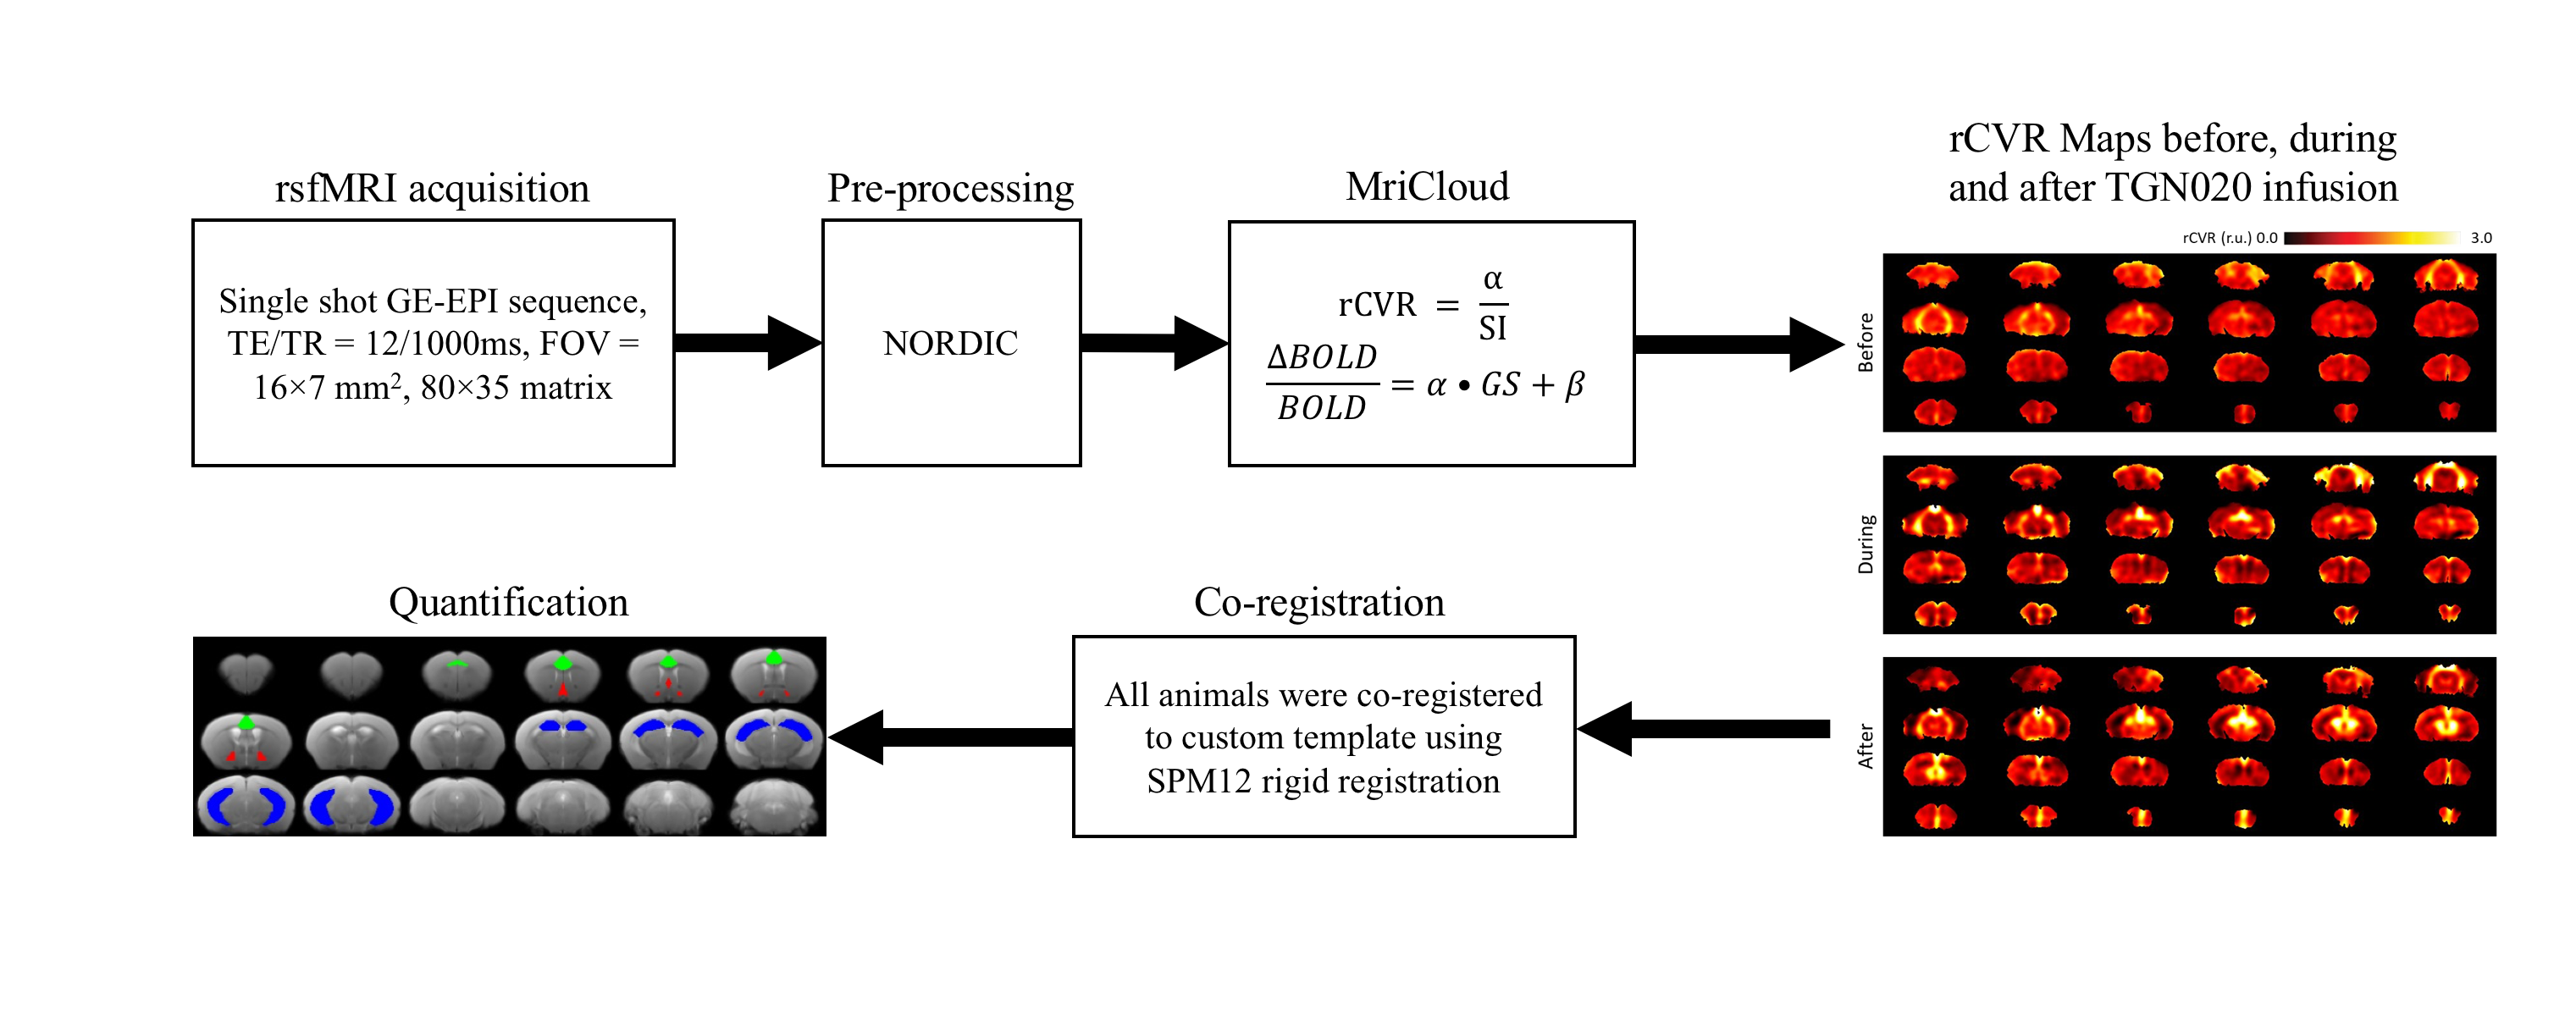
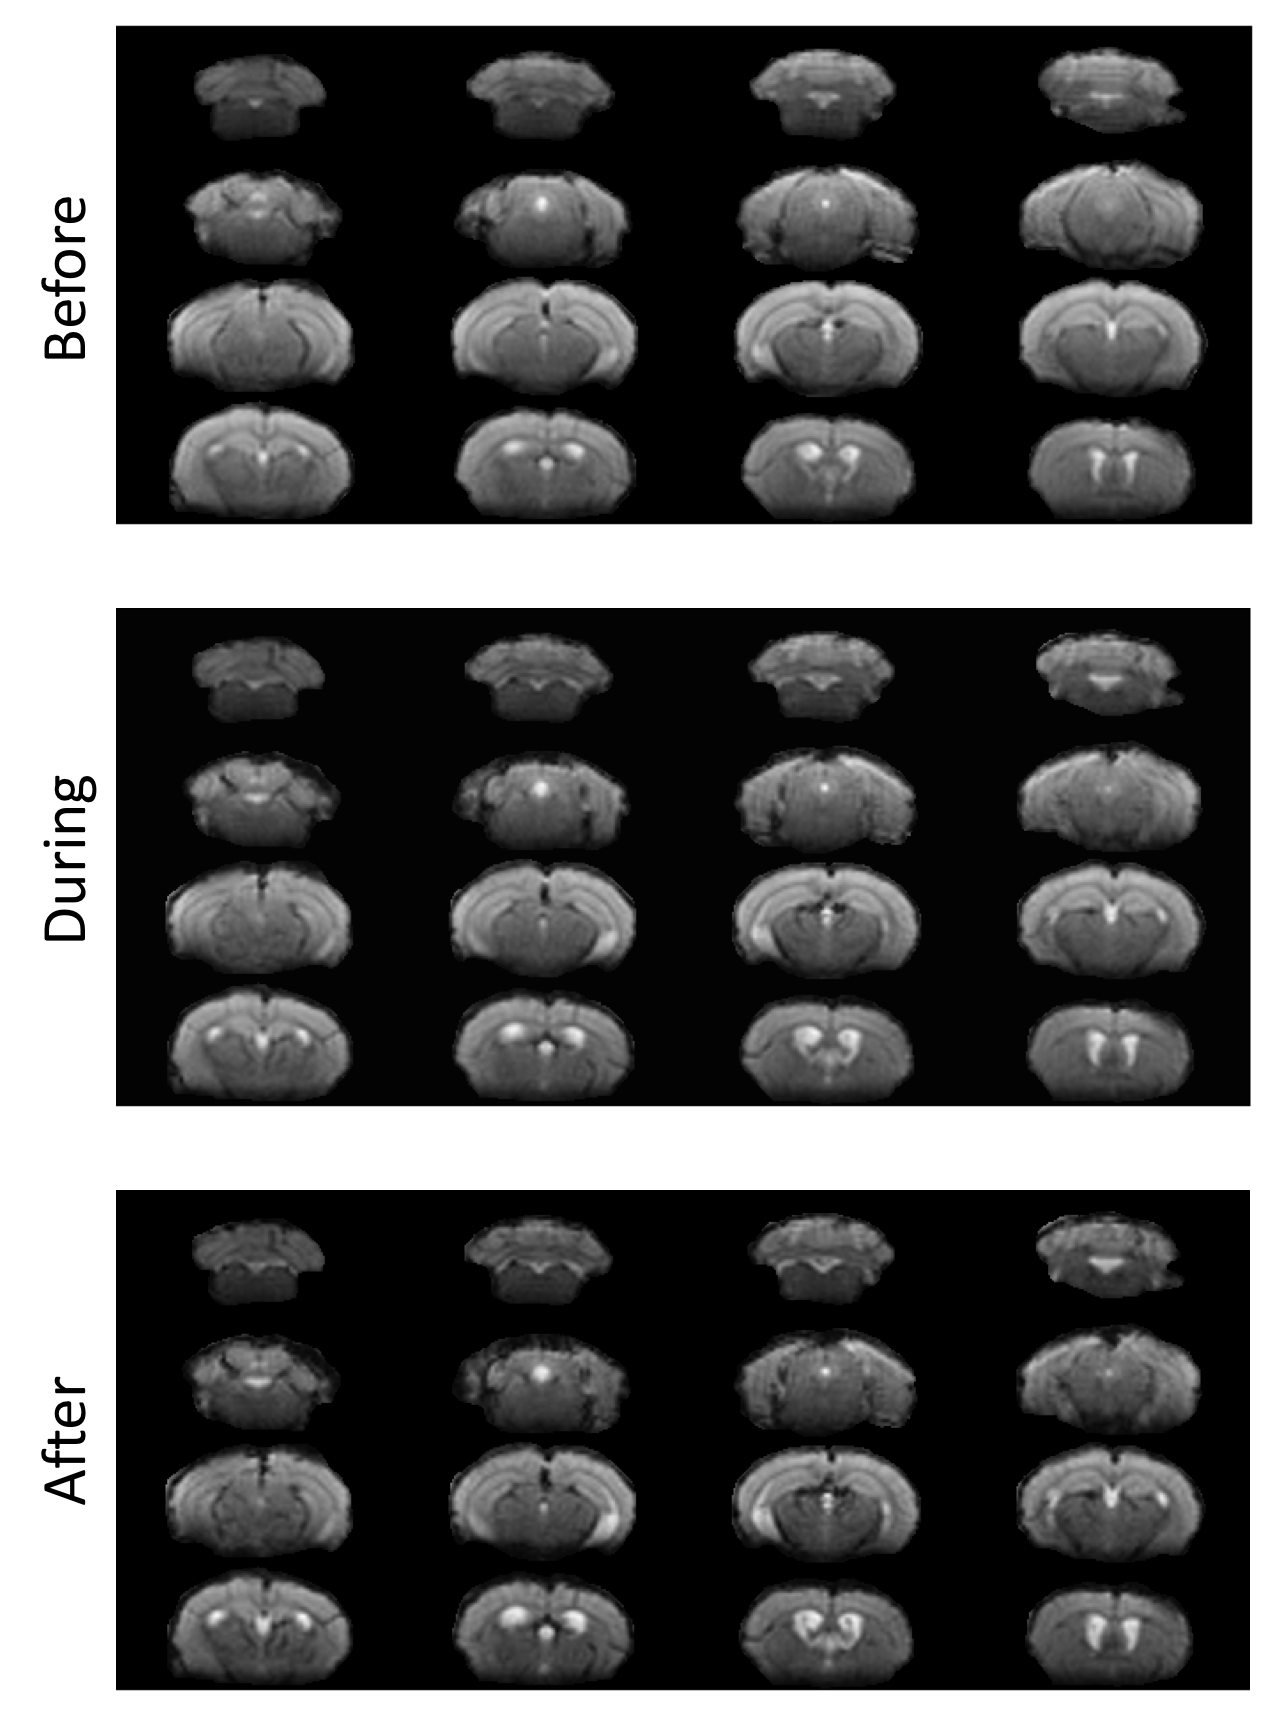
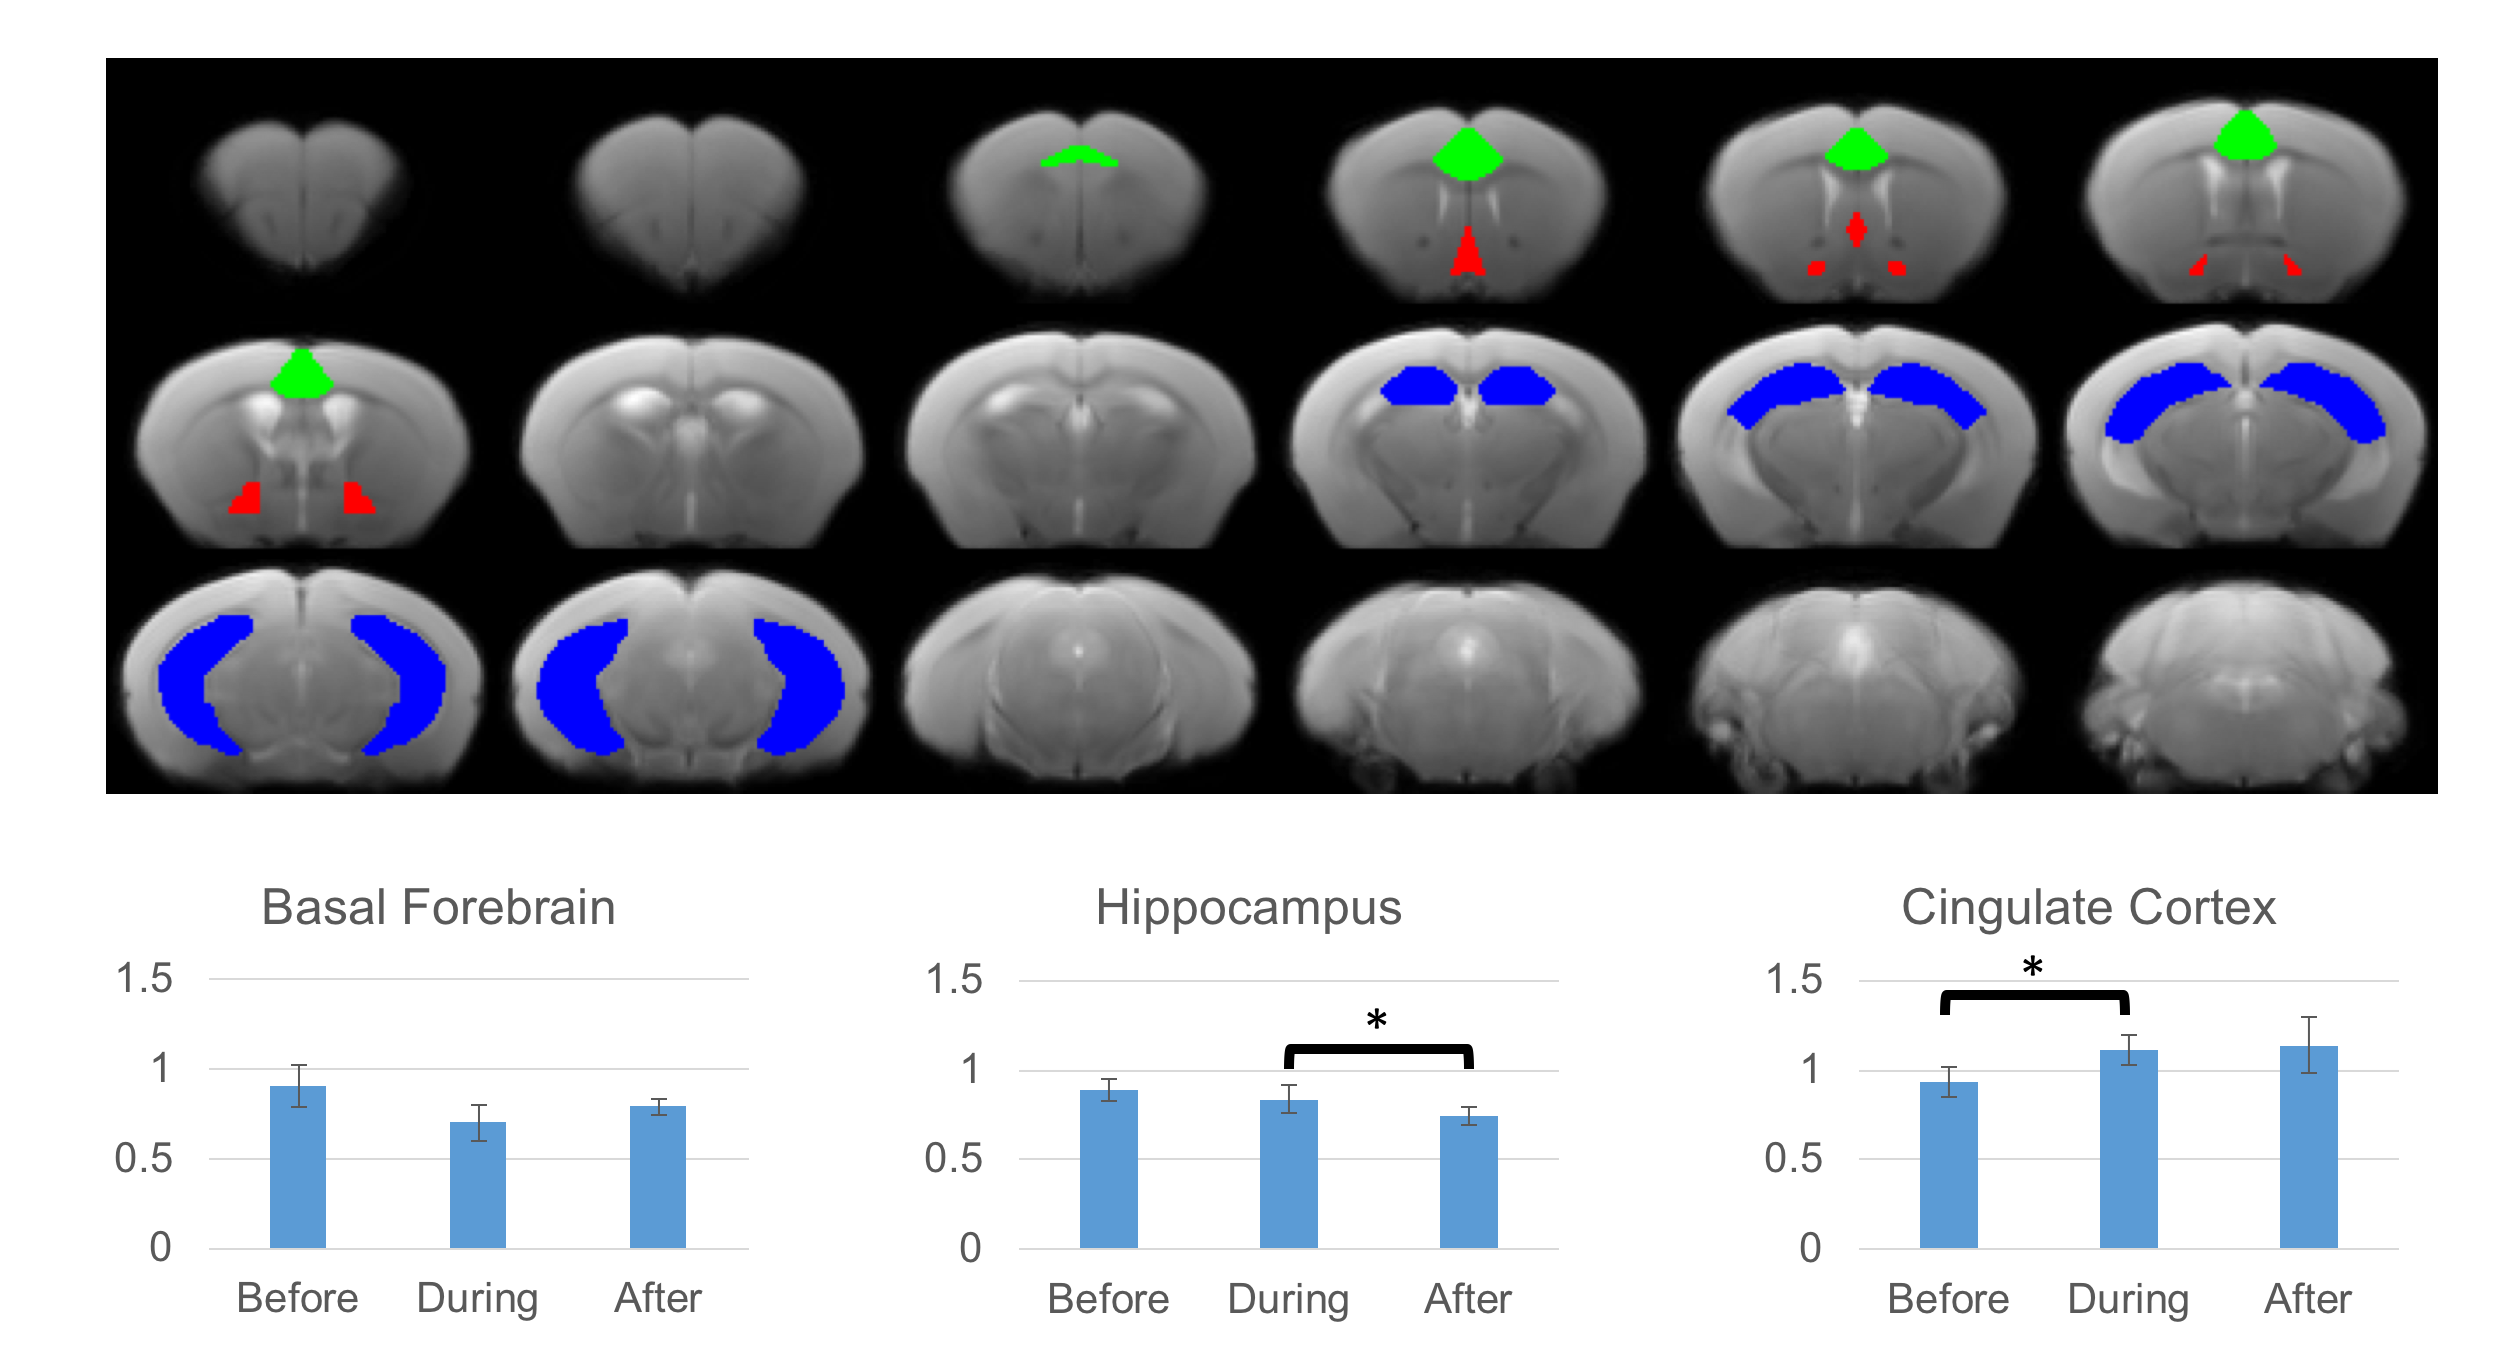
A polyethylene tubing (inner diameter= 0.28 mm; outer diameter= 0.60 mm) was surgically placed intrathecally at the lumbar region (L4-L5) of 3 healthy adult male C57BL/6J mice aged 16 weeks. The animals were scanned before, during and after intrathecal injection (1.6μl/min for 30 minutes) of the specific AQP4 inhibitor TGN020. Resting-state functional MRI (rsfMRI) was obtained using a 7-Tesla Bruker scanner and a transmit-only birdcage coil in combination with an actively decoupled receive-only cryo-surface coil. A single-shot gradient-echo echo-planar-imaging (GE-EPI) pulse sequence was used with TE/TR=12/1000ms, FOV=16x7mm2, 80x35 matrix, 30 contiguous 0.5-mm axial slices, and 600 volumes. rCVR maps were generated using MriCloud (braingps.mricloud.org/rs-cvr) followed by co-registration using SPM12 (www.fil.ion.ucl.ac.uk/spm/). rCVR in different brain areas including the cingulate cortex, hippocampus, and basal forebrain was quantified using regions-of-interest (ROIs) analyses (Figure 1). A one-way ANOVA with Bonferroni-corrected pairwise comparisons between timepoint evaluating the change in rCVR before, during, and after AQP4 inhibition was conducted. Results are presented as mean±SEM.RESULTS
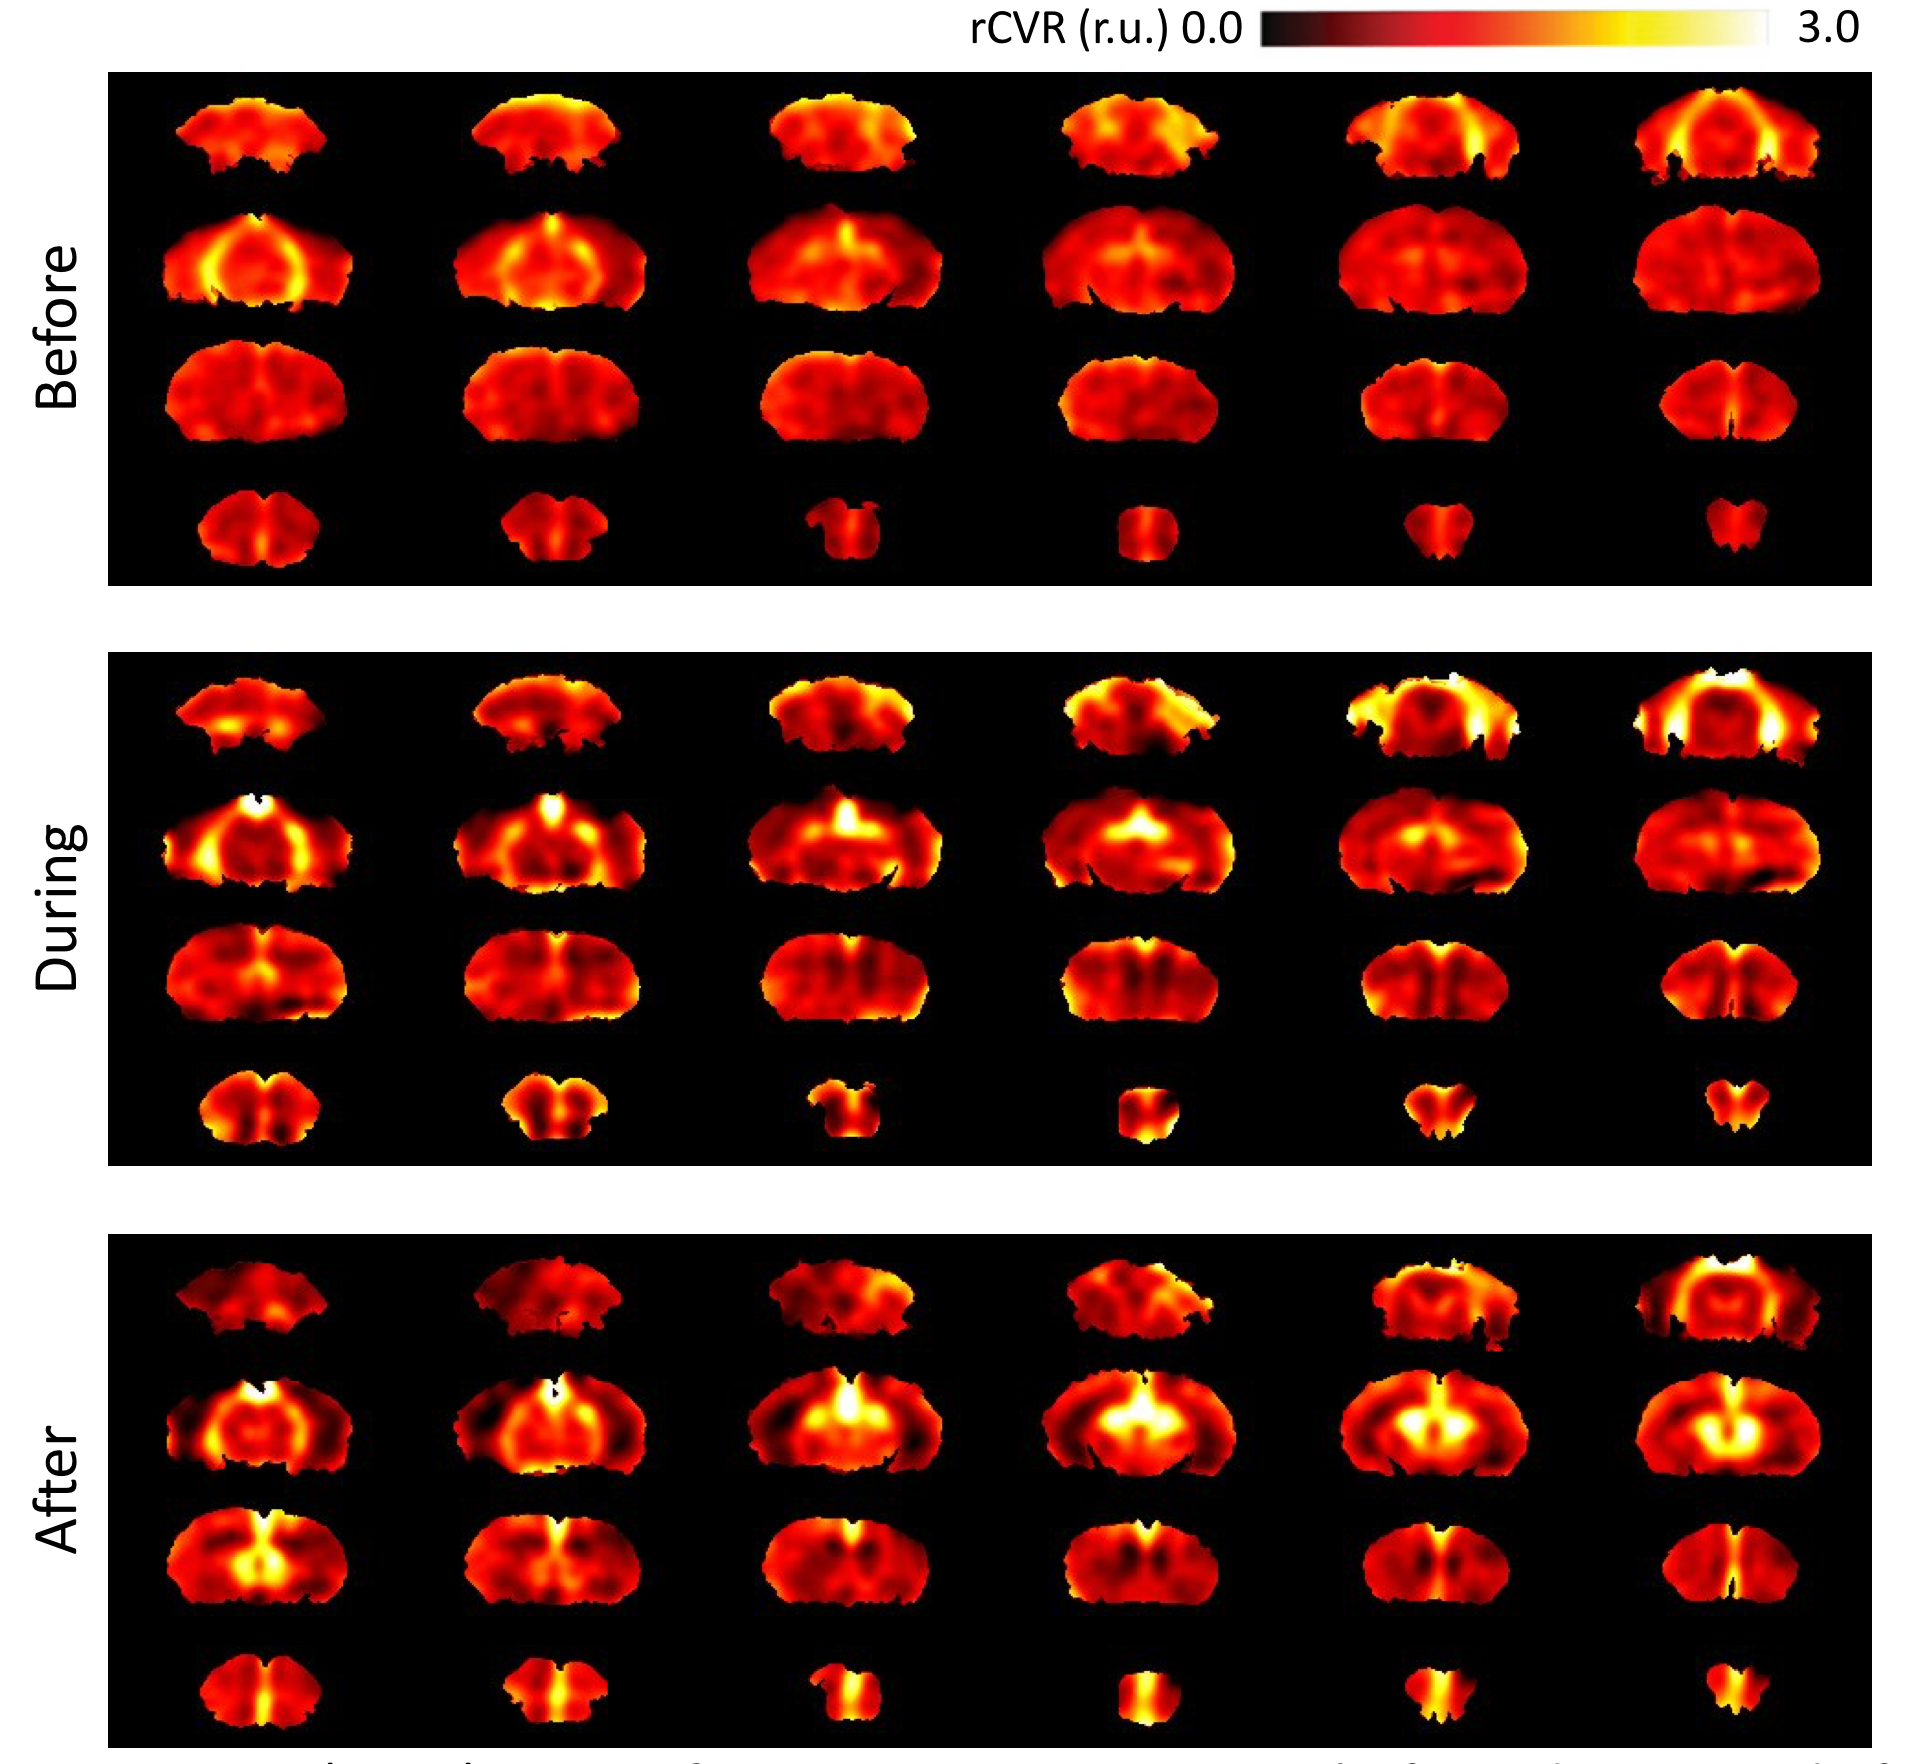
Averaged rCVR maps are shown in Figure 2. When comparing before, during, and after the pharmacological blockade of AQP4 using TGN020, rCVR values were significantly higher in the cingulate cortex during TGN020 infusion and stayed at a similar level after infusion (before: 0.93±0.08 relative unit (r.u.); during: 1.11±0.08 r.u.; after:1.14±0.16 r.u.. In the hippocampus, there was a significant decrease in rCVR after TGN020 infusion when compared to rCVR during and before infusion (before: 0.89±0.06 r.u.; during: 0.83±0.07 r.u.; after: 0.75±0.05 r.u.). The rCVR for basal forebrain did not show any significant difference before, during or after TGN020 infusion (Figures 2 and 3).DISCUSSIONS AND CONCLUSION
Mouse rCVR mapping using rsfMRI is feasible in detecting differential cortical and subcortical changes before, during and after inhibition of AQP4 activity in the central nervous system. These findings indicate the heterogeneity of AQP4 functions in the cerebrovasculature, which may explain the varying vulnerability of different brain regions to cerebrovascular diseases.Acknowledgements
This work was supported in part by the National Institutes of Health P30-CA016087, P41-EB017183, R01-EY028125 and UF1-NS107680 (Bethesda, Maryland); BrightFocus Foundation G2019103 (Clarksburg, Maryland); Research to Prevent Blindness/Stavros Niarchos Foundation International Research Collaborators Award (New York, New York); and an unrestricted grant from Research to Prevent Blindness to NYU Langone Health Department of Ophthalmology (New York, New York).
References
1. Nagelhus EA, Ottersen OP. Physiological roles of aquaporin-4 in brain. Physiological Reviews. 2013;93(4):1543-62.
2. Salman MM, Kitchen P, Halsey A, Wang MX, Törnroth-Horsefield S, ,5 Conner A, et al.,Emerging roles for dynamic aquaporin-4 subcellular relocalization in CNS water homeostasis. Brain. 2022 Jan;145(1): 64–75.
3. Mortensen KN, Sanggaard S, Mestre H, Lee H, Kostrikov S, ALR Xavier, et al. Impaired Glymphatic Transport in Spontaneously Hypertensive Rats. Journal of Neuroscience. 2019;39(32):6365-6377.
4. Solis E, Hascup KN and Hascup ER. Alzheimer’s Disease: The Link Between Amyloid-β and Neurovascular Dysfunction. Journal of Alzheimer’s Disease. 2021; 76(4): 1179–1198.
Figures