0784
A novel method of calculating cardiac pulsatility from resting state fMRI data1CUBRIC, School of Physics and Astronomy, Cardiff University, Cardiff, United Kingdom, Cardiff, United Kingdom, 2CUBRIC, School of Psychology, Cardiff University, Cardiff, United Kingdom, Cardiff, United Kingdom, 3Department of Bioengineering, McGill University, Montreal, QC, Canada, Montreal, QC, Canada, 4Graduate Program in Biological and Biomedical Engineering, McGill University, Montreal, QC, Canada, Montreal, QC, Canada
Synopsis
Keywords: Blood vessels, fMRI (resting state)
Measures of cardiac pulsatility were generated from resting-state fMRI data using ICA information and processed HRV traces. This was achieved by performing a correlation between the ICA component and HRV time series to isolate cardiac-related components from non-cardiac-related components. Classified datasets were used to train the FIX noise correction algorithm. FIX was used to classify cardiac components in 4123 rfMRI datasets. Measures of voxelwise cardiac pulsatility were generated be determining the R2 variance explained in the voxel time series by the classified cardiac components. Comparisons with gold standard pulsatility measures derived from the HRV traces showed high correlation values.Introduction
A novel method to estimate cardiac pulsatility from resting-state fMRI (rfMRI) data is introduced. This method uses processed heart rate variability (HRV) traces1 in a subset of the data along with an independent component analysis (ICA) to develop a classification algorithm to determine cardiac-related components. Once classified, these components were inserted into in a linear regression to determine the amount of variance explained in the rfMRI data. This R2 variance statistic is considered the measure of pulsatility. These values of pulsatility were compared with a gold standard method derived from the measured HRV traces and high correlation values were observed.Methods
rfMRI data collected by the Human Connectome Project S1200 release2,3 and ICA information were used to isolate cardiac-related independent components. Useable cardiac traces are available for 390 of the 4123 rfMRI datasets and were processed to give HRV traces. In these datasets, ICA was performed using MELODIC, resulting in 17 components on average. The correlation between each ICA component time series and the associated HRV trace was calculated. An α-significance value of 0.05 corrected for the number of components was used to determine which components were cardiac-related. Four training datasets containing 100 (randomly selected) classified rfMRI datasets were created, each group defined by their HR value (60BPM, 70BPM, 90BPM and mixBPM). The FIX4 noise correction algorithm was trained to separate cardiac and non-cardiac components for each training dataset. Each trained FIX used to classify components for all 4123 rfMRI datasets. For each dataset, cardiac component time series were included as input regressors along with motion parameters to a linear regression to determine the amount of variance explained in each voxel time series. This measure of pulsatility was averaged over whole brain (WB), grey matter (GM) and white matter (WM) brain masks. In datasets with useable measured cardiac traces, these pulsatility measures were compared to a gold standard (‘true’ pulsatility) generated by determining the variance explained in voxel time series by the corresponding processed HRV trace.Results
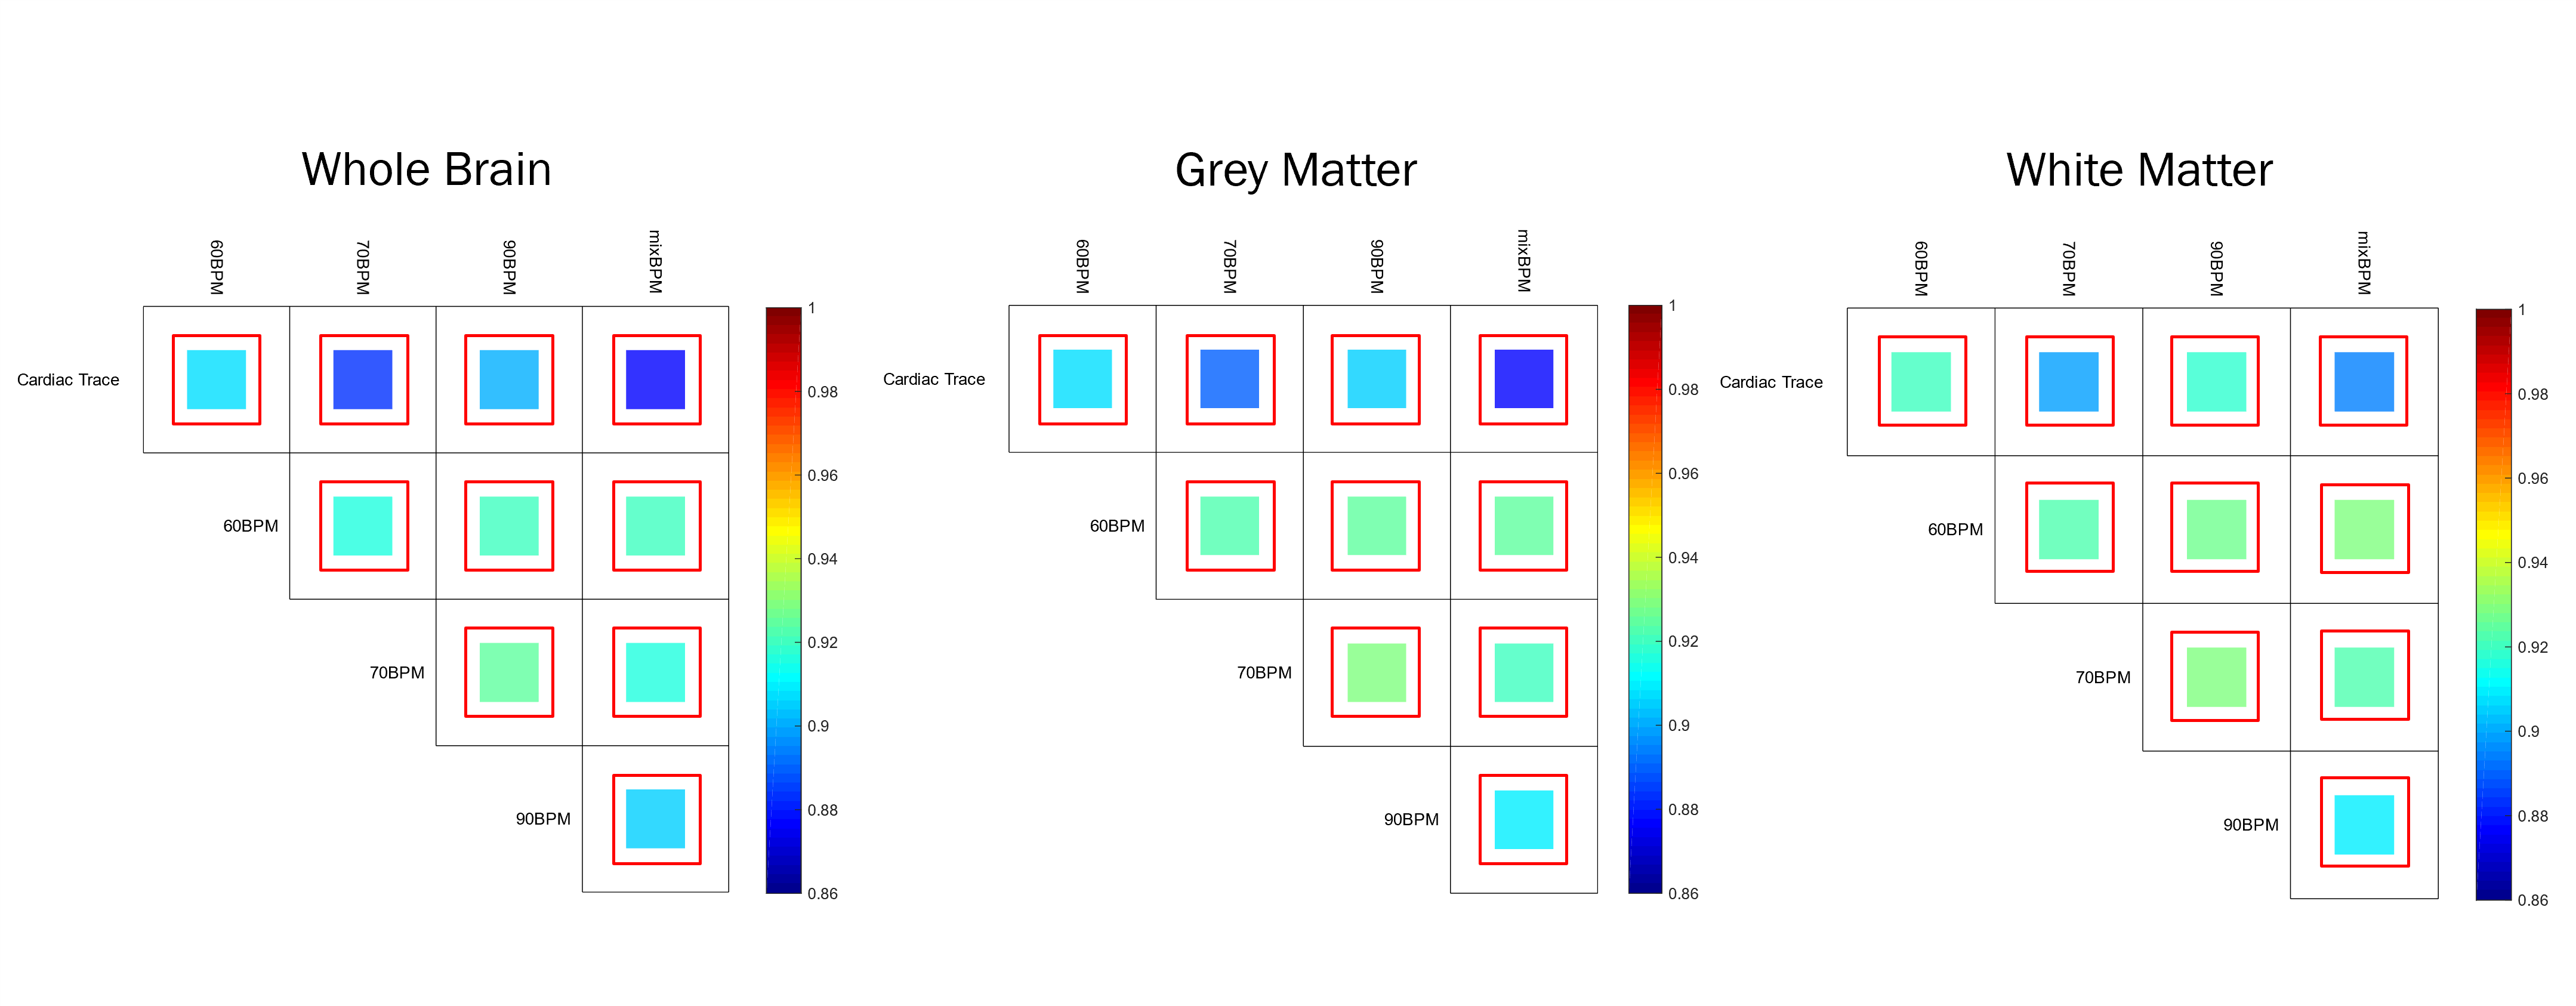
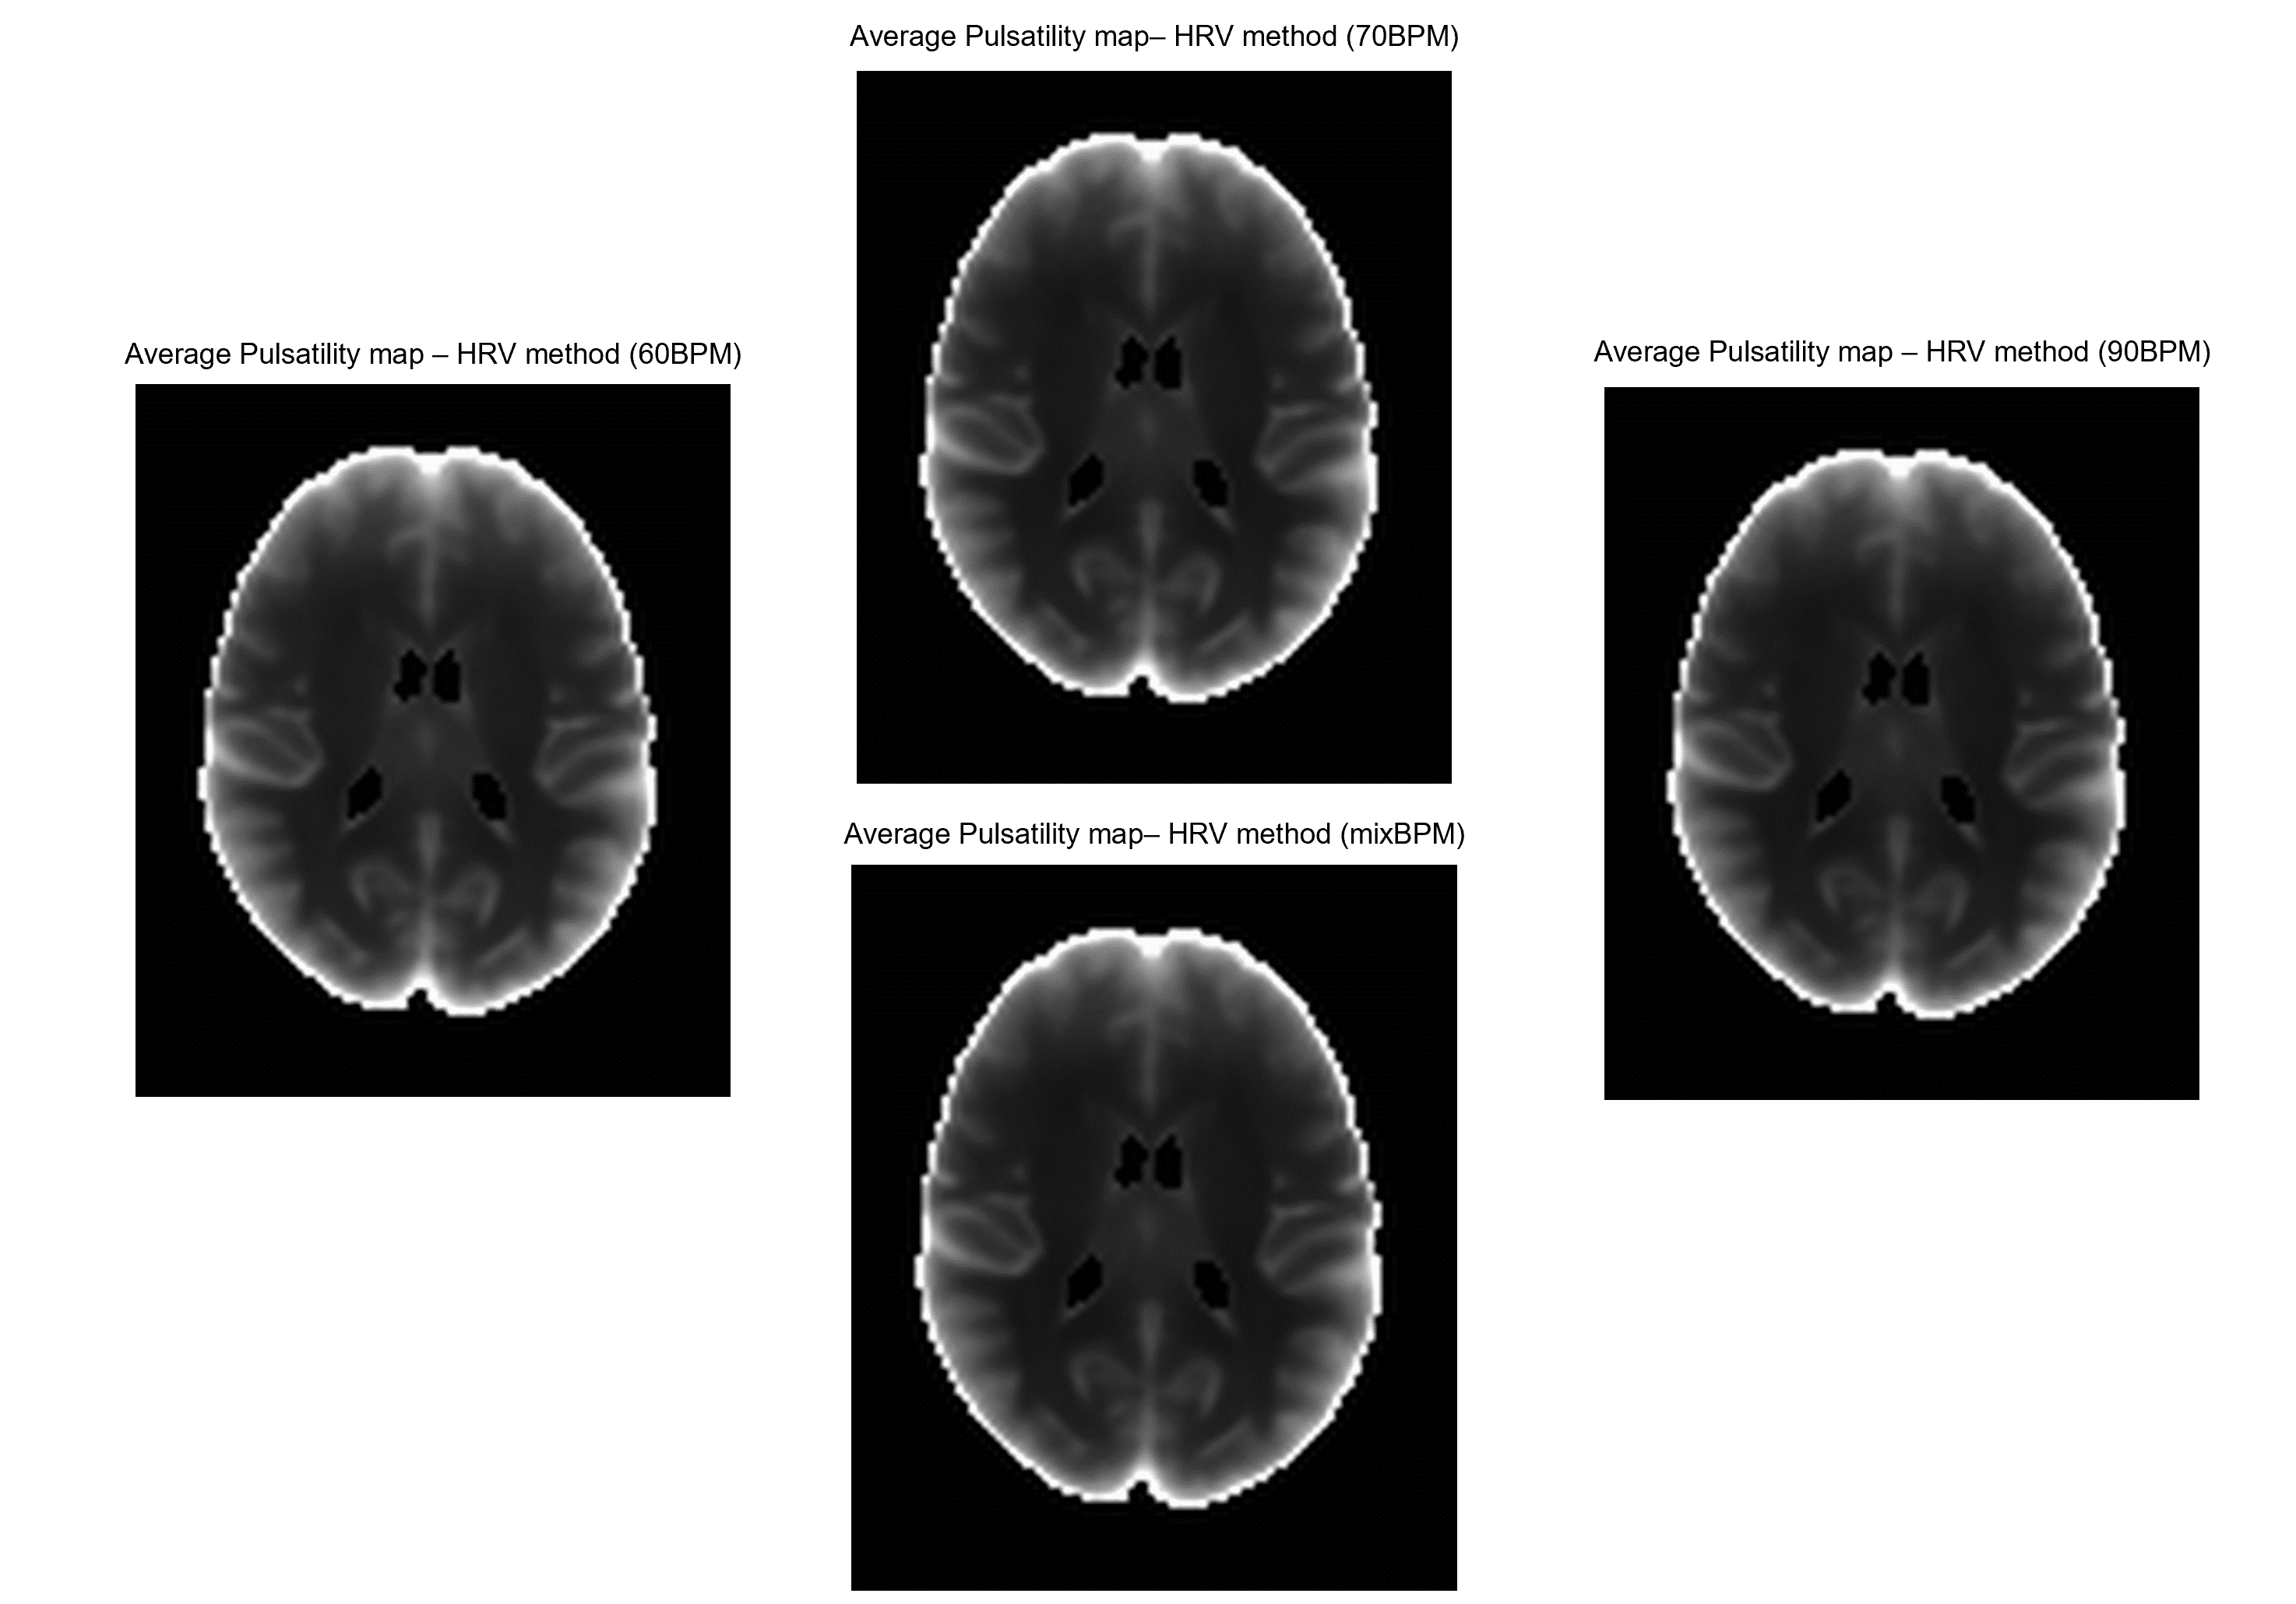
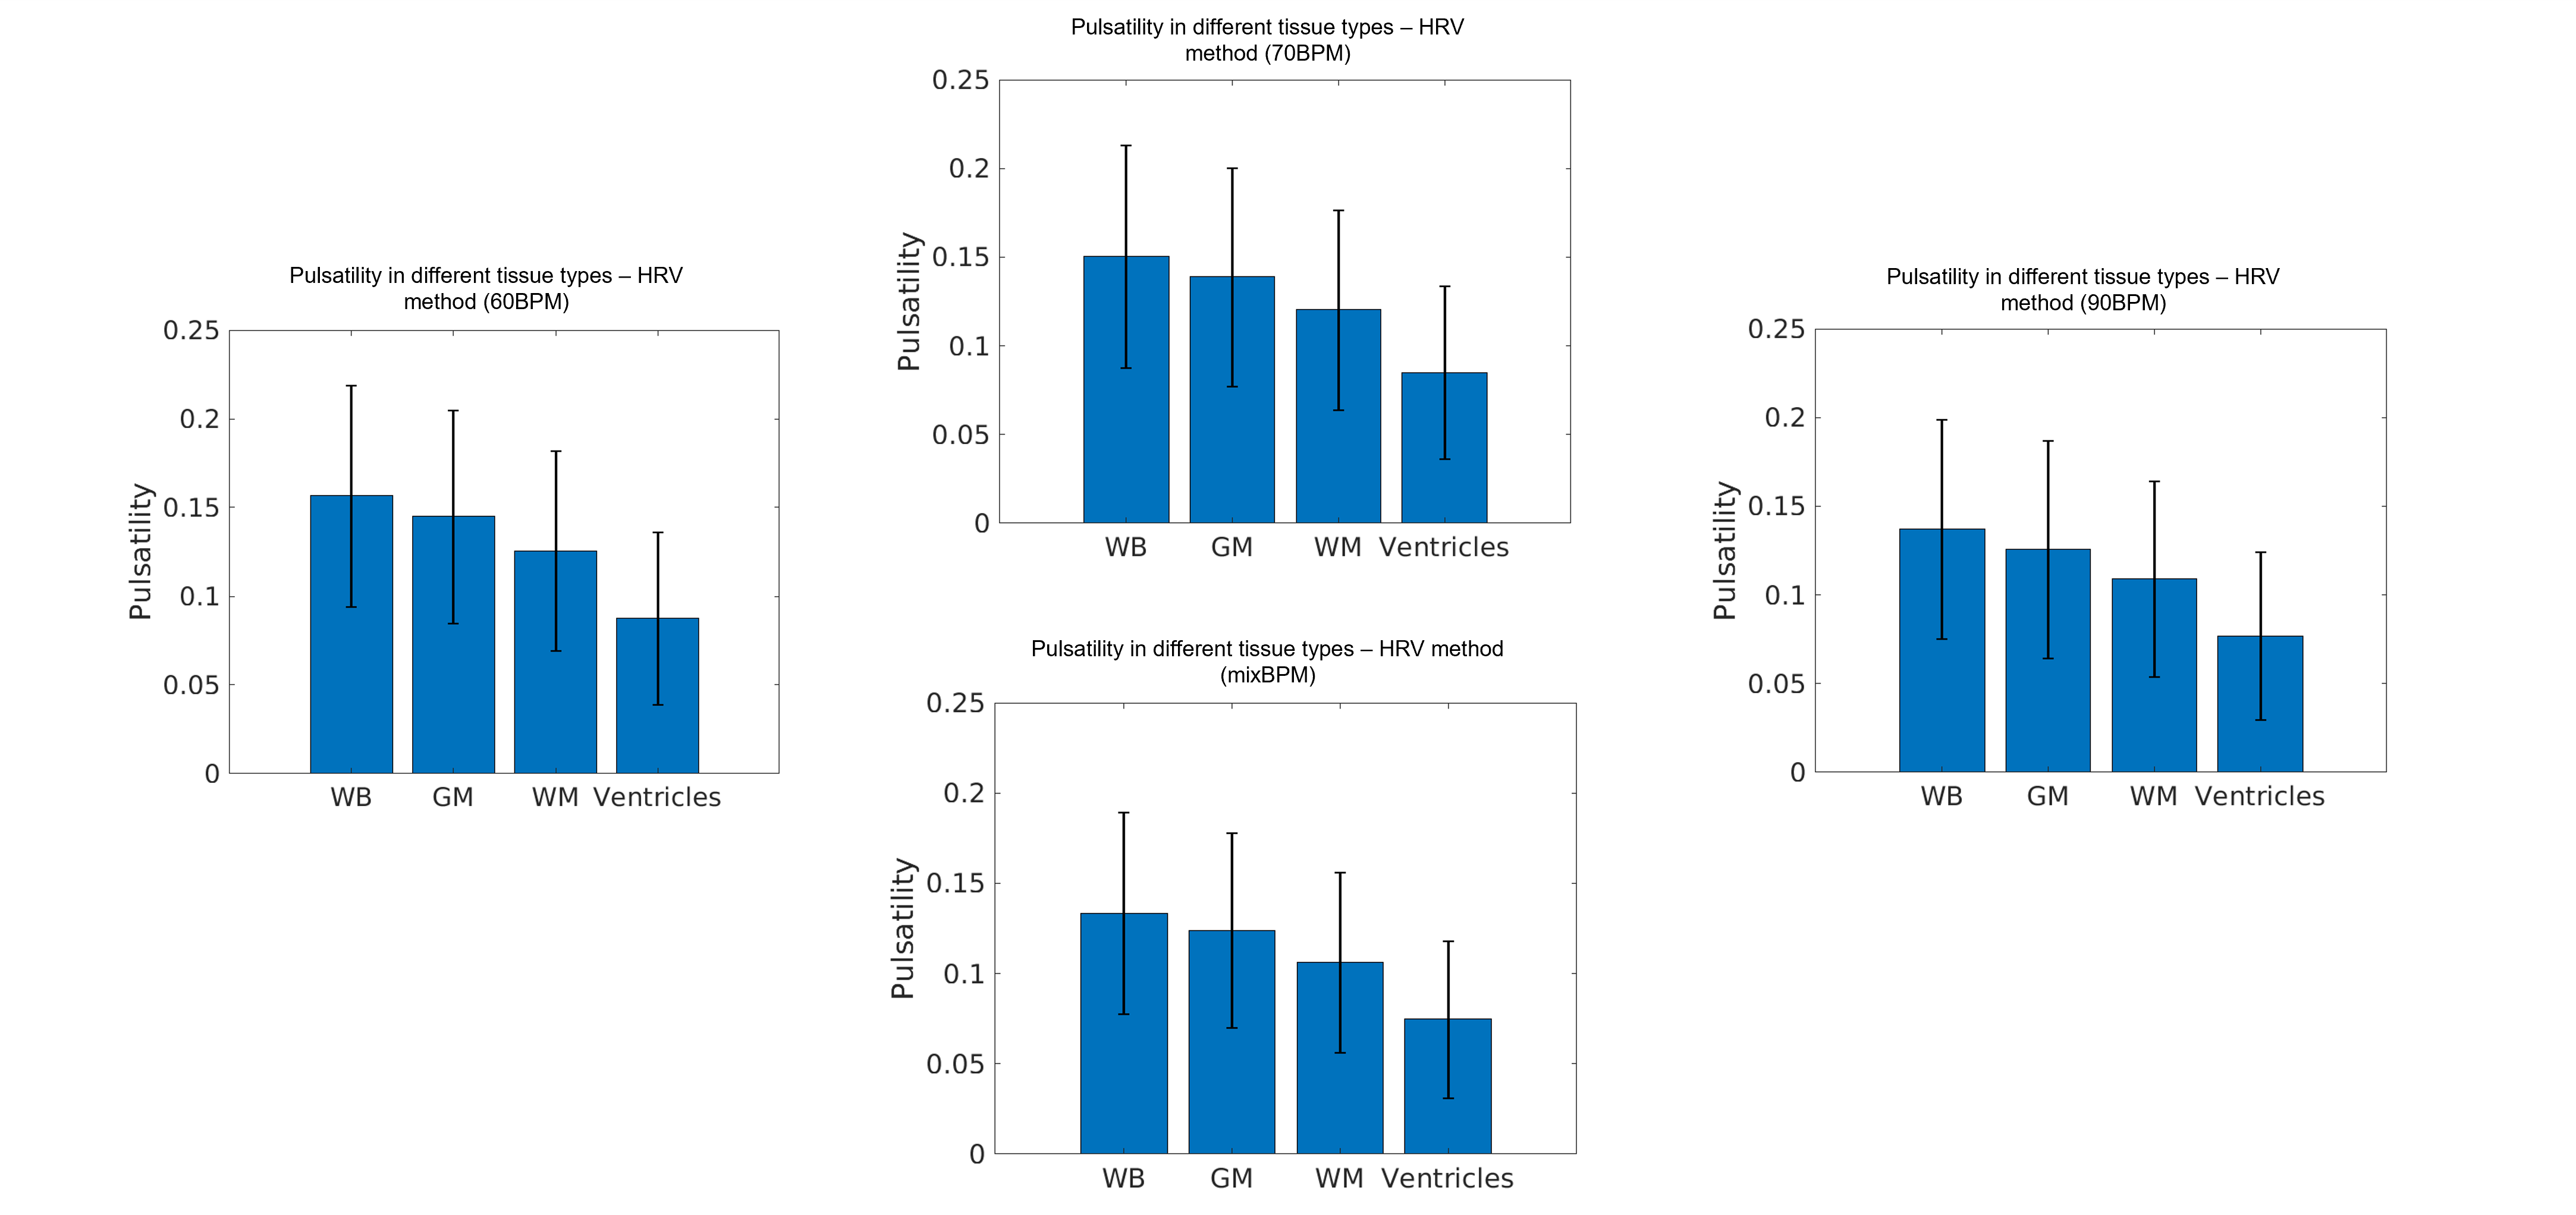
Correlation values, between the ‘true’ GM pulsatility and the GM pulsatility generated by the novel method with the 60BPM training dataset, exceeded 0.88 (associated p-value=1.2×10-125) in all cases with a maximum correlation value of 0.91 (p=8.6×10-149) (Figure 1). The mixBPM training dataset generated values of GM pulsatility with the lowest similarity to the ‘true’ pulsatility with a correlation value of 0.88 (p=1.2×10-125). Average pulsatility maps for each method (60BPM, 70BPM, 90BPM, mixBPM) are shown in Figure 2. A clear structure can be seen between GM and WM as is expected. The values of pulsatility in different tissue types were compared. Bar charts showing the average pulsatility value estimated for WB, GM, WM and ventricles are shown in Figure 3. The largest value of average pulsatility is found when using the WB mask and decreases in the GM, WM and the ventricles respectively. These trends all showed statistically significant differences with p<0.0688.Discussion
Calculation of the effects of pulsatile flow on the microvasculature is an important metric in the tracking and diagnosis of cognitive decline and dementia5,6,7. In this study, we have presented a novel method for the calculation of cardiac pulsatility which relies on physiological recordings from a subset of participants. When compared to a gold standard (‘true pulsatility’), high correlation values were observed, exceeding 0.88 (associated p-value=1.2×10-125). Initially, it was expected that there would be large differences in the pulsatility estimates generated from the different training datasets: HR values used to train the dataset might bias the classifier to only detect cardiac components with similar HR’s. However, these results suggest this is not the case. The values of pulsatility estimated using a classifier trained using groups of participants with different HR values (60BPM, 70BPM and 90BPM) were highly correlated with each other and with true pulsatility values. This suggests that the HR value for participants used in training dataset does not bias the classifier. When comparing values of pulsatility in the different brain tissue types (WB, GM, WM and ventricles), the WB returned the largest values. This was expected as this mask encompasses signal from all areas of the brain. The GM showed the second largest pulsatility values as expected. Pulsatility in the WM was attributed to cardiac-related noise. Future work will determine the minimum number of training datasets required to determine accurate pulsatility values using this FIX-based approach. A significant reduction in the number of high-quality physiological recordings required to generate measures of cardiac pulsatility in a large dataset might be possible.Conclusion
We have introduced a novel method of generating measures of cardiac pulsatility in the brain that does not require HRV traces for all participants.This method performed well when compared with ‘true’ estimates of pulsatility. High correlations were observed between the ‘true’ pulsatility values and those of the novel method introduced. Training datasets used to train FIX were varied by HR value but no significant difference in results were found, indicating that this approach is not biased by the resting heart rates of the training participants, making the approach more practical.
Acknowledgements
This work was supported by Wellcome [WT200804; WT224267]References
[1] Michalis Kassinopoulos and Georgios D. Mitsis. “Physiological noise modelling in fMRI based on the pulsatile component of photoplethysmograph”. In: bioRxiv (2020). doi: 10.1101/2020.06.01.128306.
[2] M. F. Glasser et al. “The minimal preprocessing pipelines for the Human Connectome Project”. In: Neuroimage 80 (2013), pp. 105–24. issn: 1095-9572 (Electronic) 1053-8119 (Linking). doi: 10 . 1016 / j . neuroimage .2013.04.127. url: https://www.ncbi.nlm.nih.gov/pubmed/23668970.
[3] D. C. Van Essen et al. “The WU-Minn Human Connectome Project: an overview”. In: Neuroimage 80 (2013), pp. 62–79. issn: 1095-9572 (Electronic) 1053-8119 (Linking). doi: 10.1016/j.neuroimage.2013.05.041. url: https://www.ncbi.nlm.nih.gov/pubmed/23684880.
[4] G. Salimi-Khorshidi et al. “Automatic denoising of functional MRI data: combining independent component analysis and hierarchical fusion of classifiers”. In: Neuroimage 90 (2014), pp. 449–68. issn: 1095-9572 (Electronic) 1053-8119 (Linking). doi: 10.1016/j.neuroimage.2013.11.046. url:https://www.ncbi.nlm.nih.gov/pubmed/24389422.
[5] G. F. Mitchell et al. “Arterial stiffness, pressure and flow pulsatility and brain structure and function: the Age, Gene/Environment Susceptibility Reykjavik study”. In: Brain 134.Pt 11 (2011), pp. 3398–407. issn: 1460-2156 (Electronic) 0006-8950 (Linking). doi: 10.1093/brain/awr253. url: https://www.ncbi.nlm.nih.gov/pubmed/22075523.
[6] L. A. Rivera-Rivera et al. “Changes in intracranial venous blood flow and pulsatility in Alzheimer’s disease: A 4D flow MRI study”. In: J Cereb Blood Flow Metab 37.6 (2017), pp. 2149–2158. issn: 1559-7016 (Electronic) 0271-678X (Linking). doi: 10.1177/0271678X16661340. url: https://www.ncbi.nlm.nih.gov/pubmed/27492950.
[7] T. Vikner et al. “Cerebral arterial pulsatility is linked to hippocampal microvascular function and episodic memory in healthy older adults”. In: J Cereb Blood Flow Metab 41.7 (2021), pp. 1778–1790. issn: 1559-7016 (Electronic) 0271-678X (Linking). doi: 10.1177/0271678X20980652. url: https://www.ncbi.nlm.nih.gov/pubmed/33444091.
Figures