0783
Super-resolution assessment of relative pressure in intracranial atherosclerosis using ML-enhanced 4D Flow MRI
Patrick Winter1,2, David Marlevi3,4, Maria Aristova2, Edward Ferdian5, Jonas Schollenberger6, Alireza Vali2, Jackson Moore2, Michael Markl2, Ramez Abdallah2, Sameer Ansari2, C Alberto Figuerora6, David Nordsletten6, Alistair Young6, and Susanne Schnell1,2
1Department of Medical Physics, University of Greifswald, Greifswald, Germany, 2Department of Radiology, Northwestern University Feinberg School of Medicine, Chicago, IL, United States, 3Dept Molecular Medicine and Surgery, Karolinska Institutet, Solna, Sweden, 4Institute for Medical Engineering and Science, Massachusetts Institute of Technology, Cambridge, MA, United States, 55Department of Anatomy and Medical Imaging, University of Auckland, Auckland, New Zealand, 6Department of Anatomy and Medical Imaging, University of Michigan, Ann Arbor, MI, United States
1Department of Medical Physics, University of Greifswald, Greifswald, Germany, 2Department of Radiology, Northwestern University Feinberg School of Medicine, Chicago, IL, United States, 3Dept Molecular Medicine and Surgery, Karolinska Institutet, Solna, Sweden, 4Institute for Medical Engineering and Science, Massachusetts Institute of Technology, Cambridge, MA, United States, 55Department of Anatomy and Medical Imaging, University of Auckland, Auckland, New Zealand, 6Department of Anatomy and Medical Imaging, University of Michigan, Ann Arbor, MI, United States
Synopsis
Keywords: Stroke, Atherosclerosis, intracranial atherosclerotic disease, stenosis, pressure differences
In vivo measurements of intracranial pressure differences using 4D flow are useful to assess health risks associated with intracranial atherosclerotic disease (ICAD). In the clinical routine, approximations of the Navier-Stokes equation are used to derive relative pressure values, which can be inaccurate in intracranial vessels. Recently we presented an algorithm using a virtual work-energy formulation(vWERP). While this technique yields more accurate pressure estimations in intracranial settings, still systematic errors due to insufficient spatial resolution were observed. Here, we apply artificial intelligence-based super resolution for more accurate assessments of pressure values near the stenosis in a cohort of ICAD patients.Purpose
The in vivo measurement of regional pressure differences with Doppler ultrasound or Magnetic Resonance Imaging (MRI) is an important tool to assess risks associated with intracranial atherosclerotic disease (ICAD). Commonly, the Bernoulli equation is used, utilizing assumptions of the flow field to yield approximations of regional pressure differences. Albeit frequently used in other cardiovascular domains, these simplified techniques are highly inaccurate when applied in intracranial settings1,2. 4D flow magnetic resonance Imaging (MRI) leverages the full strength of the Navier-Stokes equations describing 3D hemodynamics. Within this space, we recently developed a virtual work-energy formulation of the complete Navier-Stokes equations to enable accurate estimations of regional pressure changes across arbitrary vessels (virtual Work-Energy Relative Pressure; vWERP)2,3, however, with a systematically observed dependence on spatial resolution. To overcome this, we coupled vWERP to a machine learning-based super-resolution (SR) network (4DFlowNet)4, using cerebrovascular training data for accurate pressure assessments at sub-mm scales. Whilst already highly promising, clinical validation of the setup remains to be performed. Hence, the purpose of this study was to apply a combined SR and vWERP approach to a clinical cohort of ICAD patients, evaluating regional pressure changes in relation to pathophysiological presentation.Methods
Retrospectively recruited ICAD patients (n=5, 3 male, 57-84 yrs, 60-102 kg) with >70% stenosis and healthy volunteers (n=5, 3 male, 23-30 yrs, 70-118 kg) with informed consent were imaged with 3T MRI using an intracranial dual-venc 4D flow MRI sequence5 and high-resolution 3D time-of-flight (TOF; 0.26 x 0.26 mm x 0.5 mm). For anti-aliasing, phase offset correction, and de-noising an in-house MATLAB tool5 was used. TOF images were coregisterered to 4D flow MRI data for vessel segmentation. Labeling and extraction of hemodynamic parameters was performed with a centerline-based tool1. All 4D flow MRI datasets (native spatial resolution: 0.98-1.1 x 0.98-1.1 x 1.0-1.1 mm) were processed using the pre-trained deep residual network 4DFlowNet3 to double spatial resolution (0.49-0.55 x 0.49-0.55 x 0.5-0.55 mm).The TOF segmentation was used to guide analysis planes nearby the intracranial stenosis. As clinical reference, the Bernoulli equation with compensation for an effective area was used to derive pressure difference values as per2:
$$\Delta P_{Bernoulli}=4\cdot v^2_s\cdot [1-(\frac{A_s}{A_p})^2]$$
Here, $$$\Delta P_{Bernoulli}$$$ denotes the pressure difference (in mmHg), $$$v_s$$$ the maximum velocity caused by the stenosis, and $$$A_s$$$ and $$$A_p$$$ the lumen areas of an analysis plane at the smallest part of the stenosis and proximal to the stenosis, respectively.
Furthermore, pressure difference values between an inlet and outlet plane near the stenosis were calculated with the vWERP algorithm1 as per:
$$\Delta P_{vWERP}=-\frac{1}{Q_e}(\frac{\partial}{\partial t}K_e+A_e+V_e)$$
Here, $$$K_e$$$, $$$A_e$$$ and $$$V_e$$$ are virtual energy and flow values computed with vWERP.
Results
4DFlowNet yielded a much better resolved visualization of flow through the Circle of Willis and the stenosis due to super resolution and de-noising (Fig. 1), facilitating the assessment of flow parameters in narrow vessels. Fig. 2A shows boxplots of the peak relative pressure values, determined with all analysis strategies in healthy volunteers. Both Bernoulli and vWERP featured increased median pressure values when SR is used, however, the pressure increase is more prominent for vWERP+SR. Fig. 2B and C show Bland-Altman plots to compare native with super-resolution for Bernoulli (B) and vWERP (C). Both techniques exhibited higher pressure values when SR is used (offset 0.22 ± 0.45 mmHg for Bernoulli, 0.25 ± 0.26 mmHg for vWERP).In patients, pressure differences were derived at 5 intracranial stenoses (two in the right middle cerebral artery (MCA), one in the left MCA, one in the right internal carotid artery (ICA), one in the basilar artery). In Fig. 3A, boxplots show the results for Bernoulli and vWERP using NR and SR, respectively. In general, peak relative pressure values at the stenosis derived with vWERP were lower in comparison to Bernoulli. Fig. 3B+C show Bland-Altman comparisons for both spatial resolutions. In both cases, lower pressure values are noted for SR, with increasing deviations relative to the NR analysis with increasing pressure values (mean shift with SR: -7.9 ± 3.2 mmHg for Bernoulli and -2.4 ± 2.7 mmHg for vWERP).
Discussion and Conclusion
We have employed combined SR 4D Flow MRI and physics-based image processing to quantify intracranial regional pressure changes. In healthy volunteers, systematically larger relative pressures were derived with SR conversion. This agrees well with previous observations, pointing to a systematic under-estimation of relative pressures at >1 mm resolution1,2. In contrast, values were systematically lower at severe ICAD stenoses when utilizing SR conversion, holding true for both vWERP and Bernoulli techniques. One explanation may be the incapability of SR to preserve high velocity values in narrow vessels. However, comparisons with reference computational fluid dynamics (CFD) data already highlighted that Bernoulli-derived data overestimate relative pressures across stenosis, in-line with our here observed data1. Other factors such as partial volume effects and dependence on sufficient segmentation quality might further influence the accuracy of image-derived estimates at native resolution. In conclusion, our results indicate the clinical utility of a combined SR and vWERP approach, with distinctive differences against clinical routine Bernoulli estimations at both native and super-resolution highlighting the need for higher-order approaches. Assessment in extended cohorts is ongoing, as well as further validation in a cerebrovascular-specific validation setting.Acknowledgements
Funding: National Institutes of Health (NIH 1R01HL149787, 1R21MH125350). DM acknowledges funding from the Knut and Alice Wallenberg foundation.References
1. Alireza Vali et al, Magn Reson Med 82(2): 749-762, 2019
2. David Marlevi et al, Magn Reson Med 86(6): 3096-3110, 2021
3. David Marlevi, Scientific Reports 9: 1375, 2019
4. Edward Ferdian at al, Frontiers in Physics, 2020
5. Susanne Schnell et al, Jour Magn Reson Imag 46(1): 102-114, 2017
Figures
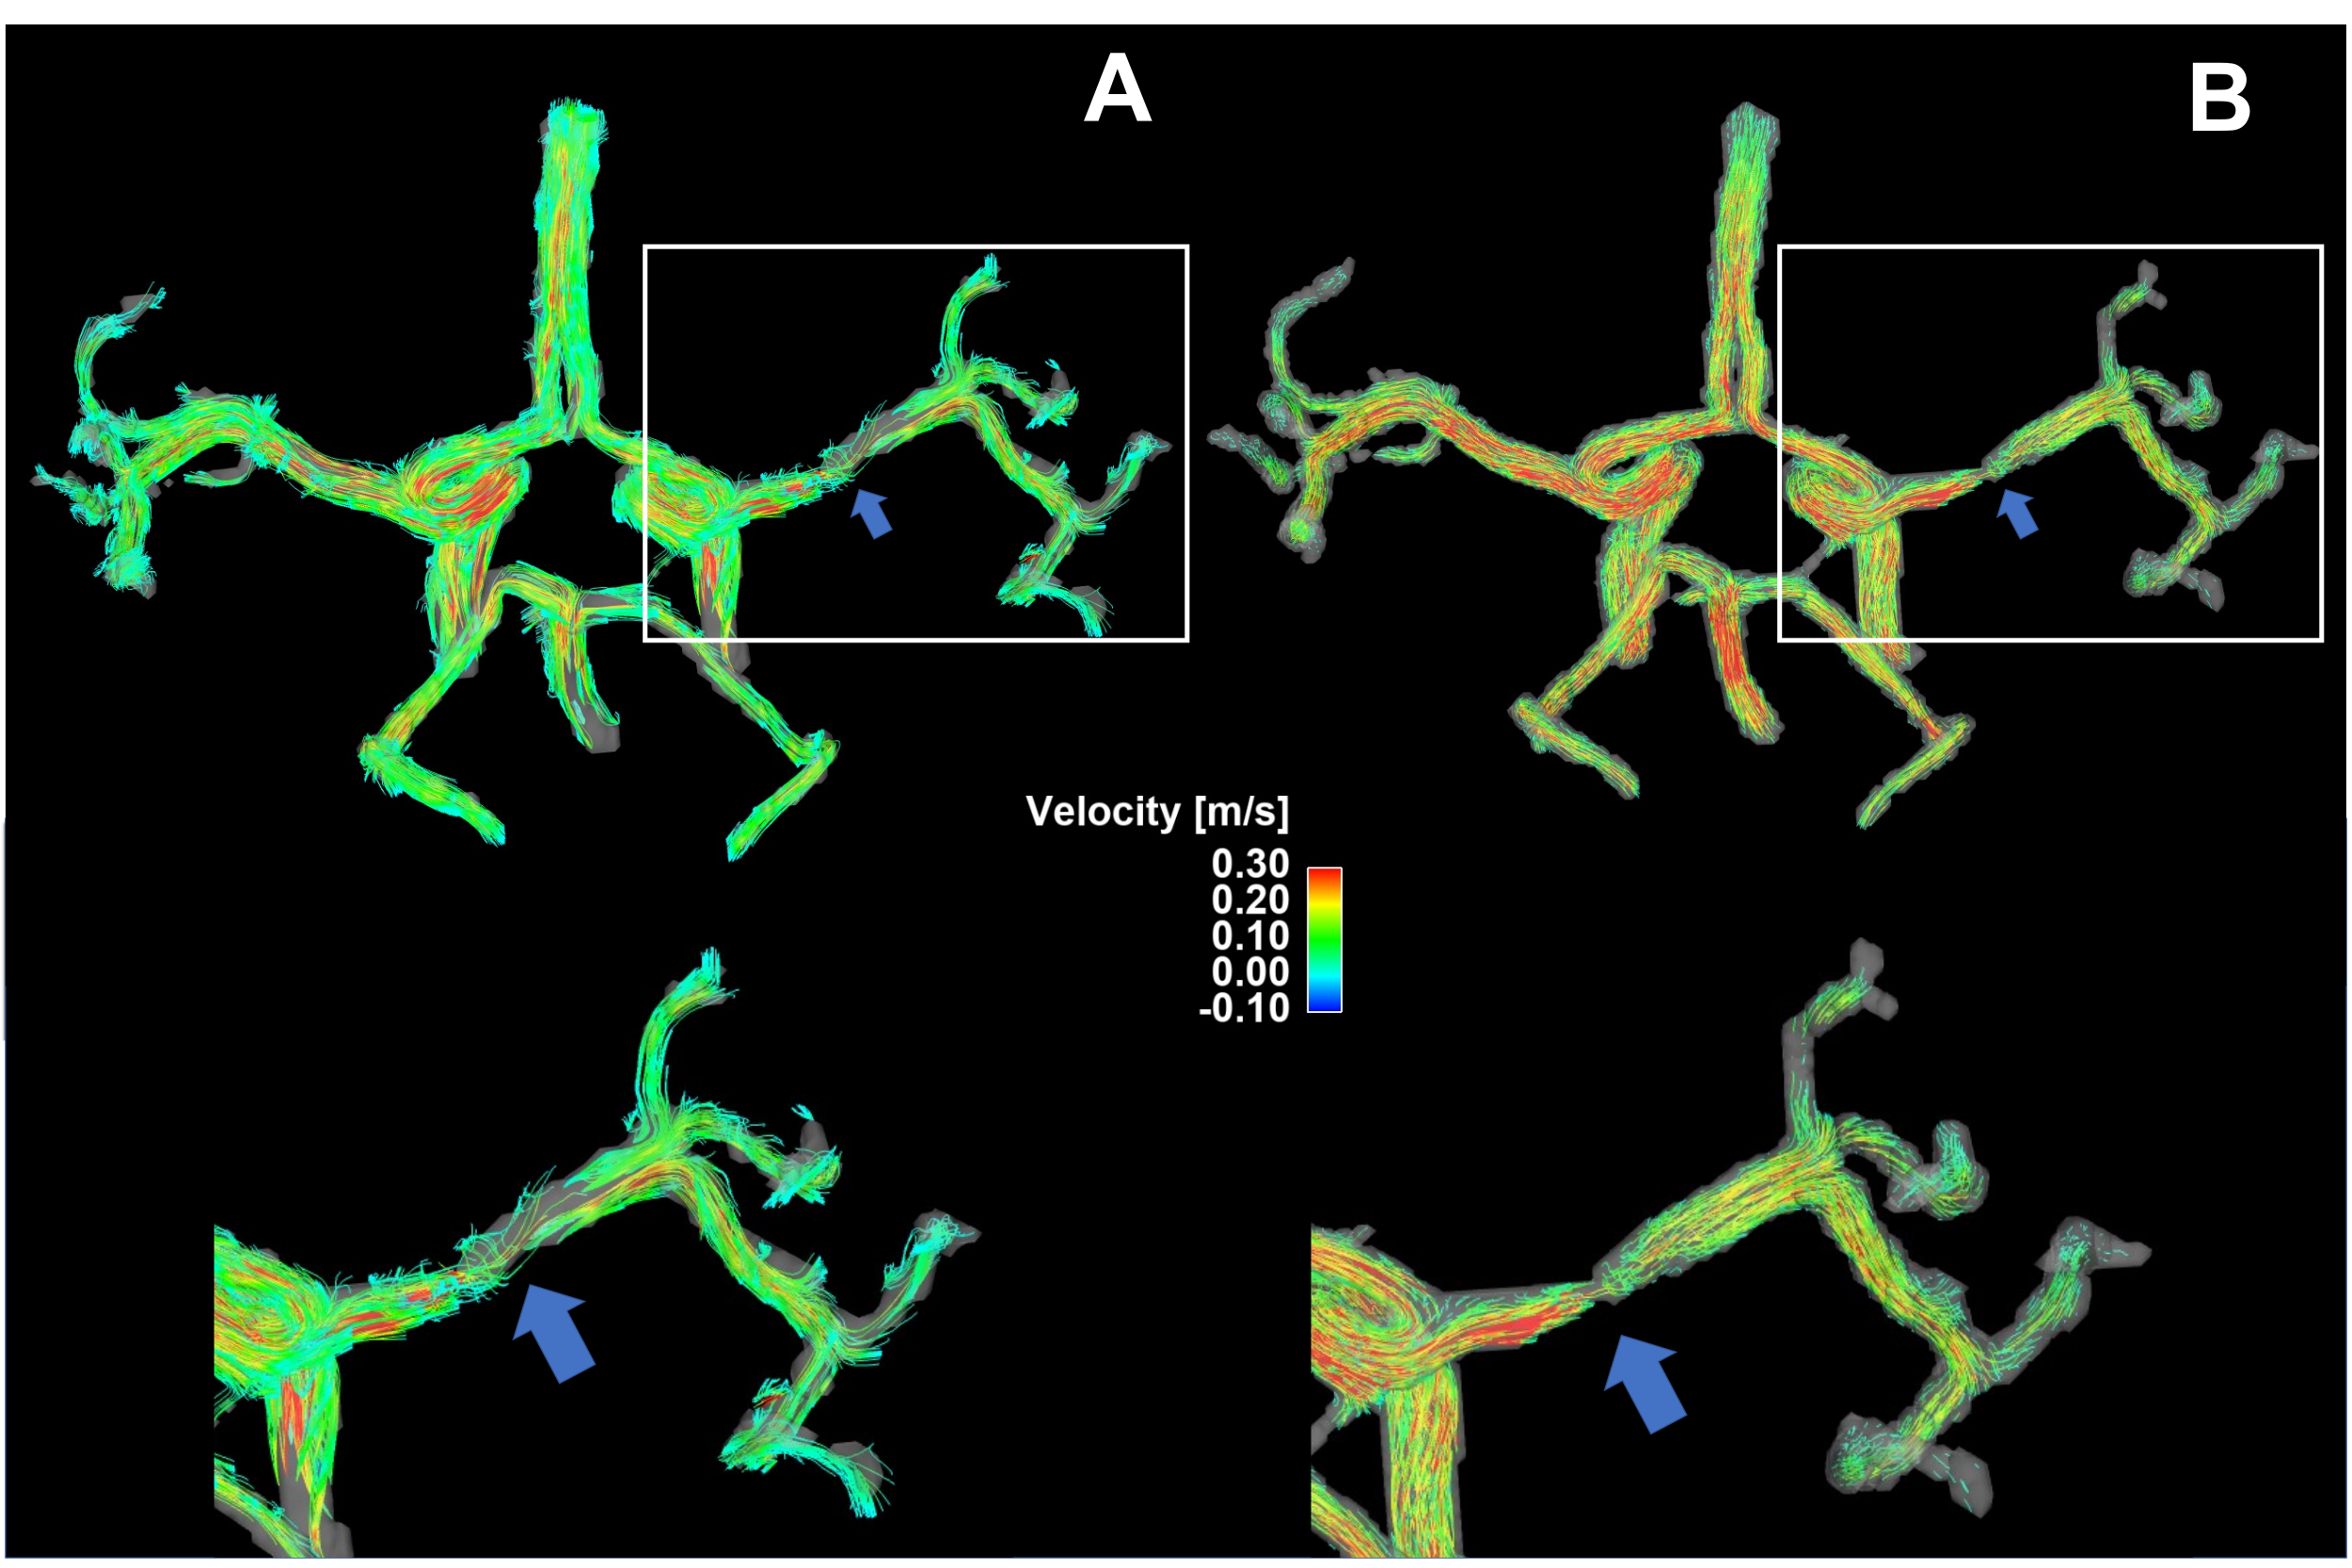
Figure 1: Streamline presentation of the flow through the Circle of Willis and a stenosed right MCA using normal resolution (A) and super resolution (B).
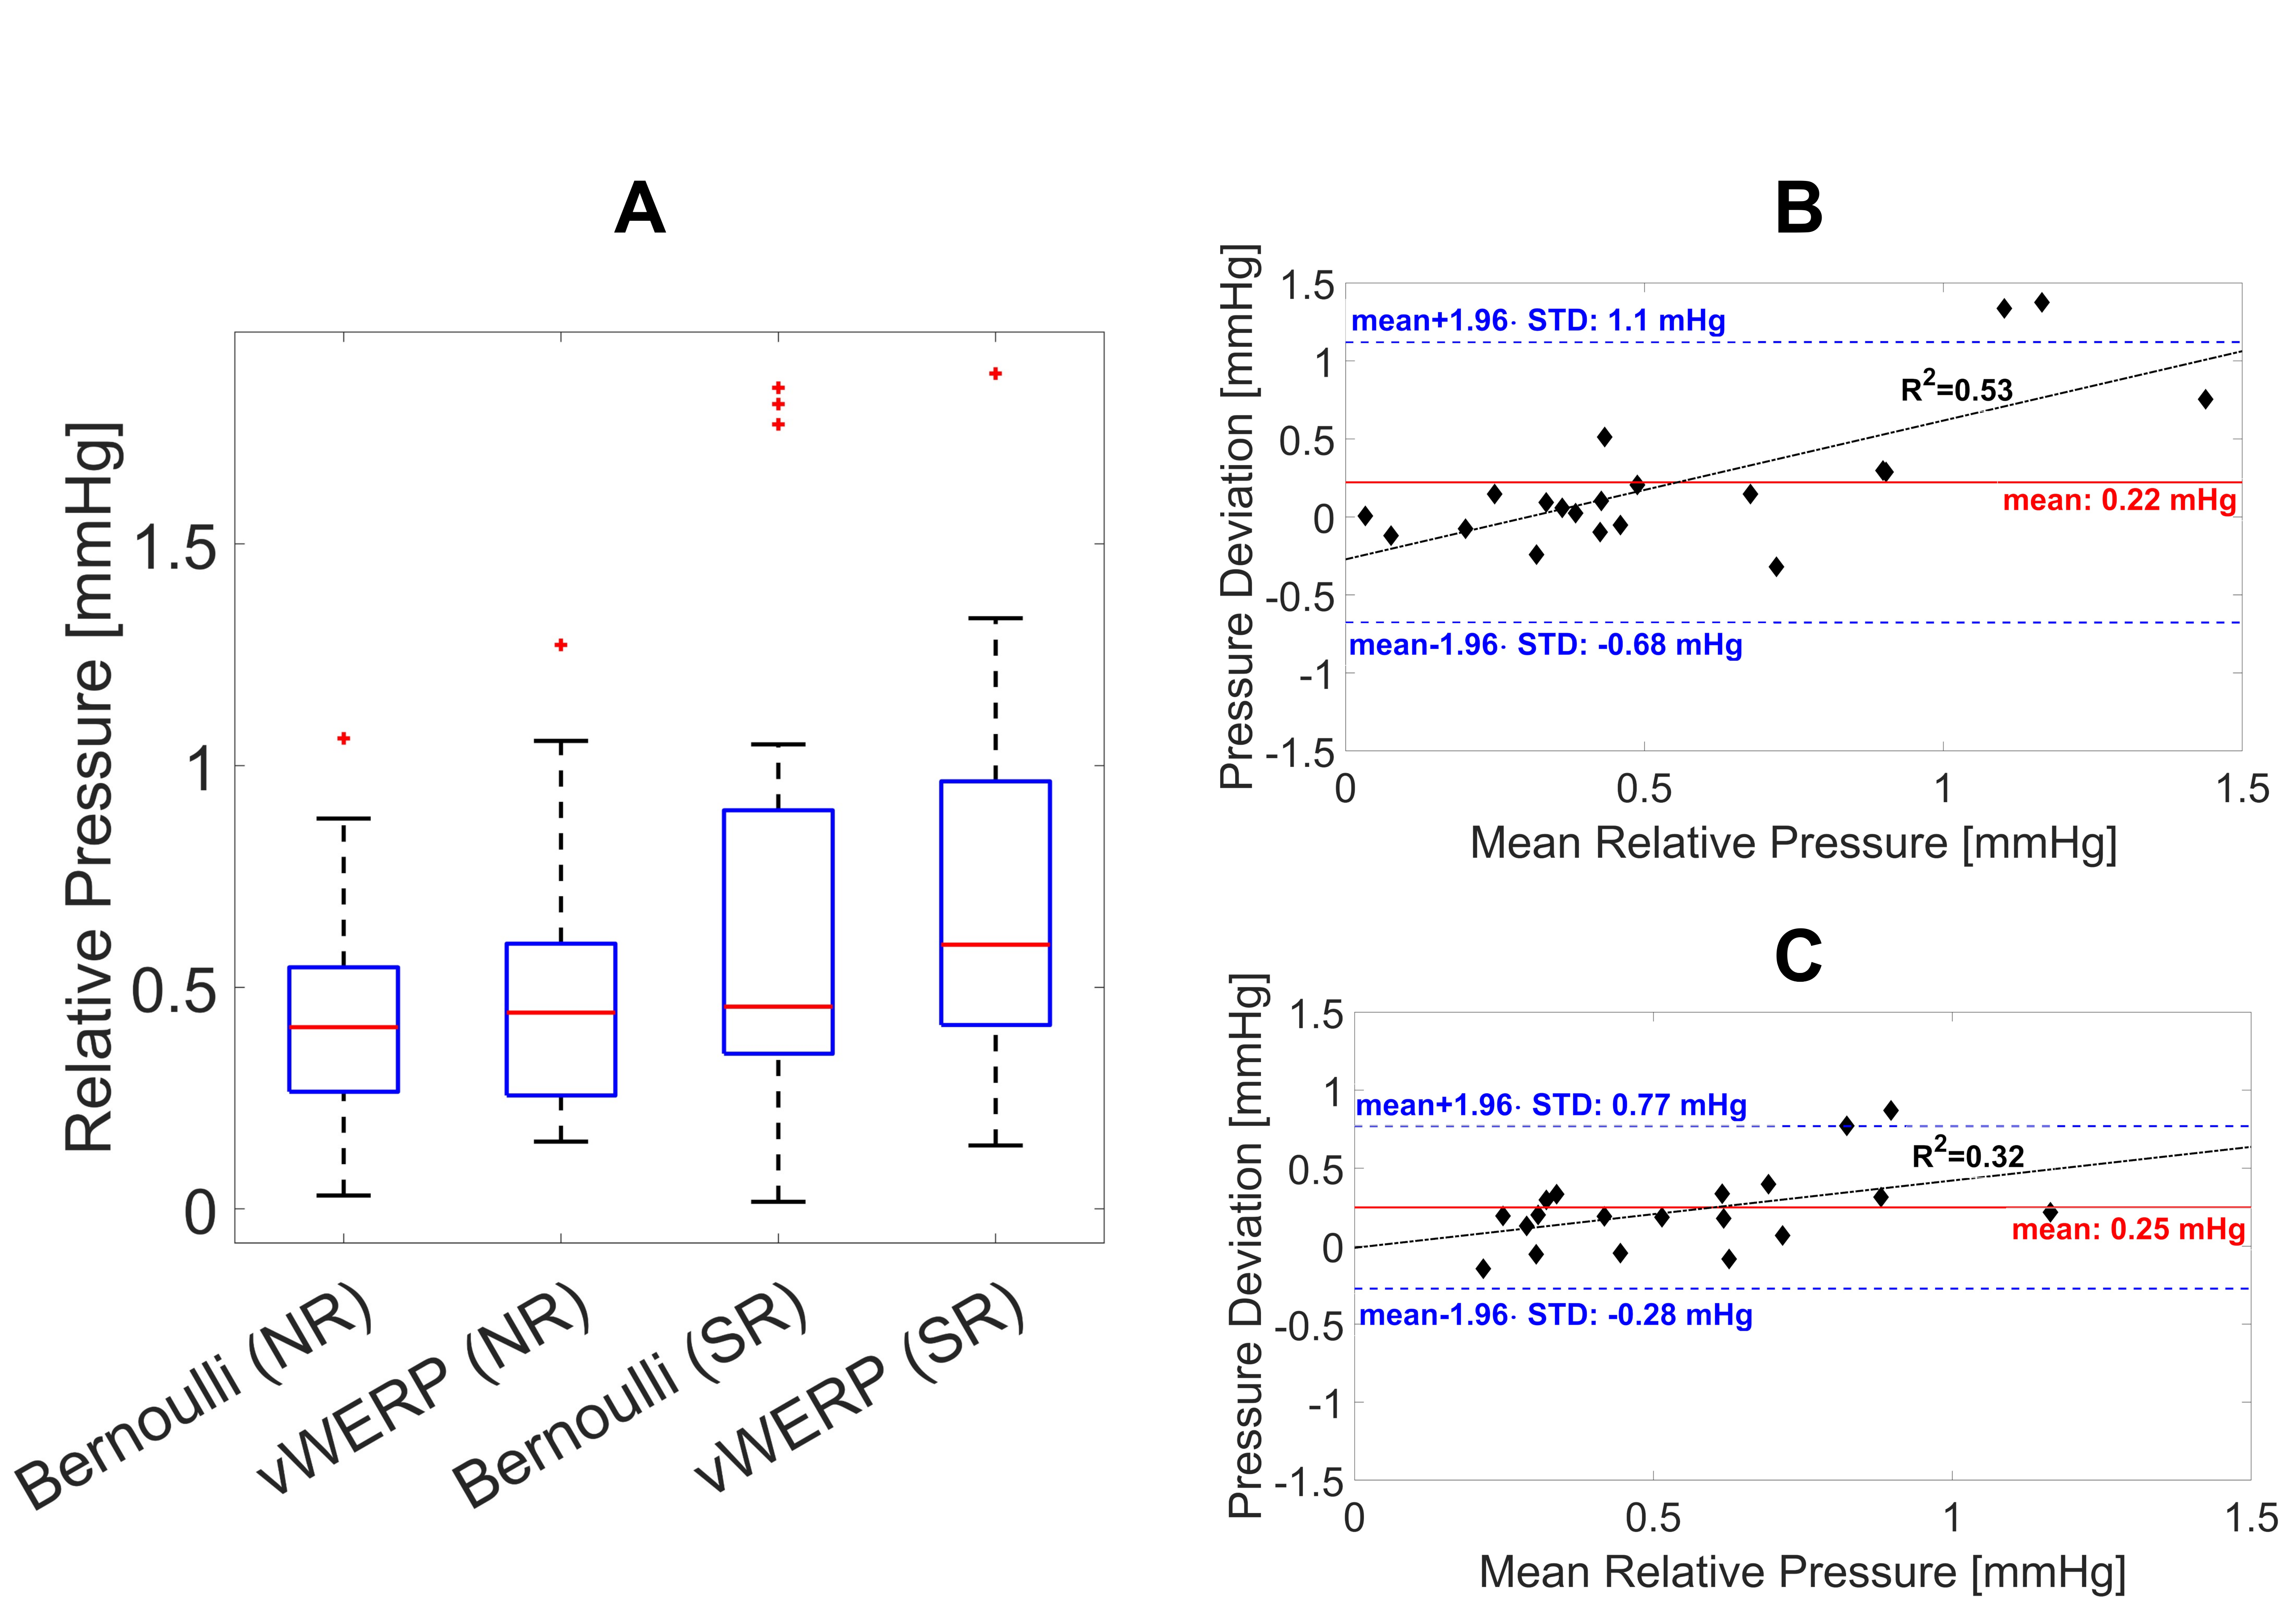
Figure 2: Peak relative pressure calculated with Bernoulli and vWERP in both left
and right MCAs and ICAs in 5 healthy volunteers: A Box plots show that
median relative pressure values are increased in both methods when SR+Bernoulli
is used (outliers are marked with red stars). B+C: Bland-Altman plot to
illustrate the bias and deviation between normal and super-resolution for the
Bernoulli (B) and vWERP (C) analysis. Pressure calculations using
SR results in higher pressure values (mean offset: 0.22 mmHg for
Bernoulli, 0.25 mmHg for vWERP) compared to normal resolution.
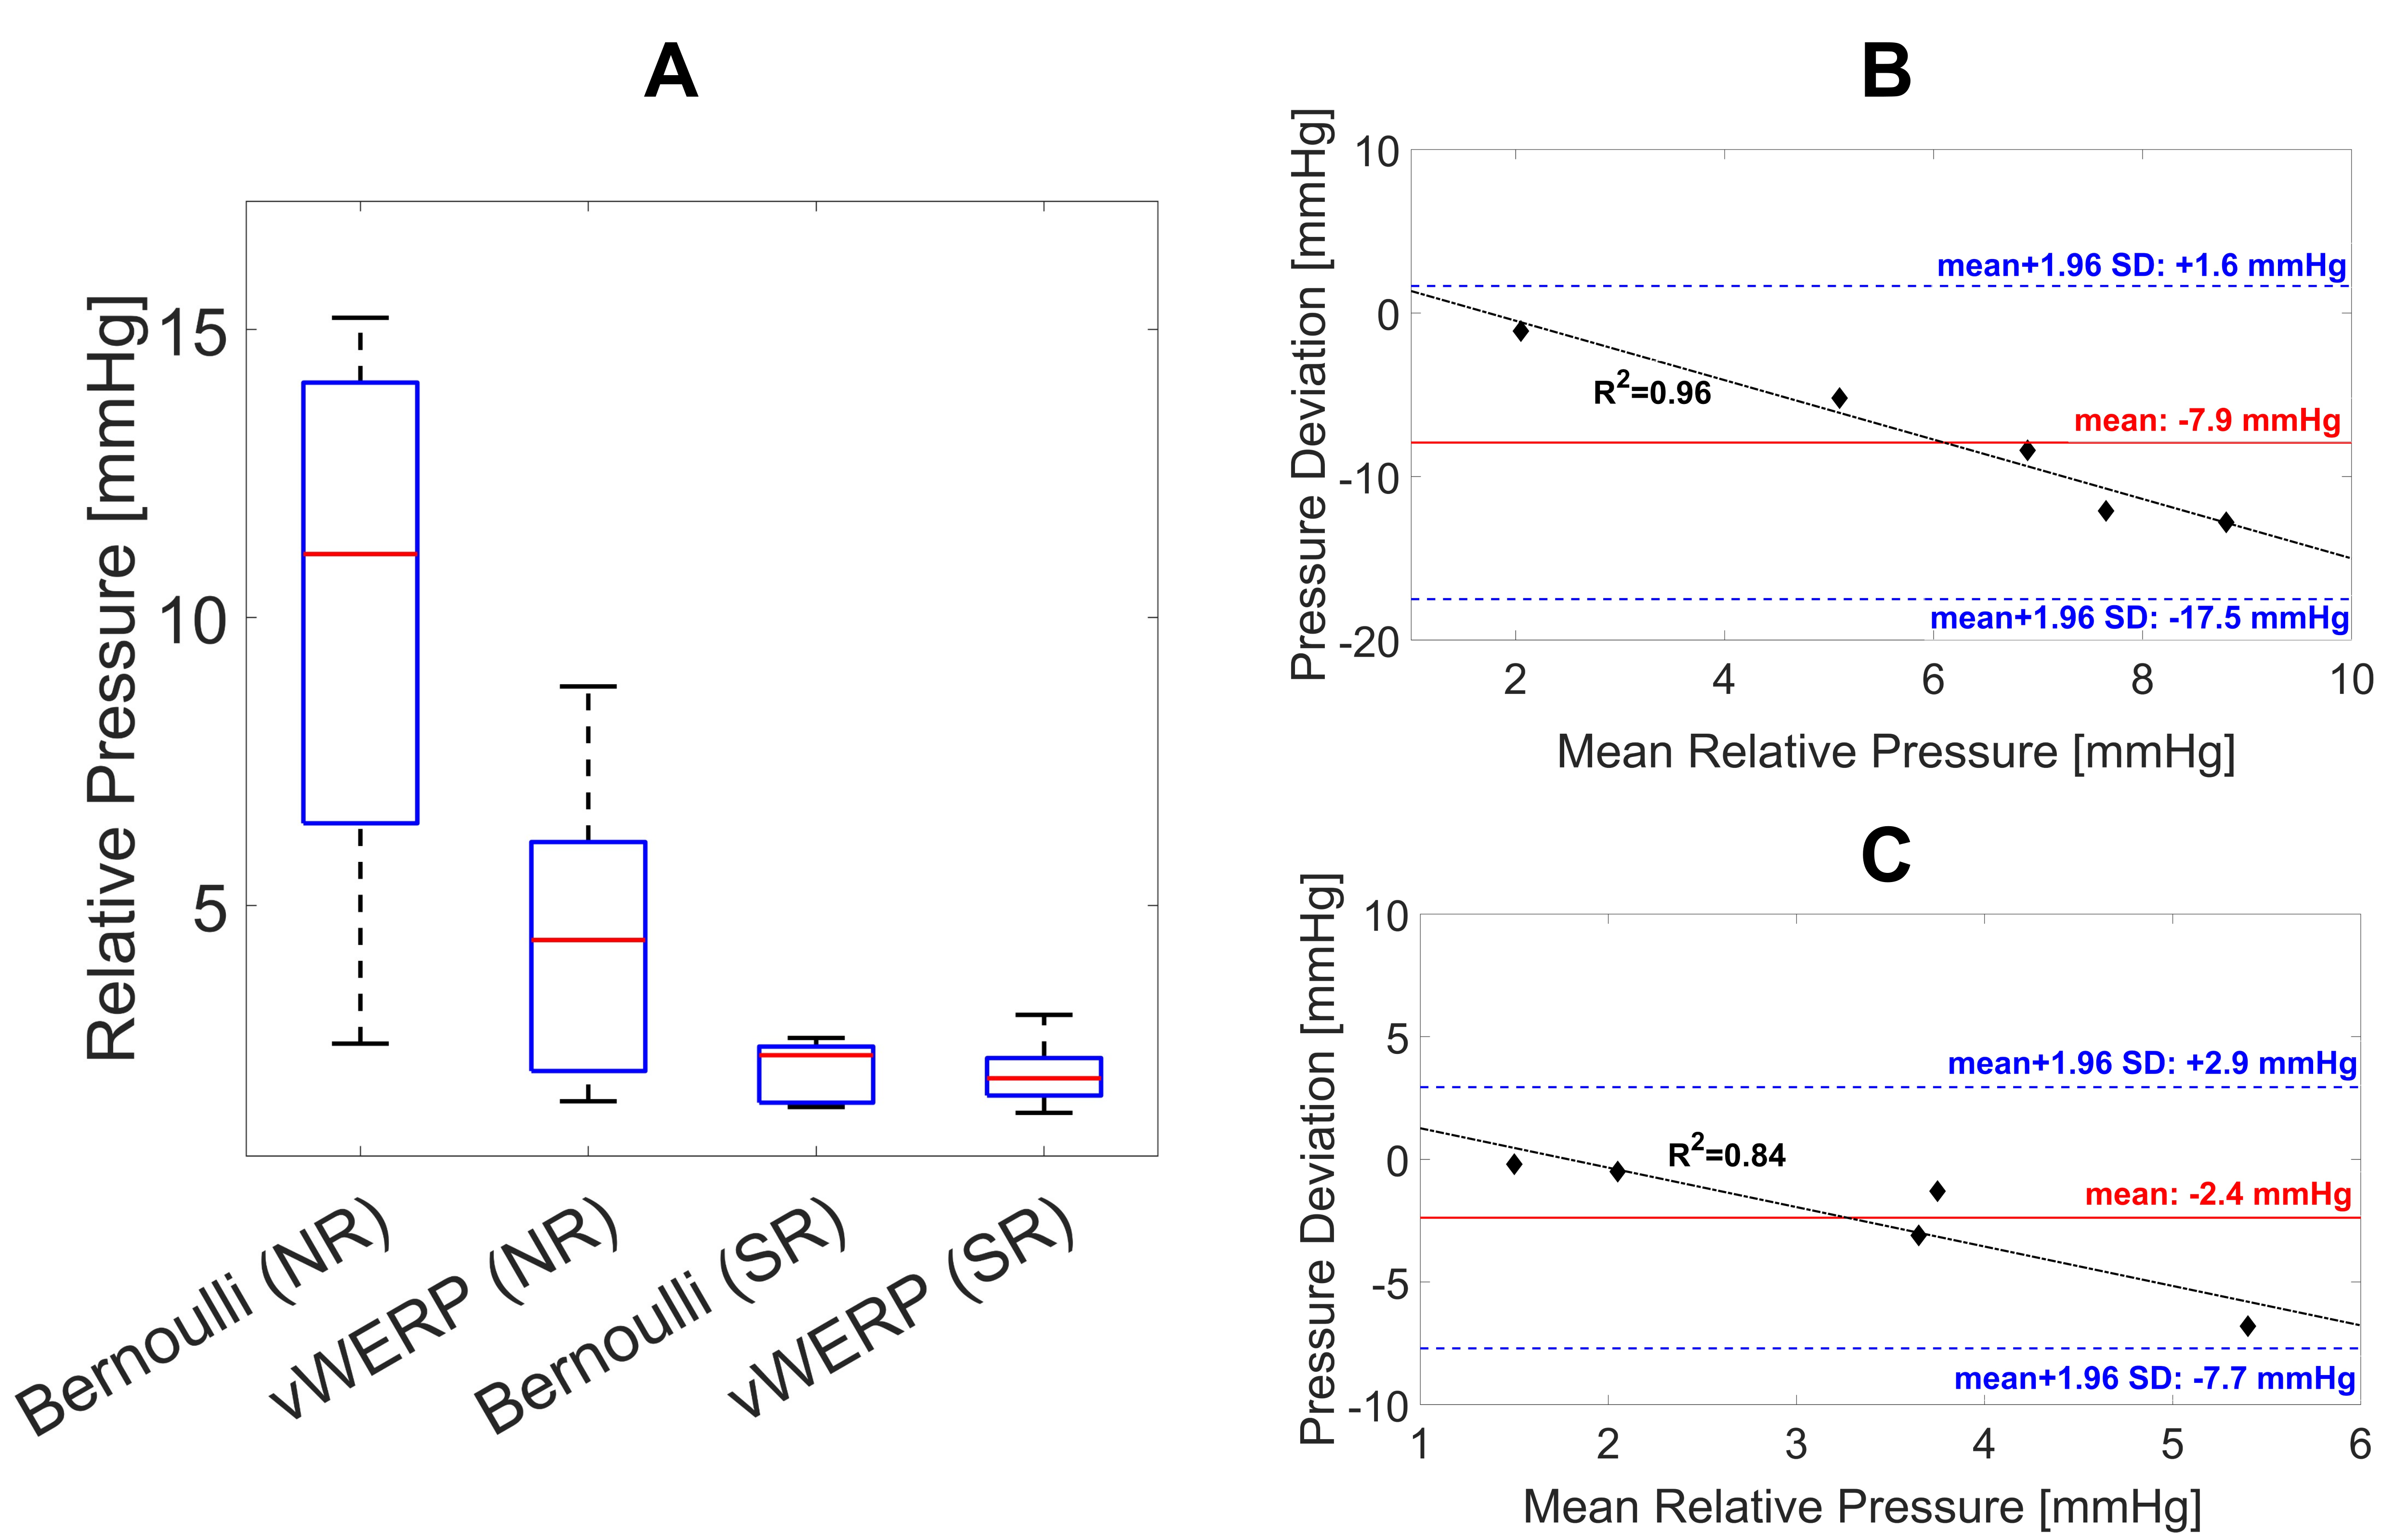
Figure 3: Peak relative pressure
calculated with Bernoulli and vWERP in stenosed arteries of ICAD patients: A
Box plots show that median relative pressure values are decreased in both methods when SR is used. B+C:
Bland-Altman plot to illustrate the bias and deviation between normal and super-resolution
for the Bernoulli (B) and vWERP (C) analysis. Pressure
calculations using SR results in lower pressure values (mean offset: -7.9
± 3.2 mmHg for Bernoulli, -2.4 ± 2.7 mmHg for vWERP) compared to normal
resolution.
DOI: https://doi.org/10.58530/2023/0783