0781
4D-Flow and DCE-MRI Study on the Wall Enhancement of Unruptured Intracranial Aneurysms1The First Affiliated Hospital of Zhengzhou University, Zhengzhou, China, 2University of Washington, Seattle, WA, United States
Synopsis
Keywords: Blood vessels, Stroke, unruptured intracranial aneurysms; aneurysmal wall enhancement; wall enhancement index; Ktrans; wall shear stress
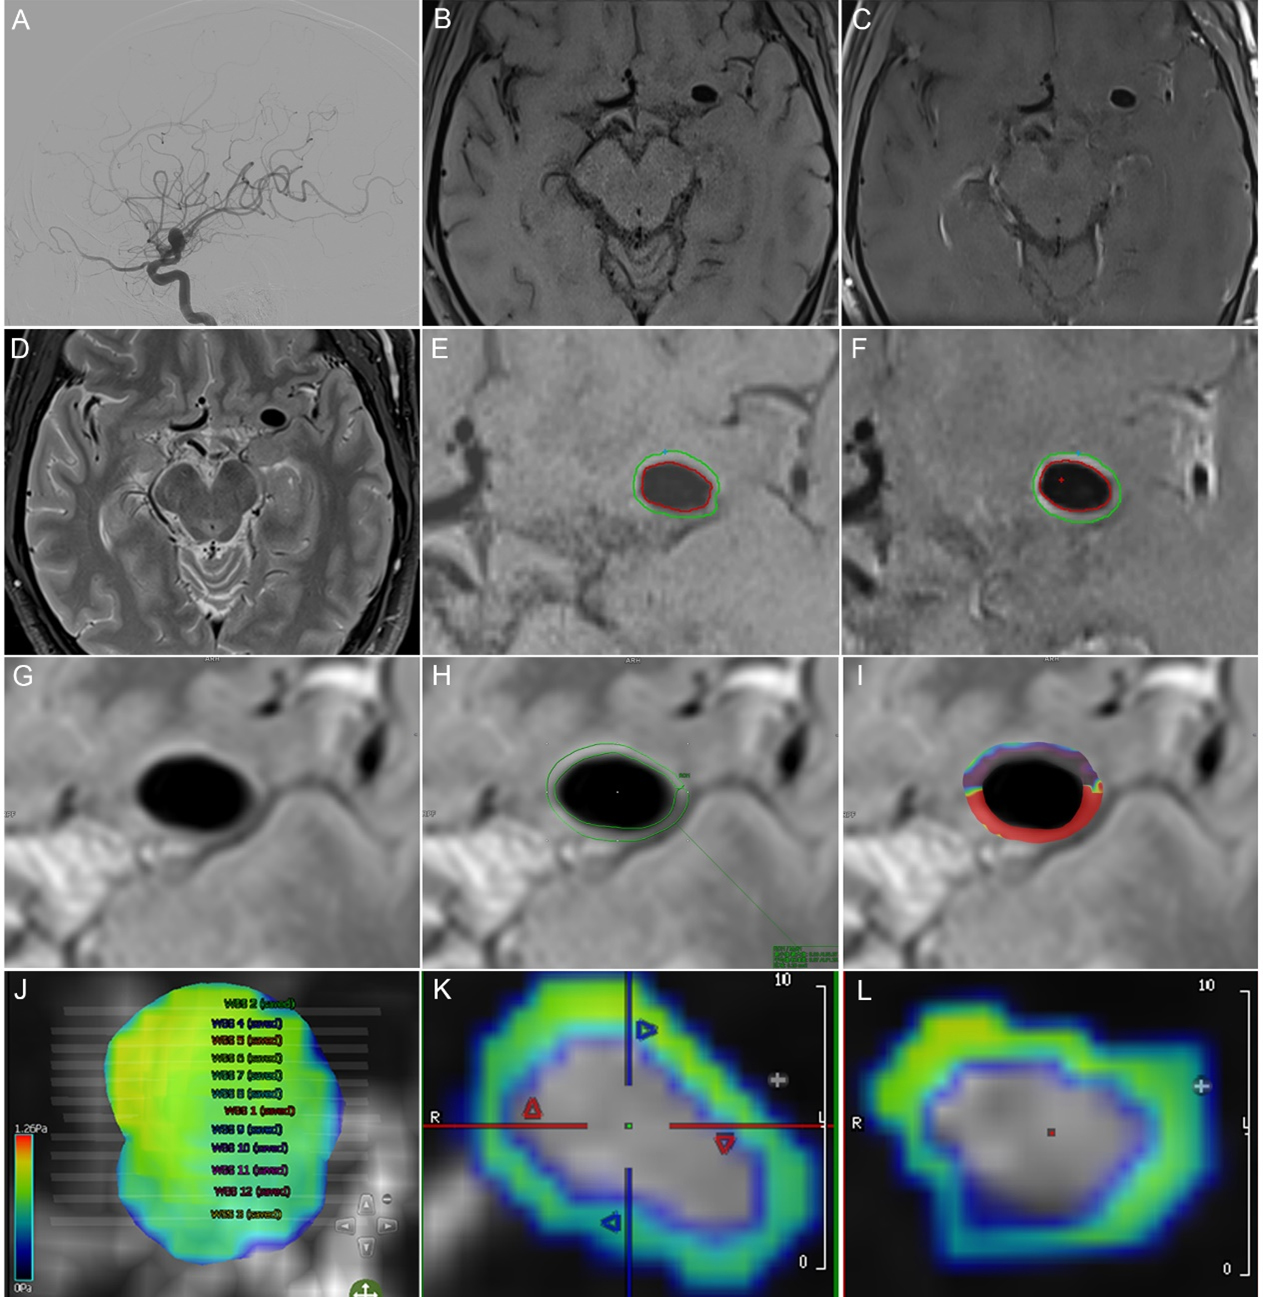
This study used 4D-flow-MRI, dynamic contrast-enhanced MRI, and vessel wall MRI to explore the relationship between wall shear stress (WSS) and Ktrans and aneurysm wall enhancement (AWE) to understand the functional changes in the unruptured intracranial aneurysms (UIAs). Seventy-eight patients were enrolled, including 96 UIAs. All patients completed examinations based on a 3.0T Siemens Prisma magnetic resonance. WSS with the AWE group was lower, and Ktrans with the AWE group were higher than those without AWE. The wall enhancement index (WEI) was a quantitative index of AWE. WEI had a negative correlation with WSS and a positive correlation with Ktrans.Objective
Unruptured intracranial aneurysms (UIAs) rupture cause about 80% of spontaneous non-traumatic subarachnoid hemorrhages (SAH). Gadolinium-enhanced aneurysm wall enhancement (AWE) in vessel wall MRI (VW-MRI) has been proven to be related to the unstable state or rupture risk of UIAs and helped to individualize the risk stratification of the corresponding patients. This discovery expanded the rupture risk assessment method based on aneurysms from UIAs sac anatomy to UIAs wall pathology for the first time. It brought a new perspective and ideas to assessing UIAs rupture risk. AWE might be closely related to the pathological inflammatory response of the aneurysm wall, and the hemodynamic index of UIAs-wall shear stress (WSS) was closely associated with the pathological inflammation of the aneurysm wall. Unstable states such as magnified and ruptured IAs might be related to the intense inflammatory reaction in the aneurysm wall and the endothelial cell apoptosis in the aneurysm wall. Apoptosis of endothelial cells in the UIAs wall might increase the aneurysm wall's permeability, and Ktrans might reflect this change.This study used 4D-flow-MRI, dynamic contrast-enhanced MRI (DCE-MRI), and VW-MRI to explore the relationship between WSS and Ktrans further and AWE to understand the functional changes in the UIAs.
Methods
1. We prospectively collected UIAs patients who underwent 3.0T magnetic resonance 4D-flow-MRI, DCE-MRI, VW-MRI, and DSA in a tertiary hospital from January 2018 to October 2019. All patients completed 4D-flow-MRI, DCE-MRI, and VW-MRI based on a 3.0T Siemens Prisma magnetic resonance scanner (64-channel head and neck combined coil).2. Two experienced neuroimaging radiologists independently performed a blind analysis of the 4D-flow-MRI of UIAs through CVI42 5.11.2 software and calculated the hemodynamic index -WSS of the corresponding aneurysm.
3. Two experienced neuroimaging radiologists independently performed blind analysis on the DCE-MRI of UIAs through the Siemens syngo.via workstation TISSUE 4D software and calculated Ktrans.
4. Two senior neuroimaging radiologists independently performed a blind reading on the PACS platform to determine whether AWE appeared in UIAs.
5. Two experienced neuroimaging radiologists independently conducted a blind analysis of the VW-MRI of UIAs through Vessel-MASS 2014-EXP software and calculated the semi-quantitative index of AWE- wall enhancement index (WEI).
6. A neuroimaging radiologist calculated the PHASES score to assess the rupture risk of each UIA quantitatively.
7. We used MedCalc 18.2 software for statistical processing. Percentages represented categorical variables; continuous variables were described by χ ± s or median (interquartile range). The Kappa test was used to evaluate the consistency of AWE and its classification by two radiologists. We used the Bland-Altman diagram, Passing and Bablok regression, and ICC to evaluate the consistency of WSS, Ktrans, and WEI among the two medical practitioners. The χ2 test was used to compare categorical variables between groups, and the U test was used to compare continuous variables between groups. Selected target variables and included univariate logistic regression analysis. Multivariate logistic regression analysis included variables with a univariate regression analysis result P <0.05. Spearman correlation analysis was used to analyze the correlation between continuous variables. A scatterplot with a regression line was used to show the quantity change trend among constant variables. P <0.05 was considered statistically significant.
Result
1. This study included seventy-eight patients with 96 UIAs. The inter-reader agreement was excellent for both the presence of AWE (k = 0.85 [95% CI: 0.75 to 0.96]) and the calculation of WSS (ICC= 0.94 [95% CI: 0.91 to 0.96]), Ktrans (ICC = 0.97 [95% CI: 0.95 to 0.98]) and WEI (ICC = 0.99 [95% CI: 0.99 to 1]).2. Compared with UIAs without AWE, the median of WSS with AWE was lower (1.8 versus 3.4 Pa; P < 0.001), the median Ktrans with AWE was higher (2.3 versus 0.9 s-1; P < 0.001), the median WEI with AWE was higher (4.2 versus 0.8; P < 0.001) and the average number of PHASES scores with AWE was higher (7.3 versus 3.3; P <0.001).
3. Multivariate logistic regression revealed that WSS (OR, 0.70; 95% CI, 0.52 to 0.93; P = 0.011) was the independent protective factor associated with AWE and Ktrans (OR, 1.69; 95% CI, 1.17 to 2.44; P = 0.01) was the only independent risk factors related to AWE.
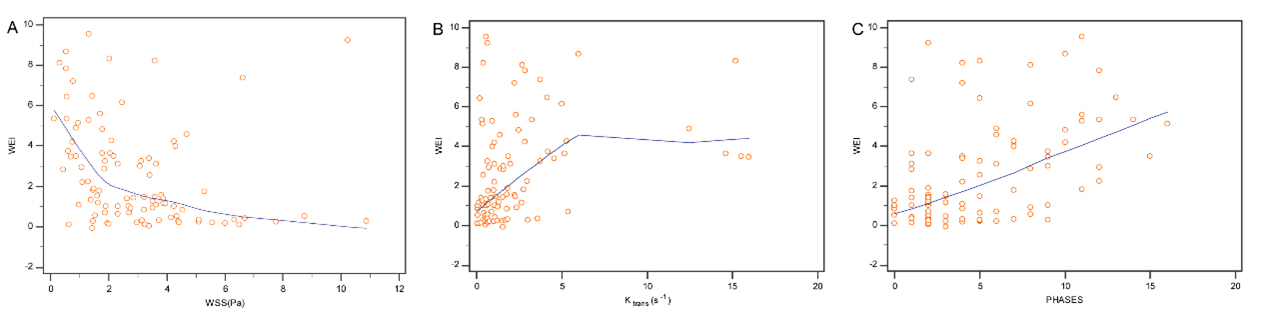
4. There was a negative correlation between the WEI and the WSS (rs = -0.5, P < 0.001, 95% CI: -0.59 to -0.27), a positive correlation between the WEI and the Ktrans (rs = 0.4, P < 0.001, 95% CI: 0.24 to 0.57) and a positive correlation between WEI and PHASES scores (rs = 0.5, P <0.001, 95% CI: 0.31 to 0.62).
Conclusion
1. WSS with the AWE group was lower than without the AWE group. The Ktrans, WEI, and PHASES scores of the group with AWE were higher than those without AWE. WEI had a negative correlation with WSS. WEI was positively correlated with Ktrans and PHASES scores.2. WSS was an independent protective factor for AWE in UIAs, and Ktrans was an independent risk factor for AWE in UIAs.
Keywords
magnetic resonance imaging; unruptured intracranial aneurysms; aneurysmal wall enhancement; wall enhancement index; Ktrans; wall shear stressAcknowledgements
This work was supported by the National Natural Science Foundation of China (Grant 82202105 to Dr. Qichang fu) and the Joint construction project in Henan Province (Grant LHGJ20220406 to Dr. Qichang fu).References
[1] Fu Q, Guan S, Liu C, et al. Clinical Significance of Circumferential Aneurysmal Wall Enhancement in Symptomatic Patients with Unruptured Intracranial Aneurysms: a High-resolution MRI Study[J]. Clin Neuroradiol, 2017.DOI:10.1007/s00062-017-0598-4.
[2] Fu Q, Wang Y, Zhang Y, et al. Qualitative and Quantitative Wall Enhancement on Magnetic Resonance Imaging Is Associated With Symptoms of Unruptured Intracranial Aneurysms[J]. Stroke (1970), 2021,52(1):213-222.DOI:10.1161/STROKEAHA.120.029685.
[3] Zhang Y, Fu Q, Wang Y, et al. Qualitative and Quantitative Wall Enhancement Analyses in Unruptured Aneurysms Are Associated With an Increased Risk of Aneurysm Instability[J]. Frontiers in Neuroscience, 2020,14.DOI:10.3389/fnins.2020.580205.
[4] Zhang M, Peng F, Tong X, et al. Associations between haemodynamics and wall enhancement of intracranial aneurysm[J]. Stroke and Vascular Neurology, 2021,6(3):467-475.DOI:10.1136/svn-2020-000636.
[5] Wang Y, Sun J, Li R, et al. Increased aneurysm wall permeability colocalized with low wall shear stress in unruptured saccular intracranial aneurysm[J]. Journal of Neurology, 2022,269(5):2715-2719.DOI:10.1007/s00415-021-10869-z.
[6] Kang H, Tian D C, Yang X, et al. A Randomized Controlled Trial of Statins to Reduce Inflammation in Unruptured Cerebral Aneurysms[J]. JACC Cardiovasc Imaging, 2022,15(9):1668-1670.DOI:10.1016/j.jcmg.2022.04.006.
Figures