0780
VICTR: Venous transit time (VTT) Imaging by Changes in T1 Relaxation1Department of Biomedical Engineering, Johns Hopkins University School of Medicine, Baltimore, MD, United States, 2Department of Radiology & Radiological Science, Johns Hopkins University School of Medicine, Baltimore, MD, United States, 3Department of Neurology, Johns Hopkins University School of Medicine, Baltimore, MD, United States
Synopsis
Keywords: Blood vessels, Blood
Venous hemodynamics is not well-studied despite it is a crucial part of human vascular system and involves in many brain vascular diseases. Here, we developed a novel technique dubbed Venous transit time Imaging by Changes in T1 Relaxation (VICTR) to measure the time for blood to travel from capillary to veins, i.e., VTT. We verified VICTR on different locations of superior sagittal sinus and VTT showed regional dependency. The caffeine challenge study also validated VTT with the vasoconstriction effect. With excellent test-retest reproducibility, VTT may be a potential physiological biomarker to evaluate vessel tortuosity and detect venous pathologies.Introduction
The cerebral venous vessels constitute a crucial part of the human vascular system1–3. However, venous hemodynamics, unlike its arterial counterpart, is rarely studied4. Here, we introduce a new MRI technique to measure venous transit time (VTT), which denotes the time for the blood to travel from capillary to veins, e.g., superior sagittal sinus (SSS). This novel sequence is dubbed Venous transit time Imaging by Changes in T1 Relaxation (VICTR). We demonstrated the proof-of-principle of the technique and verified VICTR by the known flow trajectory of SSS and a physiological challenge using caffeine, with test-retest reproducibility also evaluated.Theory and pulse sequence
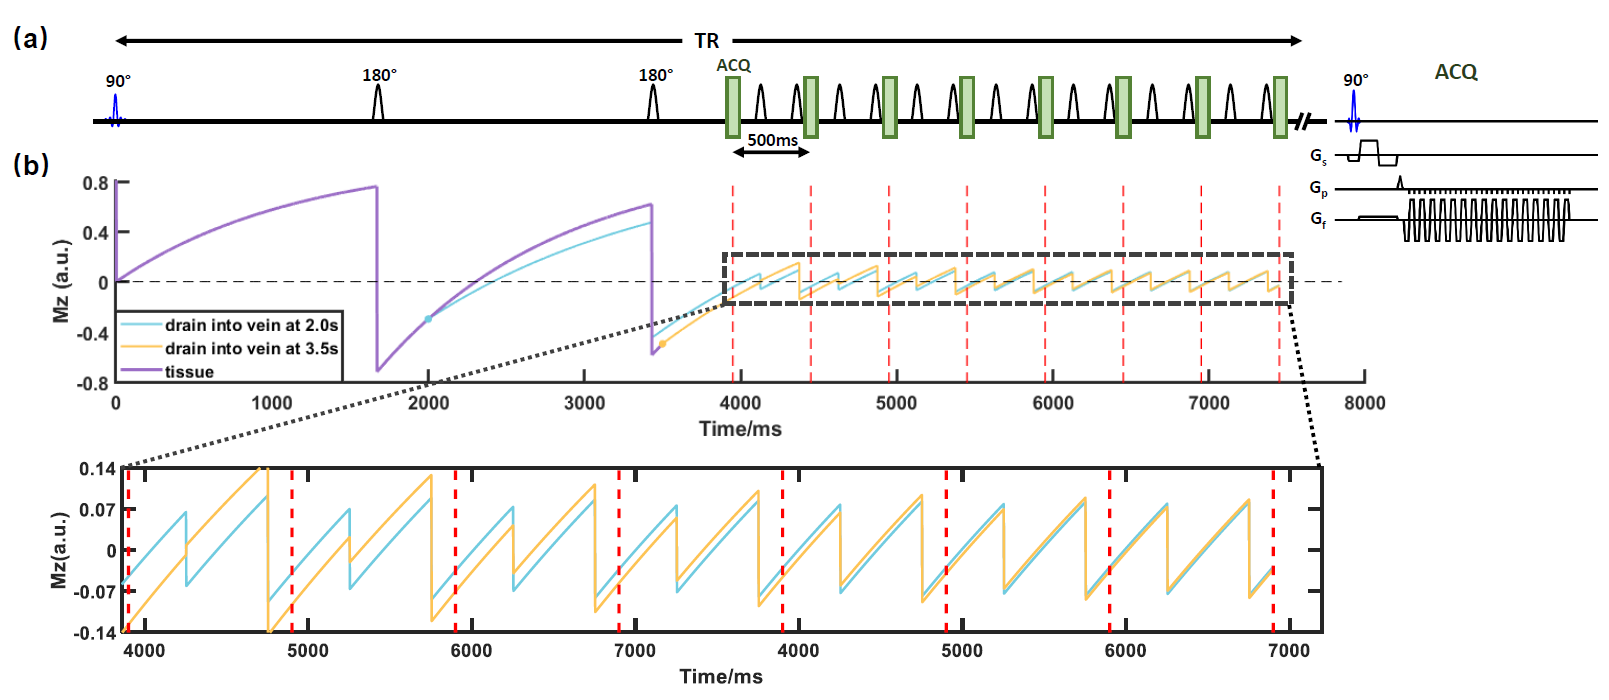
Let us consider the water spins measured in the veins, e.g., SSS. The vast majority of them originally come from tissue through capillary-tissue exchange. The longitudinal relaxation of these spins, therefore, follows a two-phase process: the spins first relax with tissue $$$T_{1,t}$$$. Once exchanged into the blood compartment, they will recover with blood $$$T_{1,b}$$$. The time the spins spend in each phase is dependent on the VTT $$$\delta_{VTT}$$$. For a simple saturation recovery sequence, the MR signal in the SSS at the time of RF excitation can therefore be written as:$$M_v(t)=M_0(1-e^{-\frac{t-\delta_{VTT}}{T_{1,t}}-\frac{\delta_{VTT}}{T_{1,b}}}), t>\delta_{VTT}$$
Therefore, in principle, one only needs measurements at two time points, as $$$\delta_{VTT}$$$ and $$$M_0$$$ are the only two unknowns. In reality, however, VTT of different spins at SSS may vary and should follow a distribution. In this work, we modeled the VTT as a discrete distribution with 200 bins from 0 to 6 seconds.
In the actual sequence (Figure 1), two background-suppression pulses are placed before the excitation RF pulse to reduce the baseline signal and highlight the VTT effect on the signal. The effect of these background-suppression pulses can be simply accounted for by modifying Eq.[1] using the Bloch equation.
Sequence design: Figure 1 illustrates the sequence, dubbed VICTR, used for the experiments. In principle, different time points need to be measured in different TRs. Here, by taking the advantage of the complete refreshing of the flowing spins in SSS, we applied a Look-Locker-like multi-phase sampling to accelerate the acquisition by 8 folds. To allow the sequence to sufficiently encode different VTT distributions, we used 30 different post-saturation delays, with corresponding 30 different TRs. To isolate pure SSS signal without tissue contaminations, we used a bipolar gradient (inset in Figure 1a) combined with complex subtraction to obtain the SSS signal.
Methods
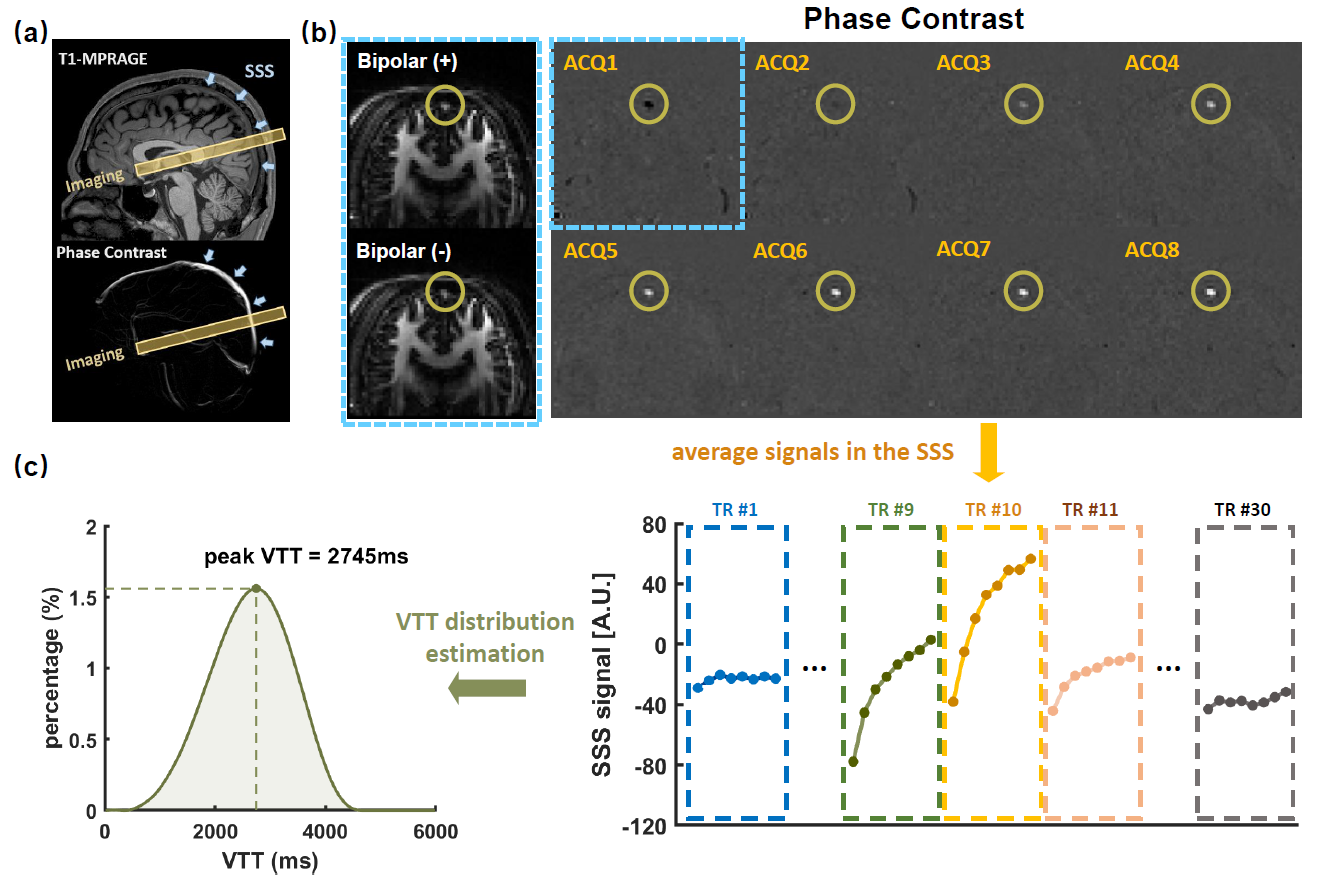
Imaging protocol: All experiments were performed on a Siemens Prisma 3T. VICTR was performed with the following parameters: 30 TRs ranging from 6146 ms to 8321 ms with an increment of 75ms, FOV=150×150mm2, voxel size=2.3×2.3×10mm3, VENC=35cm/s, scan time=14.8 minutes.VTT estimation: Figure 2a shows typical VICTR slice positioning. Figure 2b shows VICTR images before and after complex subtraction. Signs of magnetization have been considered. Each VICTR scan results in a signal series $$$\boldsymbol{S}_v$$$ of 240 time points, i.e., 8 excitations×30TRs (Figure 2c), which is expected to be unique for each VTT distribution. To estimate the underlying VTT distribution $$$\boldsymbol{u}$$$, we solved a non-negative constrained inverse problem under the regularization $$$\boldsymbol{\Gamma}$$$ that the distribution was smooth,
$$\hat{\boldsymbol{u}} =arg\min_{\boldsymbol{u}}{||\boldsymbol{S}_v-\boldsymbol{E}\boldsymbol{u}||}_2^2+\lambda^2{||\boldsymbol{\Gamma} \boldsymbol{u}||}_2^2, \space\space\space s.t.\boldsymbol{u\ge 0}$$
where $$$||\cdot ||$$$ is the $$$L_2$$$ Euclidean norm. Other assumed parameters were: $$$T_{1,b}$$$=1584ms5 and $$$T_{1,t}$$$=1165ms6 at 3T. To further reduce the VTT distribution (histogram) into a single value for statistical comparison, we identified the peak VTT value in the histogram as pVTT (Figure 2c).
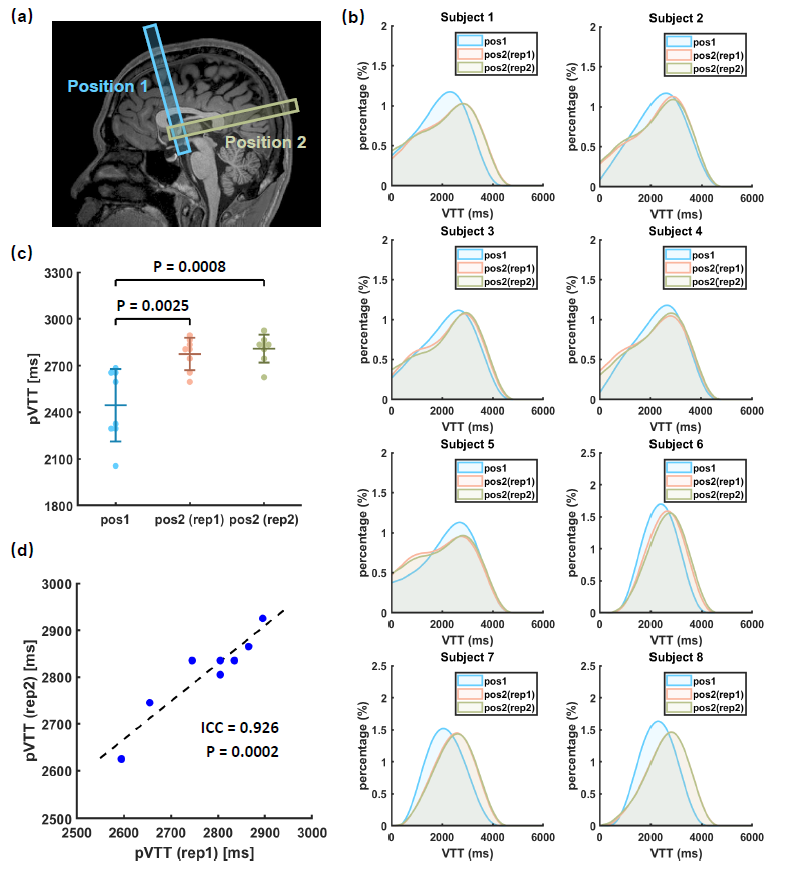
Study 1: Feasibility, location dependence of VTT, and reproducibility: Eight healthy volunteers (28.0±9.4yrs, 3M/5F) were studied. We performed VICTR at two different locations along the SSS (Figure 3a), one in the anterior SSS (position 1) and the other in the posterior part (position 2). We also examined the test-retest reproducibility of the VTT measured at position 2.
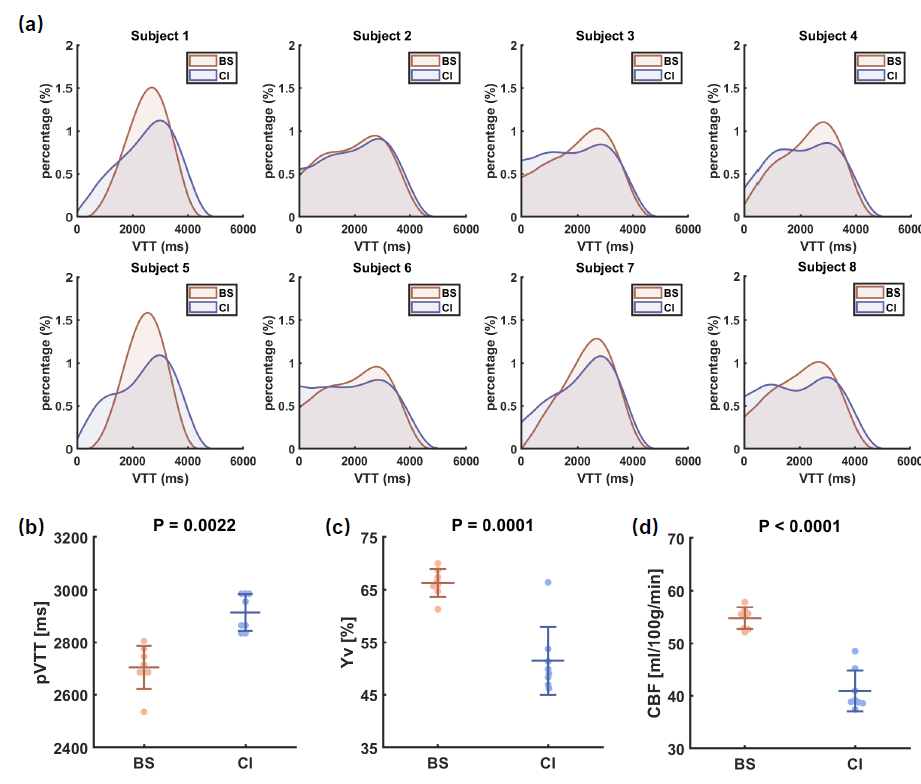
Study 2: Caffeine challenge: Eight healthy volunteers (23.3±2.5yrs, 5M/3F) were recruited. A caffeine ingestion study was performed to investigate VTT changes under a vasoconstrictive physiological challenge. Each subject underwent a baseline session and another session after taking a 200mg caffeine tablet. Cerebral venous oxygenation (Yv) and global cerebral blood flow (CBF) were also measured using TRUST7 and phase-contrast MRI8, respectively.
Results and Discussion
Study 1: Figure 3b shows the estimated VTT histograms for each subject. It can be observed that the VTT histograms at position 2 (posterior SSS) always lag behind that at position 1 (anterior SSS), consistent with the known flow direction in SSS. Figure 3c displays a summary of pVTT values. It was found that pVTT at position 2 is significantly longer than that at position 1 (p=0.0025/0.0008 for the two repetitions). Between the two repetitions of measures at posterior SSS, there was an excellent test-retest reproducibility (Figure 3d, ICC=0.926, p=0.0002).Study 2: Figure 4 shows a summary of the caffeine challenge study. Figure 4a displays VTT histograms of each subject. pVTT was significantly prolonged (p=0.0022) after caffeine ingestion (Figure 4b), due to a vasoconstriction effect of this drug as confirmed by significant decreases in Yv (p=0.0001, Figure 4c) and CBF (p<0.0001, Figure 4d).
Conclusion
In this work, we developed and verified a non-invasive MRI technique to measure VTT, which may be a physiological biomarker to evaluate vessel tortuosity and detect venous pathologies.Acknowledgements
No acknowledgement found.References
1. Wilson M H. Monro-Kellie 2.0: The dynamic vascular and venous pathophysiological components of intracranial pressure. J. Cereb. Blood Flow Metab, 2016;36(8):1338-1350.
2. Biousse V, Ameri A, Bousser M G. Isolated intracranial hypertension as the only sign of cerebral venous thrombosis. Neurology, 1999;53(7):1537-1537.
3. Mooney M A, Zabramski J M. Developmental venous anomalies. Handb. Clin. Neurol., 2017; 143:279-282.
4. Schuchardt F, Schroeder L, Anastasopoulos C, et al. In vivo analysis of physiological 3D blood flow of cerebral veins. Eur. Radiol, 2015;25(8):2371-2380.
5. Lu H, Clingman C, Golay X, et al. Determining the longitudinal relaxation time (T1) of blood at 3.0 Tesla. Magn. Reson. Med, 2004;52(3):679-682.
6. Lu H, Nagae‐Poetscher L M, Golay X, et al. Routine clinical brain MRI sequences for use at 3.0 Tesla. J. Magn. Reson. Imaging An Off. J. Int. Soc. Magn. Reson. Med, 2005;22(1):13-22.
7. Lu H, Ge Y. Quantitative evaluation of oxygenation in venous vessels using T2‐relaxation‐under‐spin‐tagging MRI. Magn. Reson. Med. An Off. J. Int. Soc. Magn. Reson. Med, 2008;60(2):357-363.
8. Aslan S, Xu F, Wang P L, et al. Estimation of labeling efficiency in pseudocontinuous arterial spin labeling. Magn. Reson. Med., 2010, 63(3): 765-771.
Figures