0770
Free-breathing 3D Stack-of-Spiral Cardiac Quantitative Susceptibility Mapping for Noninvasive Measurement of Cardiac Chamber Oxygenation1Biomedical Engineering, Cornell University, Ithaca, NY, United States, 2Radiology, Weill Cornell Medicine, New York, NY, United States, 3Medicine, Weill Cornell Medicine, New York, NY, United States, 4Applied and Engineering Physics, Cornell University, Ithaca, NY, United States
Synopsis
Keywords: Oxygenation, Motion Correction
A free-breathing 3D stack-of-spiral data acquisition was developed for motion-free cardiac quantitative susceptibility mapping, to tackle the challenge where even a short breath-hold is difficult for patients to perform. ECG and respiratory bellow signal were recorded for retrospective motion binning. A 5D dataset incorporating additional cardiac and respiratory phase dimensions were reconstructed with joint spatiotemporal regularization to generate a motion-free cardiac QSM. In healthy volunteers, this method was compared with a motion-averaged reconstruction and with a separate breath-hold spiral cardiac QSM using Cartesian navigator QSM as reference. Equivalent right-to-left heart chamber differential blood oxygenation was observed among all method studied.Introduction
Cardiac Quantitative Susceptibility Mapping (QSM)1 is an emerging cardiac magnetic resonance imaging (CMR) technique, which has been used to non-invasively measure the differential blood oxygen saturation (ΔSaO2) between the right and left heart chambers.2 A non-gated 3D stack-of-spiral multi-echo gradient echo acquisition can be performed within a single breath-hold scan. However, even short breath-holds can be challenging or impractical for certain groups of patients with cardiopulmonary conditions, degrading the image quality and affecting the quantitative imaging results. Many retrospective motion-compensated or motion-corrected CMR methods have been developed to minimize the motion-induced artifacts, e.g., XD-GRASP based approach3. In this study, we extended the 3D stack-of-spiral breath-hold scan to a free-breathing acquisition with retrospective ECG and respiratory bellow signal guided motion binning strategy and compressed sensing (CS) based reconstruction to generate a motion-free cardiac QSM, taking advantage of spiral sampling efficiency as well as motion robustness. The ΔSaO2 estimated from both motion-free and motion-averaged free-breathing (FB) cardiac QSM were compared with the breath-holding (BH) cardiac QSM as well as the reference Cartesian navigator (NAV) QSM.Methods
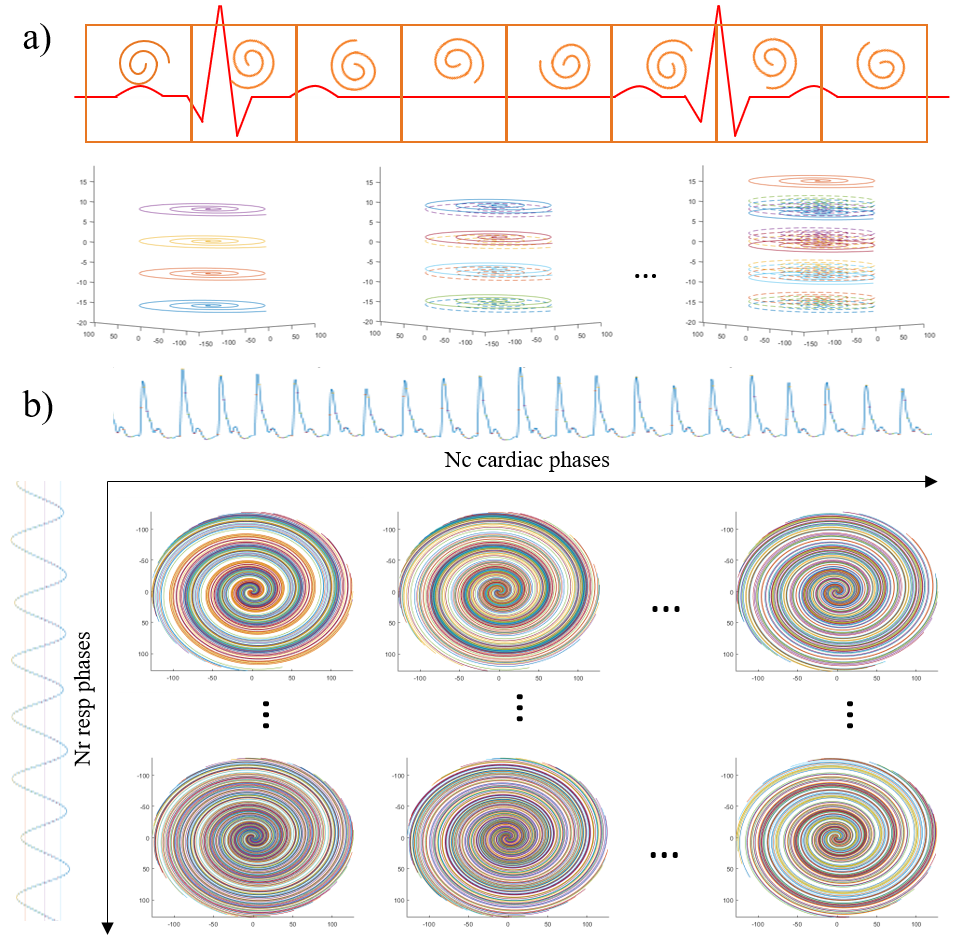
A 3D spoiled multi-echo stack-of-spiral sequence from the previously proposed breath-holding spiral cardiac QSM was extended to a free-breathing setting. External cardiac and respiratory motion signal was recorded for retrospective motion correction from ECG/PG and bellow, respectively. The free-breathing sequence shared the same variable density spiral trajectory with 2-fold center of k-space oversampling and edge of k-space undersampled by a factor of 0.7, designed for one fully-sampled k-space with 36 leaves4, except that FB spiral oversamples the k-space continuously using a golden-angle view order to achieve a nearly evenly sampled k-space after retrospective motion binning. The FB and BH spiral were tested on healthy volunteers on a 3T scanner (GE750), with number of spiral leaves NBH = 36, NFB = 432; scan time tBH = 19sec, tFB = 3min46sec. Other shared imaging parameters include: readout bandwidth ±125kHz, flip angle FA = 12º, number of echoes Ne = 3, TE1/TR/ΔTE = 0.4/17.8/5.9msec, reconstructed matrix size 256×256×24, image resolution 1.8×1.8×5mm3. Besides, a Cartesian navigator cardiac QSM2 was acquired with readout bandwidth ±83.33kHz, flip angle FA = 15º, number of echoes Ne = 5, TE1/TR/ΔTE = 1.4/18.7/3.4msec and the same resolution. All subjects provided consent for this IRB approved protocol.First, off-resonance correction was conducted on a slice-by-slice fashion by demodulating the k-space phase along the readout direction with estimated field from a reference FID readout.5 Next, 3D k-space data were sorted into cardiac phases with a 71.2msec temporal resolution by the recorded ECG/PG triggering according to their leaf/slice encoding orderings, followed by the bellow signal sorting into 4 respiratory phases (Figure 1). Coil sensitivity maps were estimated from all the acquired data by ESPIRiT.6 A compressed sensing method was adopted for the high-dimensional image reconstruction by imposing a wavelet based spatial regularization and a temporal penalty of total variation along both respiratory and cardiac phases3:
$$x^*=arg\min_x ||AFCx-y||^2_2 + \lambda_1 ||\Psi_r x||_1 + \lambda_2 TV_t(x)$$
where $$$C$$$ is the sensitivity encoding, $$$F$$$ is the Fourier operation, $$$A$$$ is non-Cartesian sampling operation, $$$y$$$ is the motion-sorted k-space, $$$\Psi_r$$$ is wavelet operation, $$$TV_t(·)$$$ is total variation. Then the complex multi-echo data were used for QSM reconstruction by total field inversion methods (TFI+0)2,7,8. ΔSaO2 is estimated from mean susceptibility difference between the right/left ventricle blood pools scaled by hematocrit.
For comparison, a motion-averaged QSM was reconstructed by all the acquired data. The motion-free and motion-averaged QSM were compared with both BH spiral and NAV QSM by Deming regression and Bland-Altman plots. Image was reconstructed using BART v0.7.00.9 QSM were reconstructed on MATLAB R2020b. Statistical analysis was performed using R 4.2.1.
Results
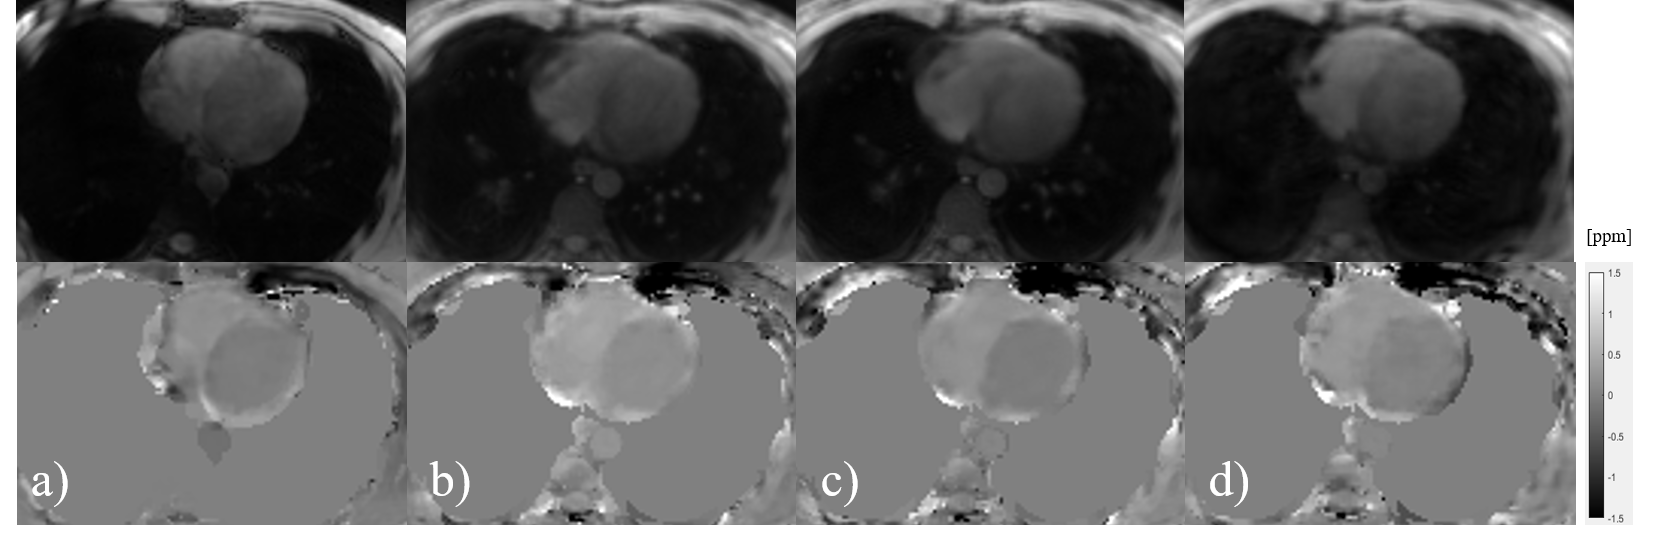
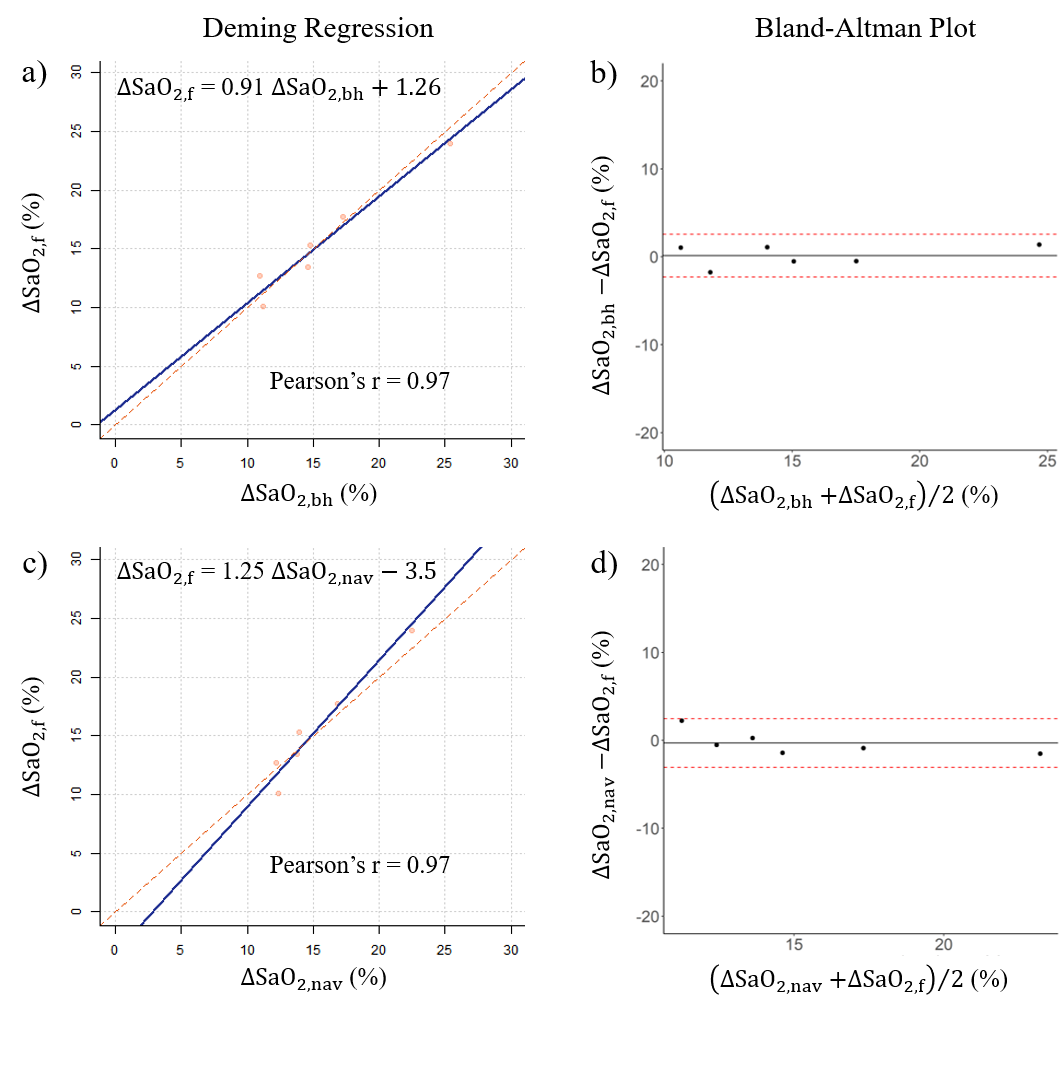
FB spiral was tested on 6 healthy volunteers (age: 38±19, 50% male), as well as BH spiral and NAV QSM. Among all the subjects, the ΔSaO2 from motion-free spiral QSM was 15.56±4.86%, compared to 17.33±4.44% for motion-averaged spiral, 15.68±5.32% for BH spiral and 15.42±3.49% for NAV QSM. Figure 2 shows a representative cardiac QSM from FB, BH spiral and NAV QSM. Figure 3 shows that motion-free spiral QSM has equivalent ΔSaO2 compared to BH spiral as well as NAV QSM (ΔSaO2,f = 0.91ΔSaO2,bh + 1.26 (%), Pearson’s r = 0.97; ΔSaO2,f = 1.25ΔSaO2,nav – 3.5 (%), Pearson’s r = 0.97).Discussion
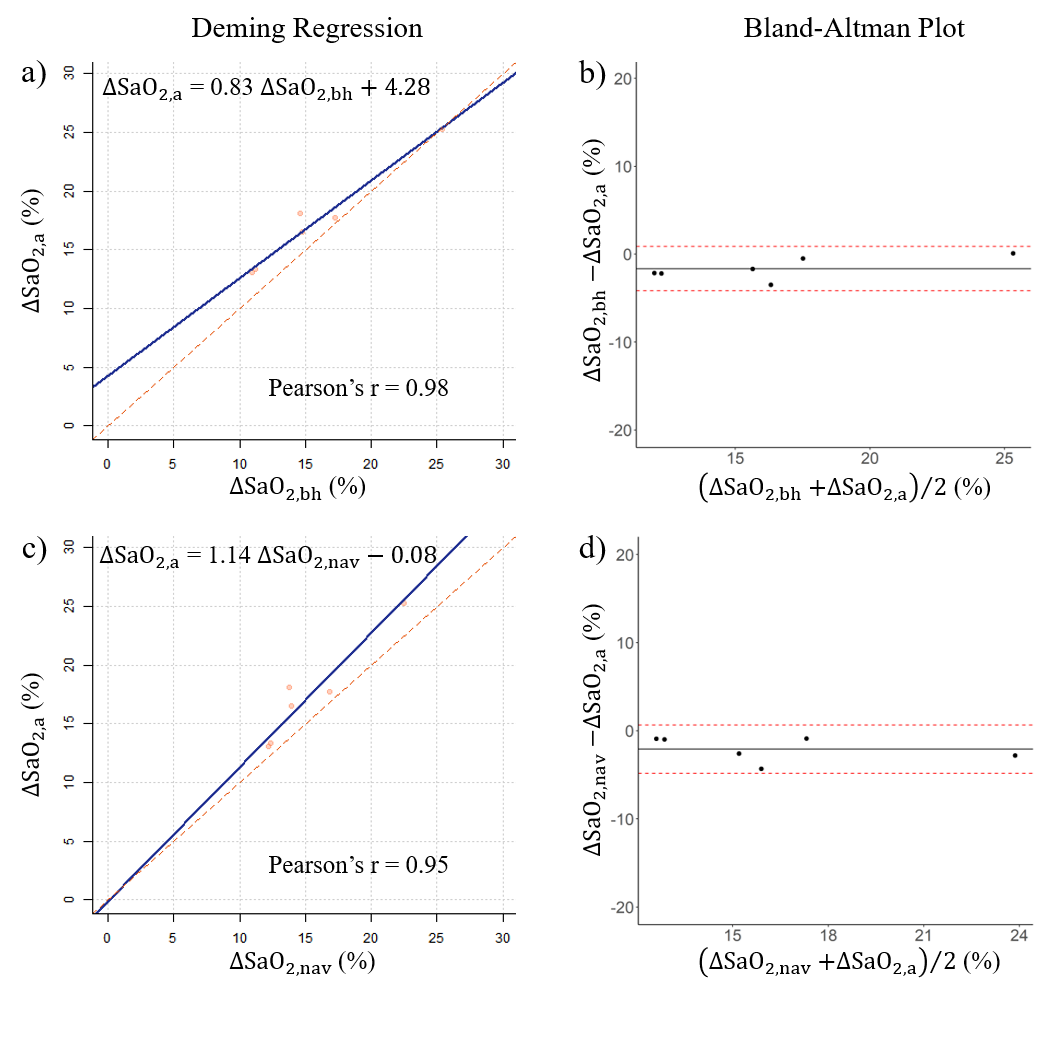
Motion-free QSM generated from the free-breathing 3D stack-of-spiral shows well-aligned ΔSaO2 estimation with both BH spiral and NAV QSM in this study, demonstrating that this free-breathing scheme can be an alternative to the current BH spiral in case subject has trouble with breath-holds. Moreover, even the motion-averaged QSM shows good correlation with BH and NAV results (Figure 4, ΔSaO2,a = 0.83ΔSaO2,bh + 4.28 (%), Pearson’s r = 0.98; ΔSaO2,a = 1.14ΔSaO2,nav – 0.08 (%), Pearson’s r = 0.95). A larger sample size with additional right heart catheterization (RHC) data will be conducted to further validate this approach. More sophisticated motion correction method on highly undersampled high dimensional k-space will also help improve the overall image quality.Conclusion
A free-breathing 3D stack-of-spiral sequence with retrospective motion-binning and CS reconstruction was shown to generate motion-free cardiac QSM with equivalent ΔSaO2 estimation to the breath-hold scan.Acknowledgements
No acknowledgement found.References
[1] Wen, Y., et al. "Cardiac quantitative susceptibility mapping (QSM) for heart chamber oxygenation." Magn. Reson. Med 79.3 (2018): 1545-1552.
[2] Wen, Y., et al. (2019). Free breathing three-dimensional cardiac quantitative susceptibility mapping for differential cardiac chamber blood oxygenation - initial validation in patients with cardiovascular disease inclusive of direct comparison to invasive catheterization. J Cardiovasc Magn Reson, 21(1), 70. https://doi.org/10.1186/s12968-019-0579-7
[3] Feng, Li, et al. "XD‐GRASP: golden‐angle radial MRI with reconstruction of extra motion‐state dimensions using compressed sensing." Magnetic resonance in medicine 75.2 (2016): 775-788.
[4] Xu, B., et al. (2013), Fast 3D contrast enhanced MRI of the liver using temporal resolution acceleration with constrained evolution reconstruction. Magn Reson Med, 69: 370-381. https://doi.org/10.1002/mrm.24253
[5] Eskreis-Winkler, Sarah, et al. (2012) "Time-Efficient Approximate Inhomogeneity Correction Algorithm for 3D Spiral Contrast Enhanced Imaging of the Liver." 20th ISMRM 2012 Melbourne
[6] Uecker, Martin, et al. "ESPIRiT—an eigenvalue approach to autocalibrating parallel MRI: where SENSE meets GRAPPA." Magnetic resonance in medicine 71.3 (2014): 990-1001.
[7] Liu, Z, et al. (2017) "Preconditioned total field inversion (TFI) method for quantitative susceptibility mapping." Magn. Reson. Med., 78.1: 303-315.
[8] Liu, Z., et al. (2018), MEDI+0: Morphology enabled dipole inversion with automatic uniform cerebrospinal fluid zero reference for quantitative susceptibility mapping. Magn. Reson. Med., 79: 2795-2803. https://doi.org/10.1002/mrm.26946
[9] Tamir, J., et al. Generalized Magnetic Resonance Image Reconstruction using The Berkeley Advanced Reconstruction Toolbox. ISMRM Workshop on Data Sampling and Image Reconstruction, Sedona 2016.
Figures