0769
Biophysical model to correct for blood volume confounders of T2* mapping based renal MR oximetry1Berlin Ultrahigh Field Facility (B.U.F.F.), Max Delbrück Center for Molecular Medicine in the Helmholtz Association, Berlin, Germany, 2Institute of Translational Physiology, Charité - Universitätsmedizin Berlin, Berlin, Germany, 3Experimental and Clinical Research Center, a joint cooperation between the Charité Medical Faculty and the Max Delbrück Center for Molecular Medicine in the Helmholtz Association, Berlin, Germany
Synopsis
Keywords: Oxygenation, Quantitative Imaging
Quantitative MRI of renal hypoxia, an early key feature in acute kidney injury, is a valuable tool for diagnostics and pathophysiological studies. En route to MR oximetry we propose a biophysical model that uses the kidney size as an additional MRI derivable information to correct for blood volume confounders of oxygenation sensitive T2* maps. The model is demonstrated in a preclinical study involving three different vascular occlusions highlighting the confounding effect of blood volume changes and its correction.Aim
Renal tissue hypoxia is a key feature that develops early in the course of acute kidney injury. Renal oxygenation can be assessed non-invasively using magnetic resonance imaging (MRI) relaxation times T2 and T2*, so this method can yield insights into renal pathophysiology and potentially serve as a valuable diagnostic tool1-8. The roadblock on this path is that T2 and T2* reflect the concentration of deoxyhemoglobin in tissues, but not the oxyhemoglobin. Therefore, changes in blood and tubular volume fractions can confound the interpretation of MR relaxation times and make it difficult to observe hypoxia. En route to T2* based MR-oximetry this study presents a model that enables correct physiological interpretation of changes in renal blood oxygenation. For this purpose our biophysical model differentiates changes in O2 saturation of haemoglobin (Sat) from changes in T2* and kidney size.Methods
Kidney size was determined from T2* and T2 maps obtained in rats. We performed consecutive occlusions of the suprarenal aorta, the renal vein and of both vessels in combination, which lead to a similar drop in kidney oxygenation, but strongly differ in their effect on the blood volume fraction as illustrated in Fig. 1. A biophysical model was used to estimate changes in O2 saturation of haemoglobin (Sat) from changes in T2* and kidney size. Based on the assumption that R2* is proportional to the deoxyhaemoglobin (deoxyHb) concentration in tissue and that haematocrit stays constant in the first approximation we derived equation 1.$$R_2^* \sim (1-Sat) \frac{BV}{KV} \hspace{5em} (1)$$
We furthermore approximate that the kidney volume changes ΔKV are due to blood volume changes ΔBV in the occlusion experiments. With this assumption the ratio of R2* obtained during the occlusions versus R2*0 observed for baseline conditions prior to the occlusion can be expressed as:
$$\frac{R_2^*}{{R_2^*} _{_0}} = \frac{(1-Sat)}{(1-Sat_0)} \ \frac{KV_0(BV_0+\triangle KV)}{BV_0(KV_0+\triangle KV)} \hspace{5em} (2)$$
Rearranging for the ratio of the deoxygenated Hb fractions and substituting changes in the blood volume fraction (BVF=BV/KV) leads to:
$$\frac{1-Sat}{1-Sat_0} = \frac{R_2^*}{{R_2^*} _{_0}} BVF_0 \frac{1+\frac{\triangle KV}{KV_0}}{BVF_0+\frac{\triangle KV}{KV_0}} \hspace{5em} (3)$$
Equation 3 relates the R2* ratio to the ratio of the deoxygenated Hb fractions using the baseline blood volume fraction and the relative kidney volume change as correction factors.
Results
Upon aortic occlusion kidney size decreased by 6±1% (mean±SEM; Fig. 2), during venous occlusion it increased by 6±1% (Fig. 3) while remaining stable in the combined occlusion (Fig. 4). All interventions lead to a decrease in T2* and T2 which was strongest for the venous occlusion (Cortex: -33±2% T2, -60±3% T2*), weakest for the aortic occlusion (Cortex: -22±2% T2, -29±3% T2*) and moderate for the combined occlusion (Cortex: -23±2% T2, -46±3% T2*). Using these data, it was possible to estimate the calibration constant BVF0 in equation 3 by minimizing the deviation of the resulting (1 – Sat)/(1 – Sat0) between the different occlusions. BVF0 was found to be 0.268, 0.394, and 0.273 for the cortex, outer medulla, and inner medulla, respectively.The resulting (1 – Sat)/(1 – Sat0) ratios are provided in table 1 (range 1.9-2.9). On average, a relative 2.1 fold increase in the proportion of deoxyHb was found.
Table 1: Ratio of (1 – Sat)occlusion/(1 – Sat0)baseline obtained by the biophysical model for the three vascular occlusions (two consecutive T2* scans per occlusion)
| (1 – Sat)/(1 – Sat0) | Cortex | Outer medulla | Inner medulla |
| Aortic occlusion scan 1 | 2.15±0.24 | 2.06±0.13 | 2.35±0.28 |
| Aortic occlusion scan 2 | 2.25±0.29 | 2.10±0.14 | 2.32±0.33 |
| Venous occlusion scan 1 | 2.30±0.15 | 2.23±0.08 | 2.16±0.19 |
| Venous occlusion scan 2 | 2.29±0.16 | 1.89±0.11 | 2.90±0.28 |
| Combined occlusion scan 1 | 2.01±0.13 | 2.20±0.09 | 1.91±0.10 |
| Combined occlusion scan 2 | 2.01±0.13 | 2.11±0.11 | 2.04±0.15 |
Discussion
The obtained deoxyHb fraction derived for the three vascular occlusions can be related to the oxygen saturation of Hb based on baseline saturation values found in the literature. Estimates for the baseline cortical blood oxygen saturation based on invasive near infrared spectroscopy are approx. 64%.9 The average (1 – Sat)/(1 – Sat0) ratio of 2.2 derived from our model calculations in the cortex corresponds to a Sat decrease by about 70% down to a physiological reasonably low value of 20%. The congruence of these Sat values with tissue partial pressure of O2 data obtained from invasive probes demonstrates that the biophysical model yields physiologically plausible calibration ratios and Sat values.9Conclusion
Monitoring kidney size allows physiological interpretation of acute renal oxygenation changes obtained by T2* and T2. Kidney size monitoring should accompany MRI-oximetry, for new insights into renal pathophysiology and swift translation into human studies.Acknowledgements
This work was supported by the German Research Foundation, CRC 1365 “Renoprotection” (Gefördert durch die Deutsche Forschungsgemeinschaft [DFG], SFB 1365 “Renoprotection”). We thank P.B. Persson, A. Anger, B. Flemming (Charité Berlin), A. Pohlmann, J. Periquito, H. Reimann (Max-Delbrück-Center for Molecular Medicine in the Helmholtz Association, Berlin), and D. Grosenick (Physikalisch-Technische Bundesanstalt Berlin) for technical and other support.References
1. Levin A, Tonelli M, Bonventre J, Coresh J, Donner JA, Fogo AB, et al.: Global kidney health 2017 and beyond: a roadmap for closing gaps in care, research, and policy. Lancet, 390: 1888-1917, 2017.
2. Pickkers P, Ostermann M, Joannidis M, Zarbock A, Hoste E, Bellomo R, et al.: The intensive care medicine agenda on acute kidney injury. Intensive Care Med, 43: 1198-1209, 2017.
3. Molitoris BA: Urinary Biomarkers: Alone Are They Enough? JAmSocNephrol, 26: 1485-1488, 2015.
4. Niendorf T, Pohlmann A, Arakelyan K, Flemming B, Cantow K, Hentschel J, et al.: How bold is blood oxygenation-dependent (BOLD) magnetic resonance imaging of the kidney? Opportunities, challenges and future directions. Acta Physiol (Oxf), 213: 19-38, 2015.
5. Matejovic M, Ince C, Chawla LS, Blantz R, Molitoris BA, Rosner MH, et al.: Renal Hemodynamics in AKI: In Search of New Treatment Targets. JAmSocNephrol, 27: 49-58, 2016.
6. Selby NM, Blankestijn PJ, Boor P, Combe C, Eckardt KU, Eikefjord E, et al.: Magnetic resonance imaging biomarkers for chronic kidney disease: a position paper from the European Cooperation in Science and Technology Action PARENCHIMA. Nephrol Dial Transplant, 33: ii4-ii14, 2018.
7. Caroli A, Remuzzi A, Remuzzi G: Does MRI trump pathology? A new era for staging and monitoring of kidney fibrosis. Kidney Int, 97: 442-444, 2020.
8. Simms R, Sourbron S: Recent findings on the clinical utility of renal magnetic resonance imaging biomarkers. Nephrol Dial Transplant, 35: 915-919, 2020.
9. Grosenick D, Cantow K, Arakelyan K, Wabnitz H, Flemming B, Skalweit A, et al.: Detailing renal hemodynamics and oxygenation in rats by a combined near-infrared spectroscopy and invasive probe approach. BiomedOptExpress, 6: 309-323, 2015.
10. Pohlmann A, Arakelyan K, Hentschel J, Cantow K, Flemming B, Ladwig M, et al.: Detailing the relation between renal T2* and renal tissue pO2 using an integrated approach of parametric magnetic resonance imaging and invasive physiological measurements. Invest Radiol, 49: 547-560, 2014.
11. Seeliger E, Cantow K, Arakelyan K, Ladwig M, Persson PB, Flemming B: Low-dose nitrite alleviates early effects of an X-ray contrast medium on renal hemodynamics and oxygenation in rats. Invest Radiol, 49: 70-77, 2014.
12. Arakelyan K, Cantow K, Hentschel J, Flemming B, Pohlmann A, Ladwig M, et al.: Early effects of an x-ray contrast medium on renal T(2) */T(2) MRI as compared to short-term hyperoxia, hypoxia and aortic occlusion in rats. Acta Physiol (Oxf), 208: 202-213, 2013.
Figures
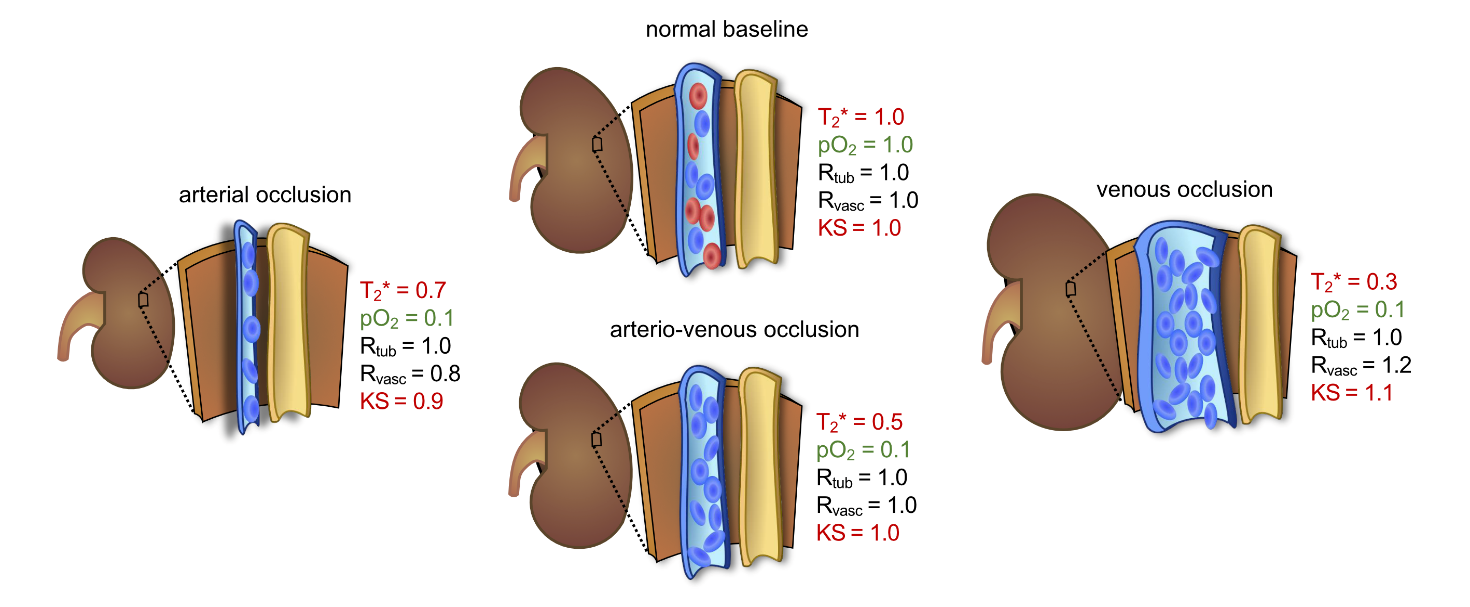
Figure 1: Scheme detailing the qualitative relationship between kidney size and T2*
T2* mirrors the amount of deoxyHb per tissue volume represented here by blue erythrocytes. The scheme depicts the tubular radius (Rtub), the blood volume represented by radius Rvasc, the average tissue pO2, and kidney size (KS) as well as their changes upon acute interventions. Changes are all expressed relative to normal baseline (defined as 1.0); approximate changes in tissue pO2 are derived from earlier studies.9-12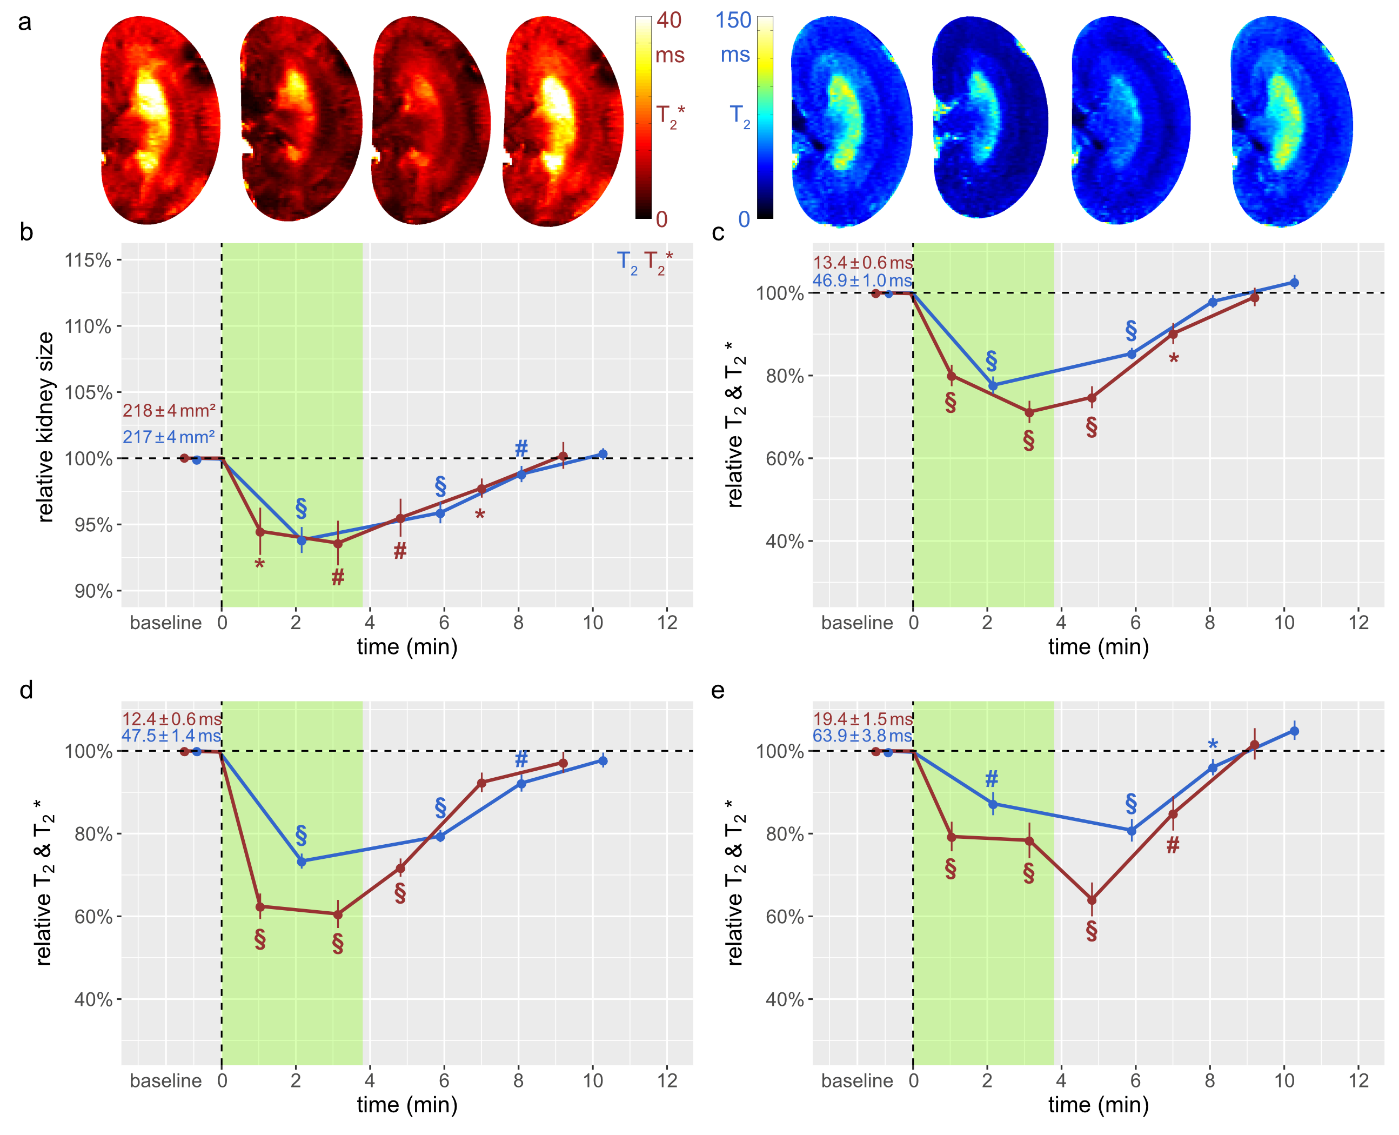
Figure 2: Time courses during occlusion of the suprarenal aorta and recovery
(a) Exemplary T2*(left) and T2(right) maps obtained for a rat kidney in vivo. Time course of relative changes (mean±SEM) for (b) kidney size and T2 (blue) and T2* (red) obtained for (c) cortex (CO), (d) outer medulla (OM), and (e) inner medulla (IM) before the intervention (baseline), during the intervention (green area), and during recovery. Absolute baseline values (mean±SEM) are denoted; * P<0.05; # P<0.01; § P<0.001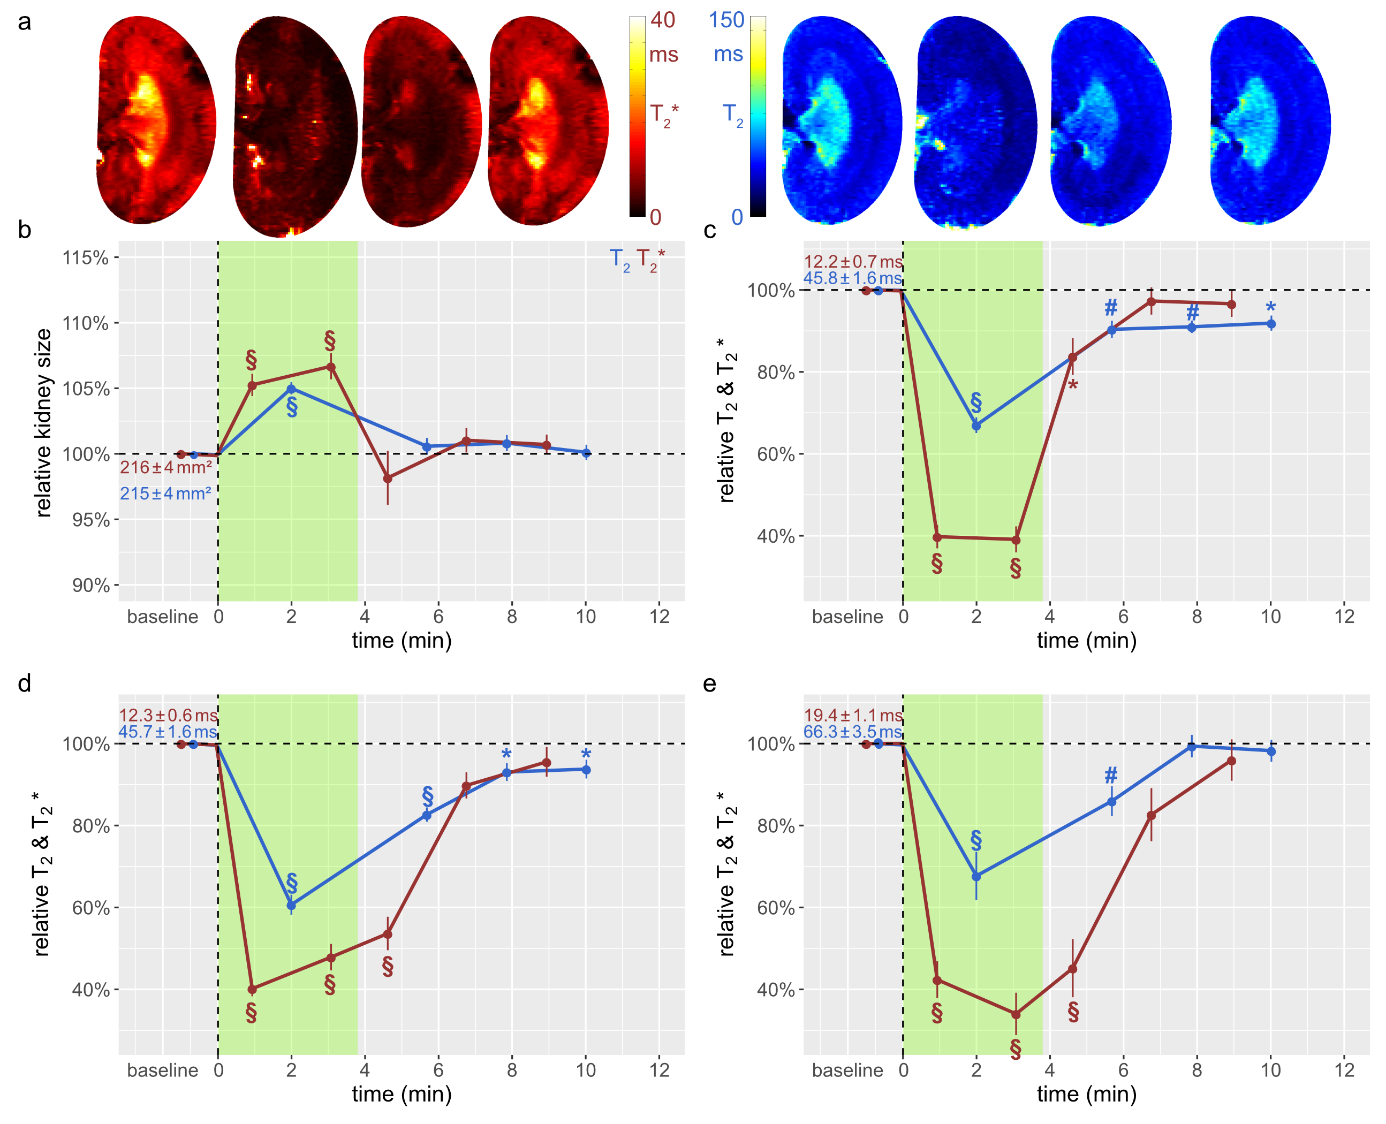
Figure 3: Time courses during occlusion of the renal vein and recovery
(a) Exemplary T2 and T2* maps obtained for rat a kidney in vivo. Time course of relative changes for (b) kidney size (cross sectional area) and T2 and T2* for (c) CO, (d) OM, and (e) IM. Colors, absolute baseline values, and significance signs as in Fig. 2.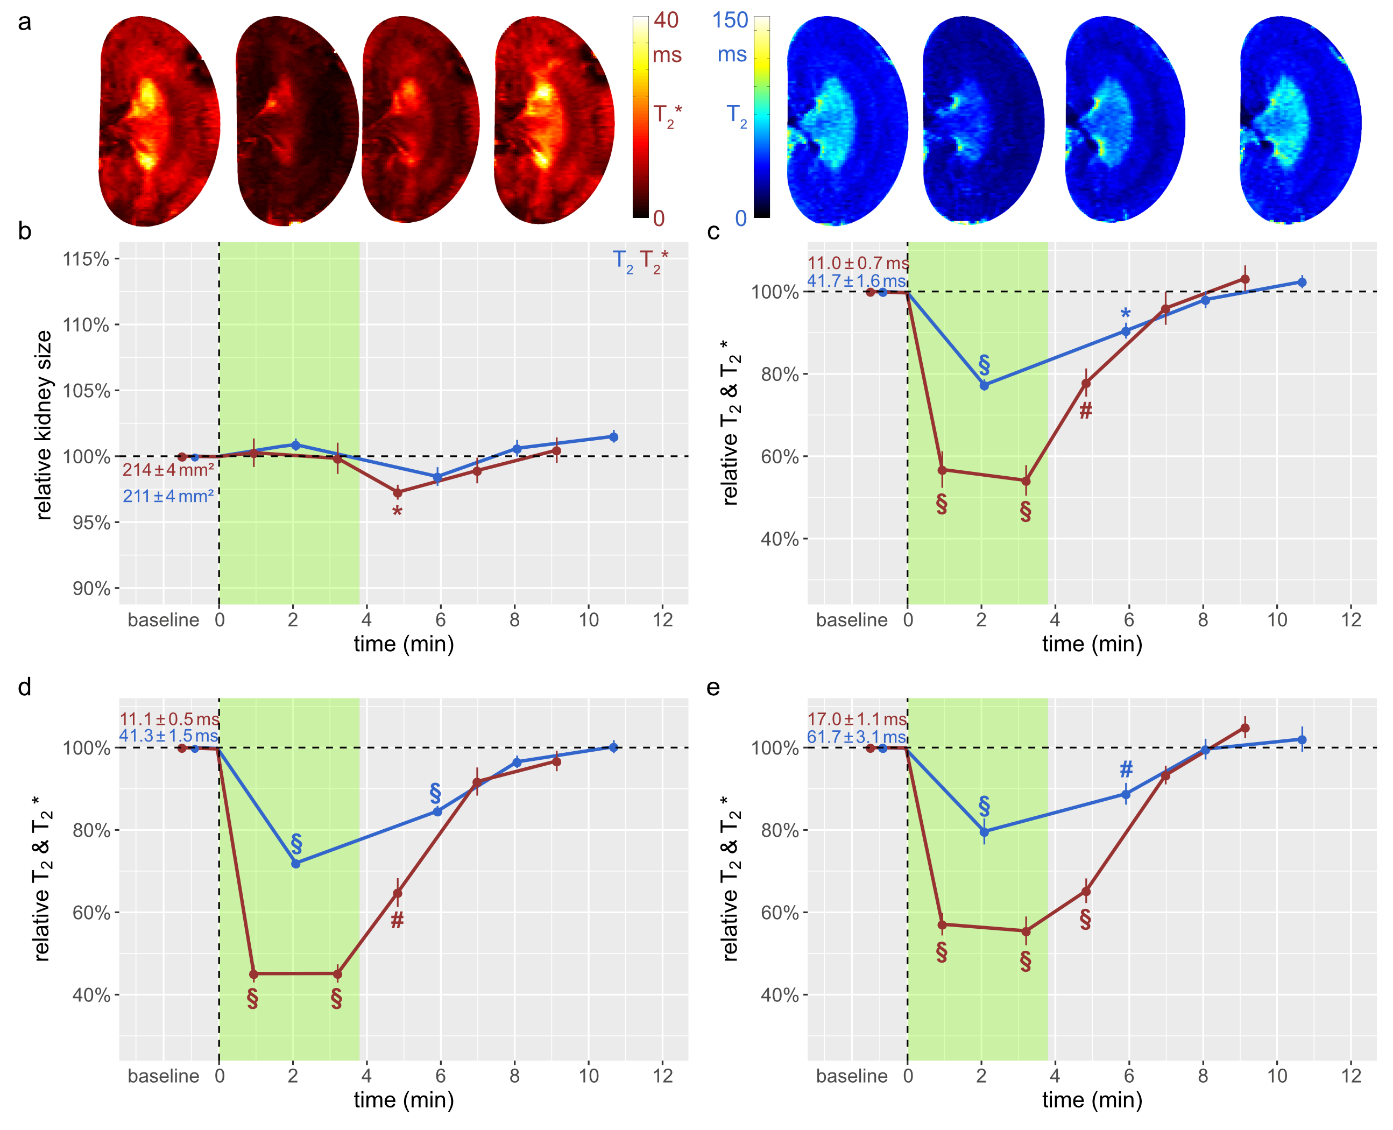
Figure 4: Time courses during simultaneous occlusion of the aorta and the vein and recovery
(a) Exemplary T2,T2* maps obtained for rat a kidney in vivo. Time course of relative changes for (b) kidney size and T2,T2* for (c) CO, (d) OM, and (e) IM. Colors, absolute baseline values, and significance signs as in Fig. 2.