0768
A practical methodology to study the relationship between arterial blood pressure fluctuations and the BOLD signal1Biological and Biomedical Engineering, McGill University, Montréal, QC, Canada, 2Bioengineering, McGill University, Montréal, QC, Canada
Synopsis
Keywords: Data Acquisition, fMRI, Physiological denoising, ABP regulation
The relationship between arterial blood pressure (ABP) fluctuations and the BOLD-fMRI signal is mostly unknown due to the limited availability of reliable MR-compatible ABP devices. Here, we propose a combined experimental and mathematical modeling methodology that uses two calibration recordings outside the scanner to estimate the ABP during the MR scan. Significant correlations between BOLD and ABP were observed in all tested subjects, which also revealed that the global BOLD signal is intrinsically correlated with the underlying ABP fluctuations. Our method is expected to improve our understanding of ABP regulation in the brain and allow for improved physiological fMRI denoising.Introduction
Our understanding of the relationship between the BOLD-fMRI signal and arterial blood pressure (ABP) fluctuations has been severely limited by the difficulty of measuring ABP during functional magnetic resonance imaging (fMRI). Previous attempts required modifying existing technologies to make the ABP monitors MR-compatible 1-3. This solution is not practical for most research groups and the reliability of these modified devices has not been fully characterized. Here, we propose an MR-compatible method to estimate beat-to-beat ABP fluctuations at rest and during autonomic tasks. Based on our early results, we propose that this method can be used to disentangle the systemic and neural components of ABP control that modulate the BOLD-fMRI signal.Methods
The beat-to-beat mean arterial pressure (MAP) fluctuations are estimated with a subject specific dynamic partial least square regression (dPLSR) model (Eq 1). The model takes as input 39 features extracted semi-automatically from the pulse waveform measured by an extended finger-cuff connected to a pressure sensor (CareTaker, Charlottesville, USA) and predicts the MAP fluctuations measured with the validated non MR-compatible Portapres (Enschede, Netherlands) 4,5. The model is calibrated using two five-minute recordings acquired before and after the scan that include simultaneous measurements of the MAP and pulse signal while the subject is in supine position on the scanner bed in the control room. The calibrated model is then used to estimate the MAP fluctuations during the scanning protocol using the pulse signal features only.Eq 1. $$$ \bf X =SP \tt ^T$$$, $$$ \bf S \tt ^T \bf S =I$$$, $$$\hat{y} = \bf SBC \tt ^T$$$
Eq 2. $$$\bf X \tt (n) = [F_1(n-k), F_1(n-k+1),...,F_1(n),...,F_j(n-k),F_j(n-k+1),...,F_j(n)]$$$
Eq 3. $$$y(n)=[MAP_{portapres}(n)]$$$
With $$$\bf X$$$ corresponding to the regression matrix which includes j features ($$$F_j$$$) lagged up to K times. $$$\bf S$$$ and $$$\bf P$$$ correspond to the score and loading matrix respectively. The response $$$y$$$ is estimated as $$$\hat{y}$$$ by regressing the scores $$$\bf S$$$ with the weighted regression coefficients $$$\bf BC \tt ^T$$$. The scores $$$\bf S$$$ are estimated iteratively one component at a time by searching for a linear combination of $$$\bf X$$$ and $$$y$$$ that maximizes their covariance. The model complexity is selected as the simplest model to explain 85% of the out-of-sample variance using 10-fold cross-validation.
Functional and structural images were acquired in four subjects at the Montreal General Hospital on a Siemens 3T Prisma (Erlangen, Germany) using a 64-channels head/neck coil. The functional scan consisted of an echo-planar-imaging sequence (TR=2120ms; TE=30ms; voxel=3.0x3.0x4.0mm; FOVread=192mm). The structural images were acquired with a T1-MPRAGE sequence (TR=2200ms; TE=2.49ms; TI=1050ms; voxel=0.7mm3;FOVread=220mm).
High-pass filtering (0.01Hz), spatial smoothing (5mm Gaussian kernel), slice-timing correction, motion correction, EPI distortion correction with field-map, cardio-respiratory denoising with RETROICOR 6, and co-registration to structural and standard space was performed on the functional data using FSL 7 and in-house codes.
Results
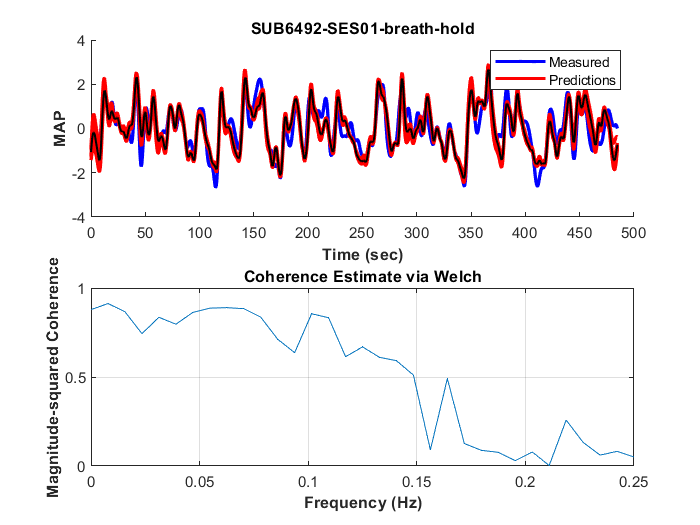
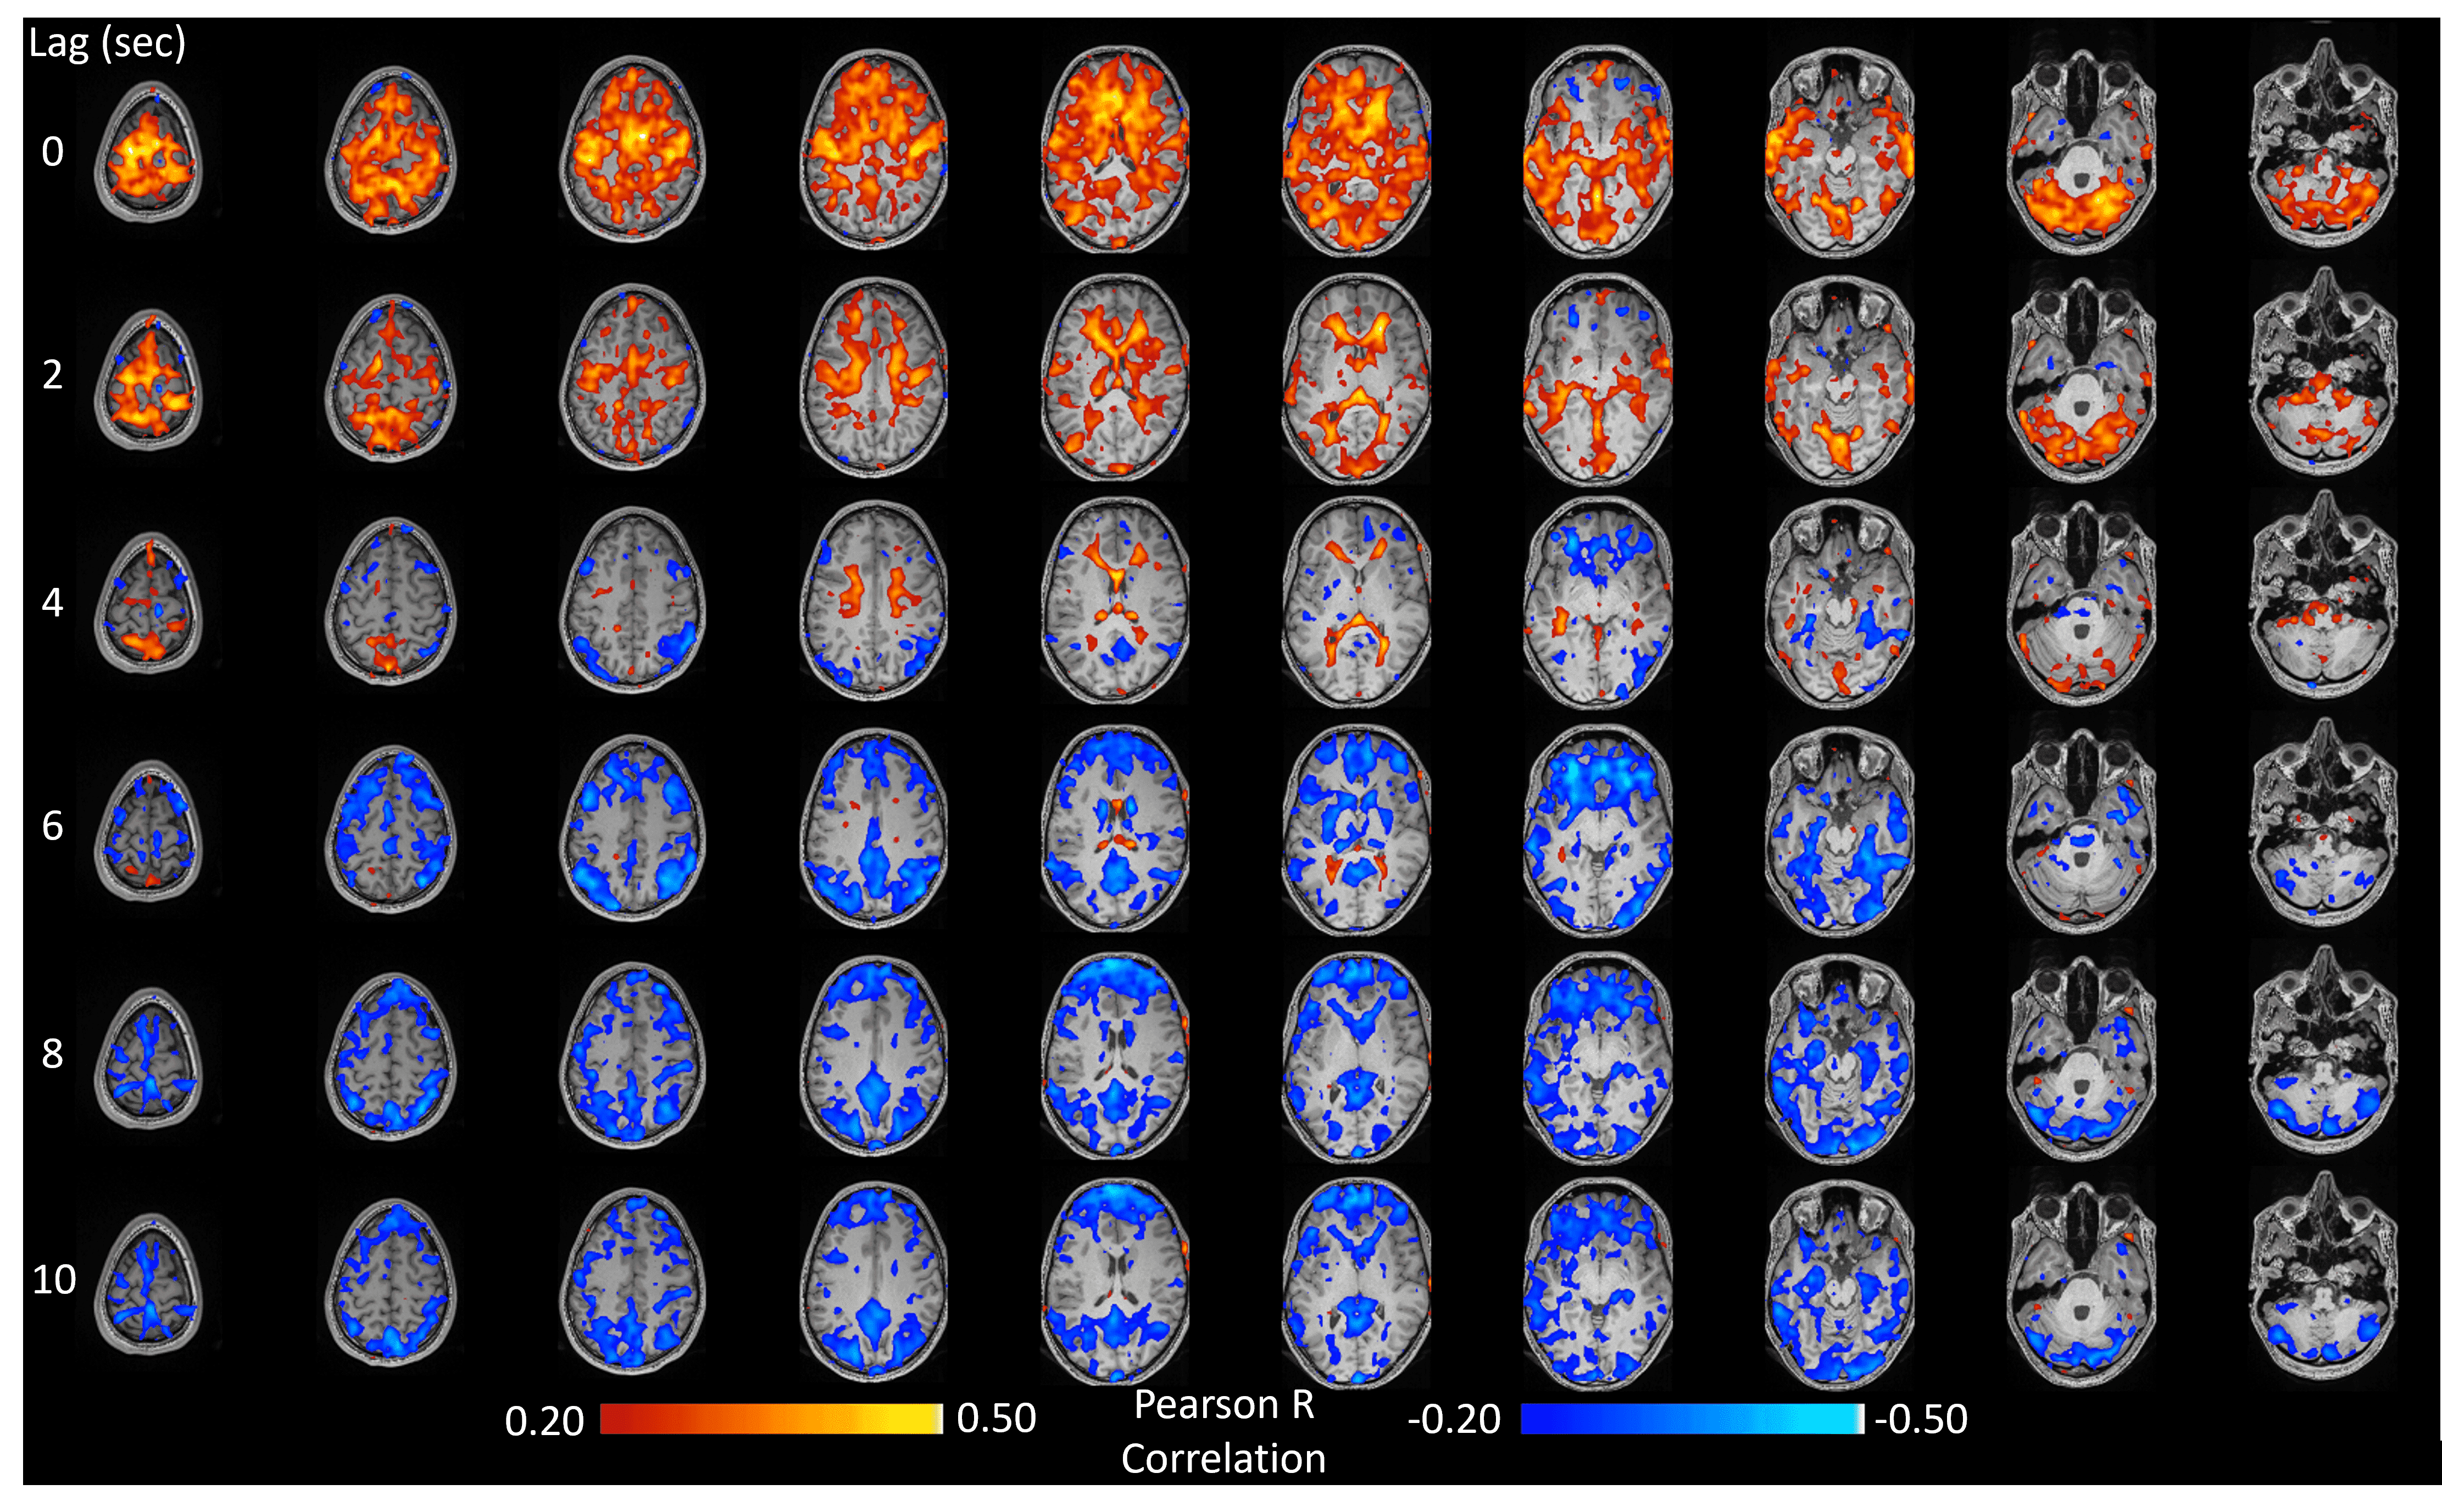
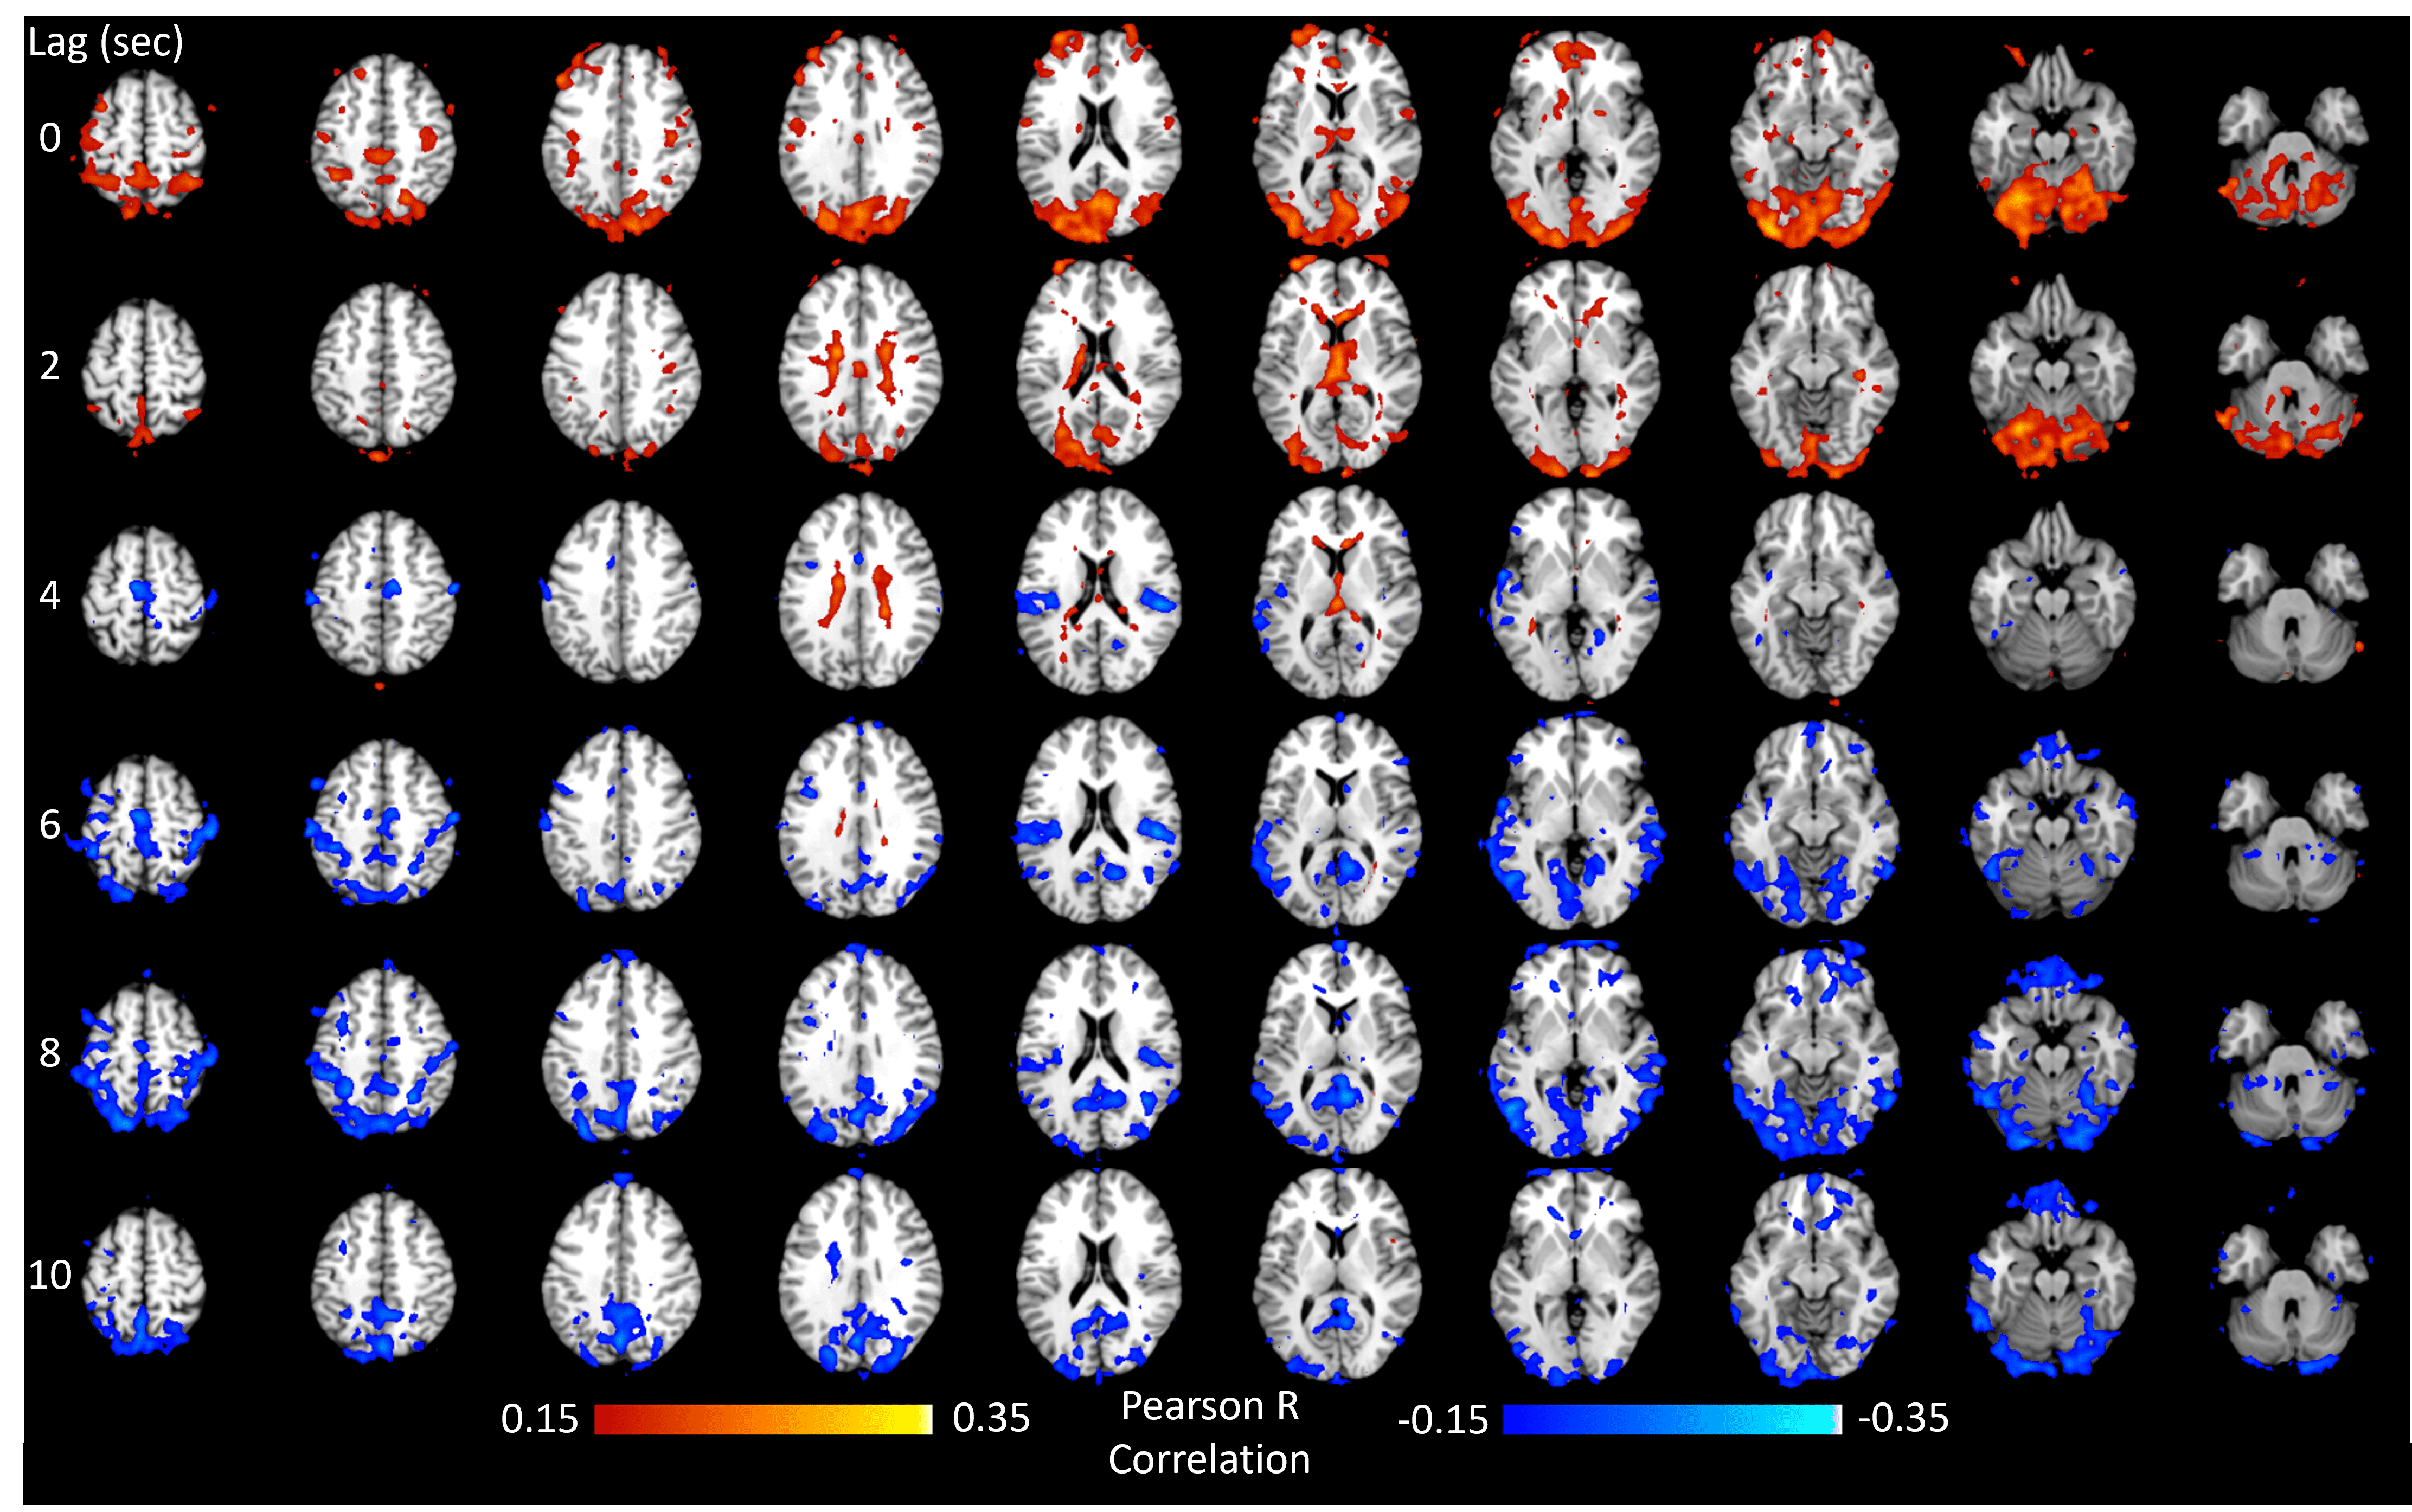
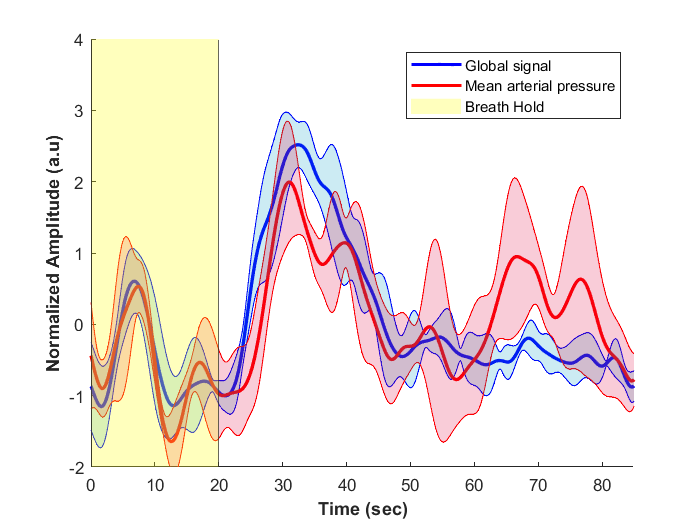
The method was tested outside the scanner and was shown to account for more than 70% of the variance of the MAP fluctuations within the neuronal frequency range of BOLD (0.008-0.20Hz) (Fig.1). Based on this preliminary performance, we tested the methodology inside the scanner. The lagged correlation between the MAP fluctuations and the BOLD signal are presented in figure 2 on a subject level and averaged over three subjects in figure 3. On the subject level, correlations as high as 0.59 are observed in the cerebellum, while MAP becomes anti-correlated with BOLD 6 seconds later. The correlation patterns remain mostly consistent when averaged over the 3 other participants, but the magnitude is smaller.The correlation between MAP and the global BOLD-fMRI signal during repeated breath-holds and cued-breathing was analyzed on a subject level (Fig. 4). Important similarities were present in both signals for the three subjects tested (R2ave = 0.56).
Discussion
The correlation between MAP and BOLD arises from two processes. The main mechanism is cerebral autoregulation (CA), which responds to changes in ABP. Despite its effectiveness in regulating blood flow, CA will cause local changes in cerebral blood flow, which in turn modulate the BOLD signal 3,8. On the other hand, the central autonomic network processes information from the baroreceptors and is important for long-term ABP regulation 1,9. Here, we present a method to study these effects and show that it can detect significant correlations between BOLD and MAP at rest and during autonomic tasks. Our early results are mostly consistent with 10, except for the delay between MAP and BOLD, with our values being much smaller than the ones reported in 10. The maximum correlation occurs within the first 2 seconds, which is consistent with values reported using transcranial Doppler ultrasound 11.Conclusion
An exact understanding of which components drive local changes in the BOLD signal is important for understanding the physiology behind both long-term ABP control and CA. Our method has the potential to investigate in depth these phenomena. Furthermore the calibration is relatively straightforward, thus facilitating the feasibility of ABP estimation in BOLD-fMRI. More data will be collected to quantify the performance of the method. Finally, because ABP fluctuations are dependent on heart rate variability and PaCO2, we will compare the correlation maps obtained with methods that take those effects into consideration using physiological response functions 12.Acknowledgements
Acknowledged are Mary Miedema and Mohammad Torabi for their help in the data acquisition process and advices regarding fMRI processing. The authors also want to thank Darius Gerlach and Jorge Manuel for their helpful recommendations regarding the acquisition of arterial blood pressure measurements inside the MRI environment.References
1. D. A. Gerlach et al., "Novel approach to elucidate human baroreflex regulation at the brainstem level: pharmacological testing during fMRI," Frontiers in neuroscience, vol. 13, p. 193, 2019.
2. J. Manuel et al., "Deciphering the neural signature of human cardiovascular regulation," Elife, vol. 9, p. e55316, 2020.
3. J. R. Whittaker, J. J. Steventon, M. Venzi, and K. Murphy, "The spatiotemporal dynamics of cerebral autoregulation in functional magnetic resonance imaging," Frontiers in neuroscience, vol. 16, 2022.
4. J. Van Egmond, M. Hasenbos, and J. Crul, "Invasive v. non-invasive measurement of arterial pressure: comparison of two automatic methods and simultaneously measured direct intra-arterial pressure," BJA: British Journal of Anaesthesia, vol. 57, no. 4, pp. 434-444, 1985.
5. G. Parati, R. Casadei, A. Groppelli, M. Di Rienzo, and G. Mancia, "Comparison of finger and intra-arterial blood pressure monitoring at rest and during laboratory testing," Hypertension, vol. 13, no. 6_pt_1, pp. 647-655, 1989.
6. G. H. Glover, T. Q. Li, and D. Ress, "Image‐based method for retrospective correction of physiological motion effects in fMRI: RETROICOR," Magnetic Resonance in Medicine: An Official Journal of the International Society for Magnetic Resonance in Medicine, vol. 44, no. 1, pp. 162-167, 2000.
7. M. Jenkinson, C. F. Beckmann, T. E. Behrens, M. W. Woolrich, and S. M. Smith, "Fsl," Neuroimage, vol. 62, no. 2, pp. 782-790, 2012.
8. O. Paulson, S. Strandgaard, and L. Edvinsson, "Cerebral autoregulation," Cerebrovascular and brain metabolism reviews, vol. 2, no. 2, pp. 161-192, 1990.
9. M. Sklerov, E. Dayan, and N. Browner, "Functional neuroimaging of the central autonomic network: recent developments and clinical implications," Clinical Autonomic Research, vol. 29, no. 6, pp. 555-566, 2019.
10. J. R. Whittaker, I. D. Driver, M. Venzi, M. G. Bright, and K. Murphy, "Cerebral autoregulation evidenced by synchronized low frequency oscillations in blood pressure and resting-state fMRI," Frontiers in neuroscience, vol. 13, p. 433, 2019.
11. M. Christ et al., "Continuous cerebral autoregulation monitoring by improved cross-correlation analysis: comparison with the cuff deflation test," Intensive Care Medicine, vol. 33, no. 2, pp. 246-254, 2007.
12. M. Kassinopoulos and G. D. Mitsis, "Identification of physiological response functions to correct for fluctuations in resting-state fMRI related to heart rate and respiration," Neuroimage, vol. 202, p. 116150, 2019.
Figures