0766
Multi-TE SANDI: Quantifying compartmental T2 relaxation times in the grey matter1Centre for Medical Image Computing & Department of Computer Science, University College London, London, United Kingdom, 2Cardiff University Brain Research Imaging Centre, School of Physics and Astronomy, Cardiff University, Cardiff, United Kingdom, 3University Medical Center Utrecht, Utrecht University, Utrecht, Netherlands, 4Cardiff University Brain Research Imaging Centre, School of Psychology, Cardiff University, Cardiff, United Kingdom, 5School of Computer Science and Informatics, Cardiff University, Cardiff, United Kingdom
Synopsis
Keywords: Signal Modeling, Diffusion/other diffusion imaging techniques
This study models the echo time (TE) dependence of the apparent soma and neurite signal fractions derived from the soma and neurite density imaging (SANDI) and quantifies the apparent compartmental T2 relaxation times in the grey matter (GM). The SANDI model divides the intra-cellular space into intra-neurite and intra-soma compartments to account for contribution of water diffusion in cell bodies. By collecting multi-TE SANDI datasets, we provide the first ever estimates of apparent intra-neurite and intra-soma T2 relaxation times in the human brain and characterise their distribution in cortical and subcortical GM regions.Introduction
Biophysical models such as NODDI1 and the Standard Model2 have been well established for white matter (WM) microstructural MRI. They characterise the water diffusion in the intra-neurite and extra-neurite space as restricted and hindered diffusion, respectively3. However, these models do not describe the signal in the grey matter (GM) at high b-values (> 3 ms/mm2)4. Recently, soma and neurite density imaging (SANDI)5 has been proposed to account for the contribution of water diffusing in cell bodies (namely soma) and divides the intra-cellular space into intra-neurite and intra-soma compartments. While SANDI provides histology-correlated estimates of apparent soma and neurite signal fractions6, the current implementation does not account for compartmental T2 relaxation. Recent studies in the WM have shown that T2 differences between intra- and extra-neurite compartments can cause bias and TE-dependence of compartmental signal fractions7–9. Here, we hypothesise that T2 differences between neurite and soma compartments might also exist and investigate the corresponding potential bias and TE-dependence in the signal fractions estimated by SANDI with multi-TE diffusion MRI data. We then propose multi-TE SANDI, an extension of SANDI inspired by the recent multi-TE NODDI9 which accounts for compartment specific T2 relaxation times enabling the first ever quantification of apparent intra-neurite and intra-soma T2.Methods
To investigate the TE-dependence of the SANDI model, multi-TE diffusion datasets were collected from two healthy subjects on a 3T 300 mT/m Connectom scanner. The study was approved by the Cardiff University School of Psychology Ethics Committee and written informed consent was obtained from the participants in the study. The imaging protocols were as follows: at TE=47, 63, 79, 95, 111 and 127 ms, diffusion-weighted images are acquired at b=0, 0.5, 1, 3, 5 and 7 ms/mm2 along 30 diffusion gradient directions uniformly distributed over the hemisphere; gradient pulses separation Δ=22 ms and duration δ=8 ms (fixed across TEs); the image resolution was 2.5 mm isotropic. The data were checked for slice-wise outliers10 and signal drift11, denoised12 and corrected for Gibbs ringing13, subject motion, eddy current-, susceptibility- and gradient nonlinearity induced geometrical distortions14,15.SANDI parameters are estimated for each TE to investigate their TE-dependence. Estimation of relaxation-independent intra-neurite, intra-soma, and extra-cellular signal fractions are conducted making use of their TE-dependence of compartmental signals at b=09. Taking the soma compartment as an example, the compartmental apparent relaxation time $$$T_2^{soma}$$$ and signal $$$S_0^{soma}$$$ can be estimated from $$$S(b=0,TE) f_{soma}(TE)=S_0^{soma}e^{-TE/T_2^{soma}}$$$, where the $$$f_{soma}(TE)$$$ are SANDI estimated fractions at each TE. The relaxation-independent compartmental fractions are then calculated as: $$$f_{soma}^0= S_0^{soma}/(S_0^{soma}+S_0^{neurite}+S_0^{extra})$$$.
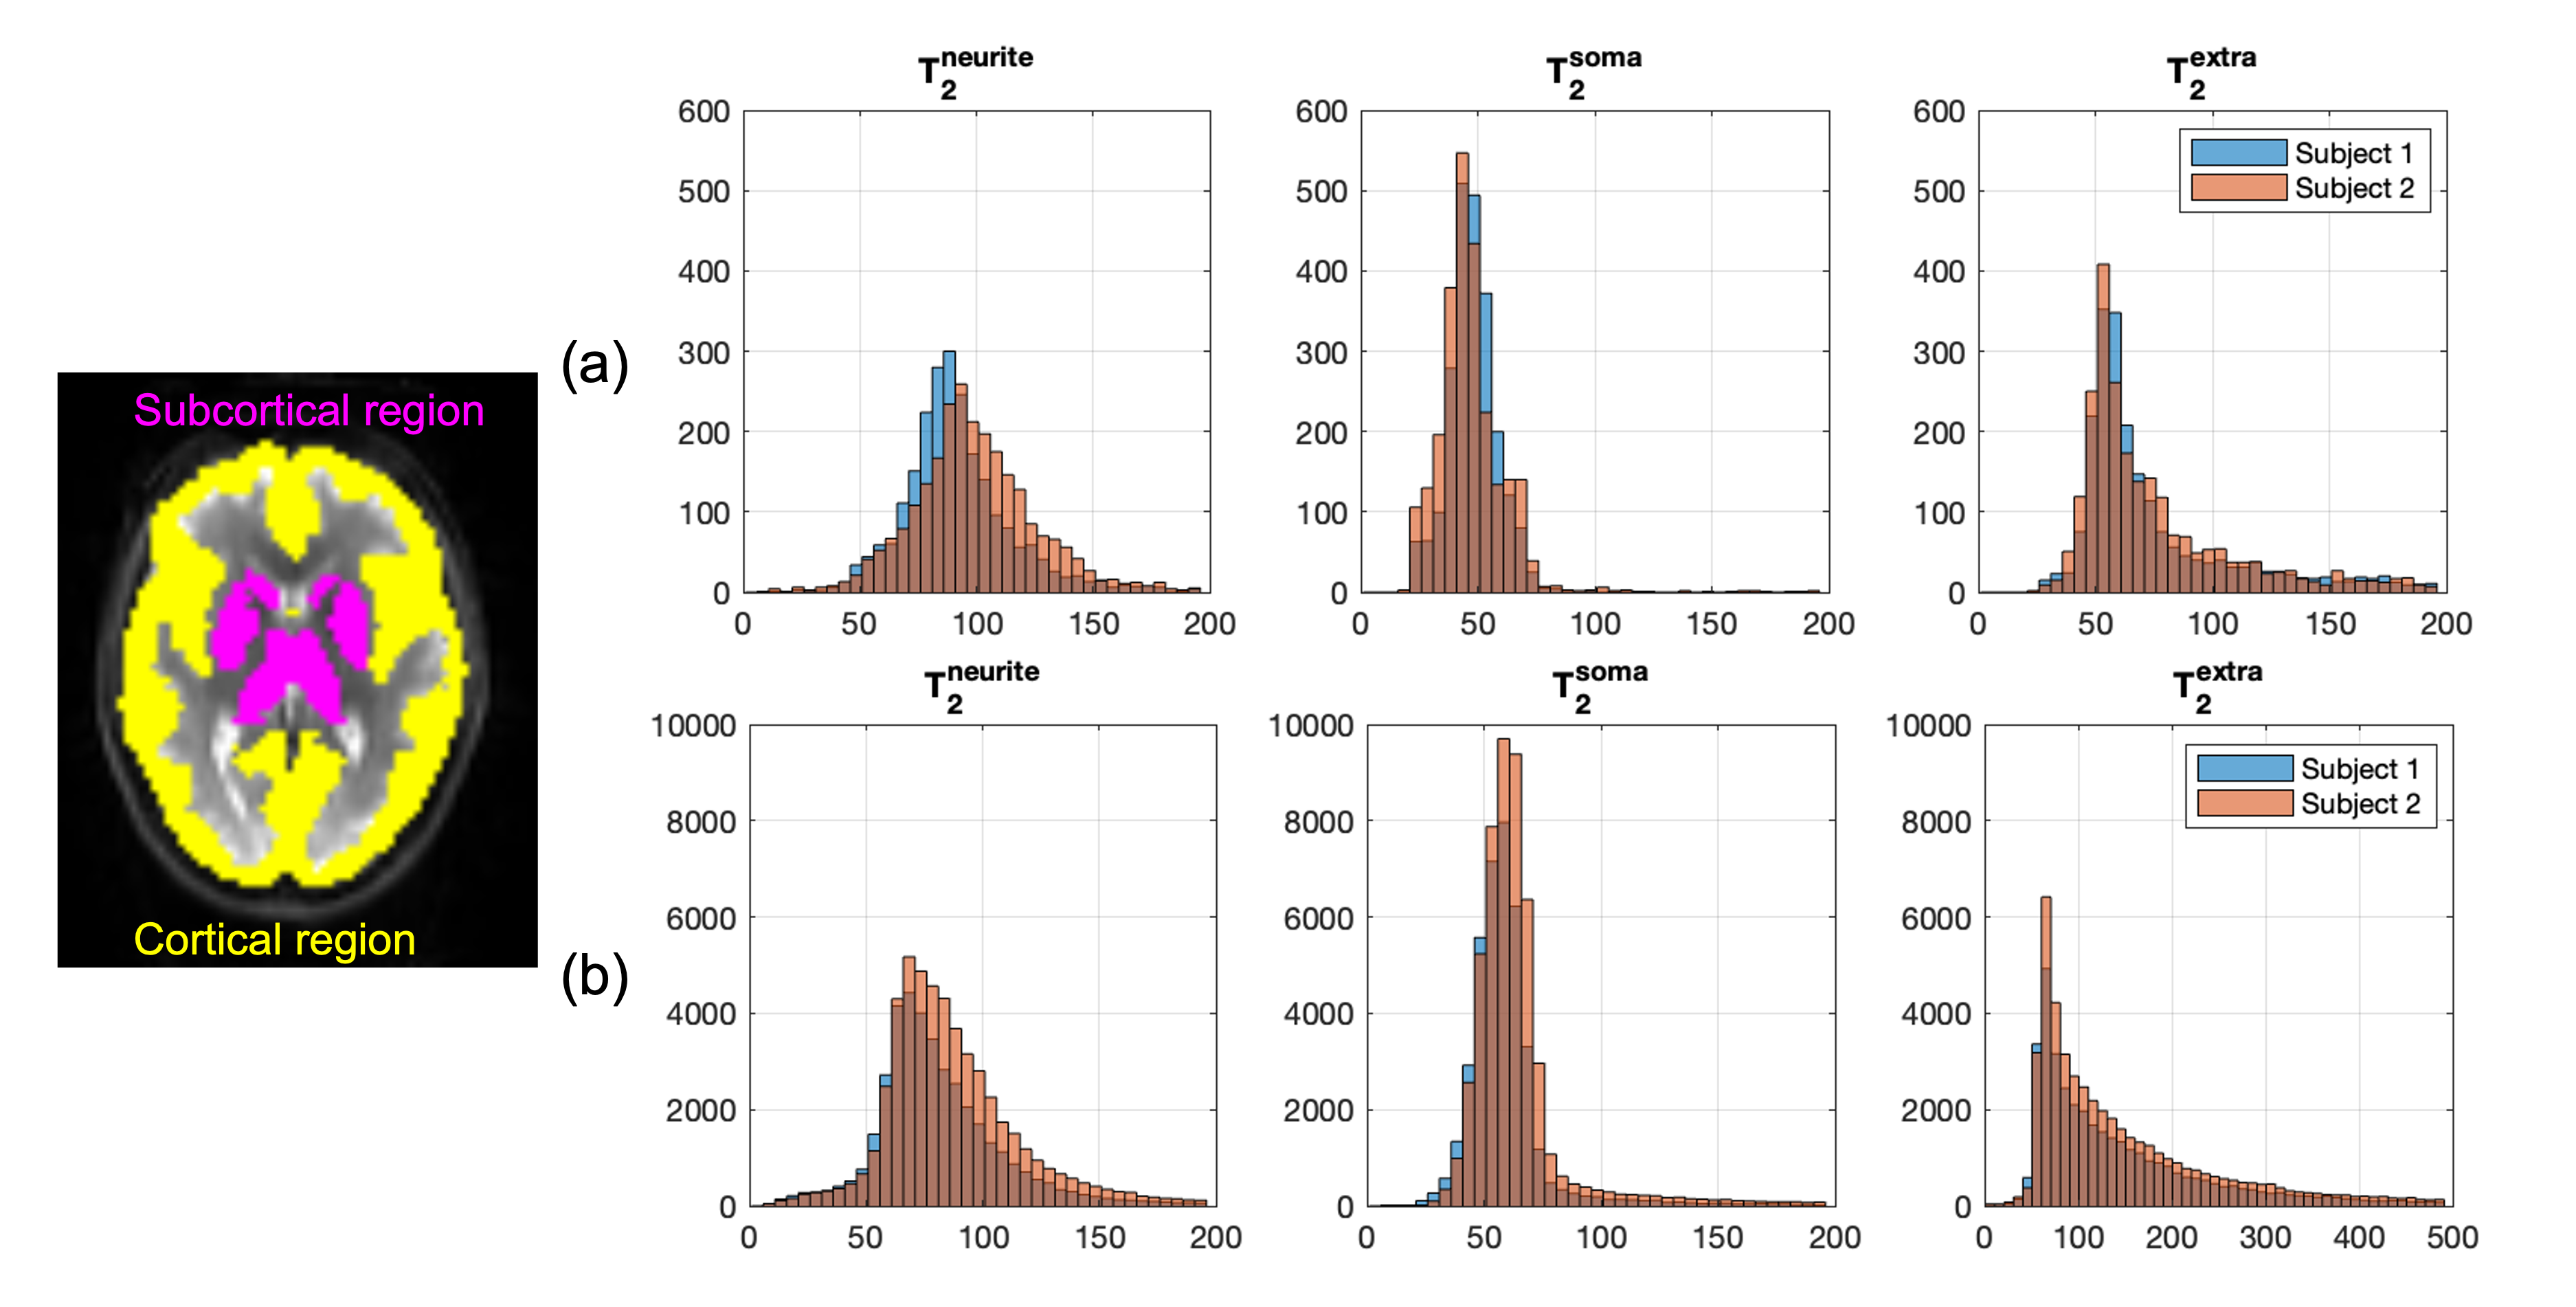
The Harvard-Oxford cortical and subcortical structural atlases were used for region-of-interest (ROI) analysis. The b=0 Images in the native space were first registered to the atlas space using non-linear registration, and the inverse of the resulting warp field was applied to the atlases to transform the ROIs into the subject space16.
Results & Discussion
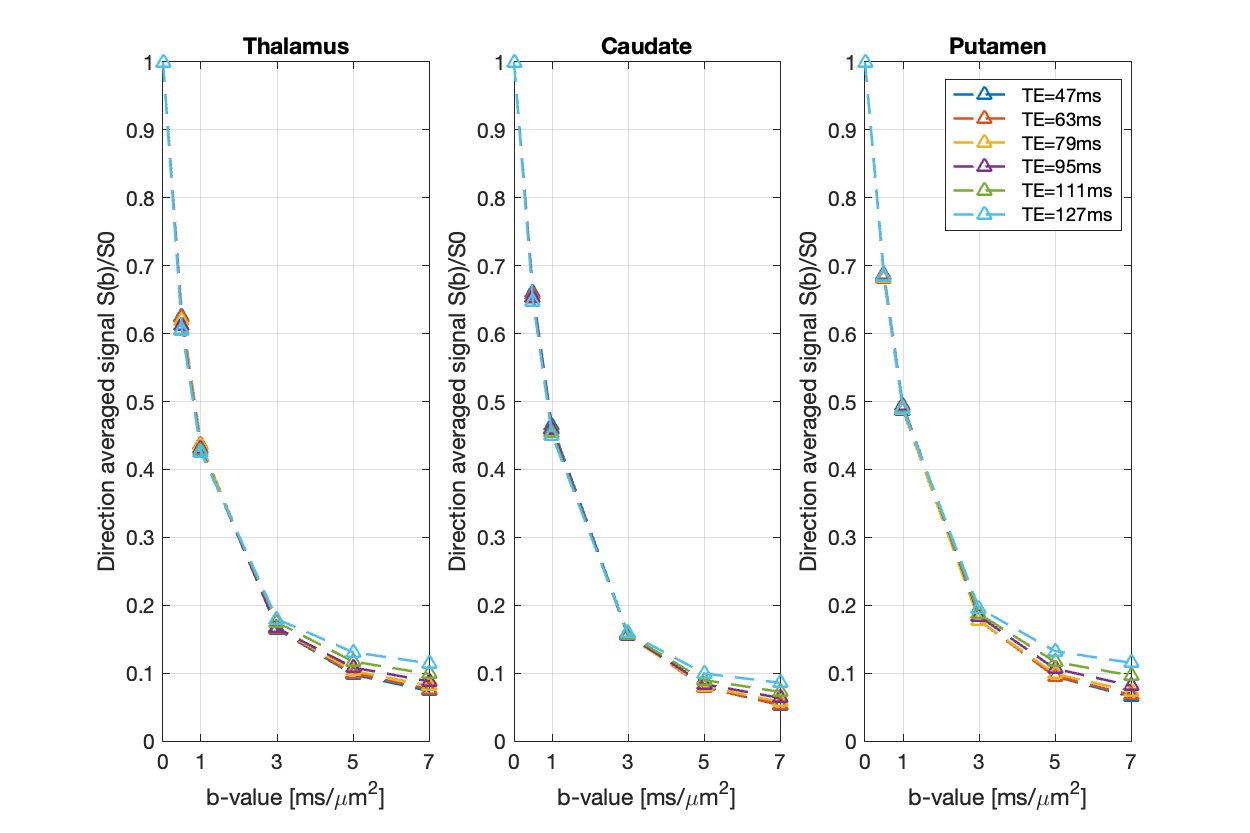
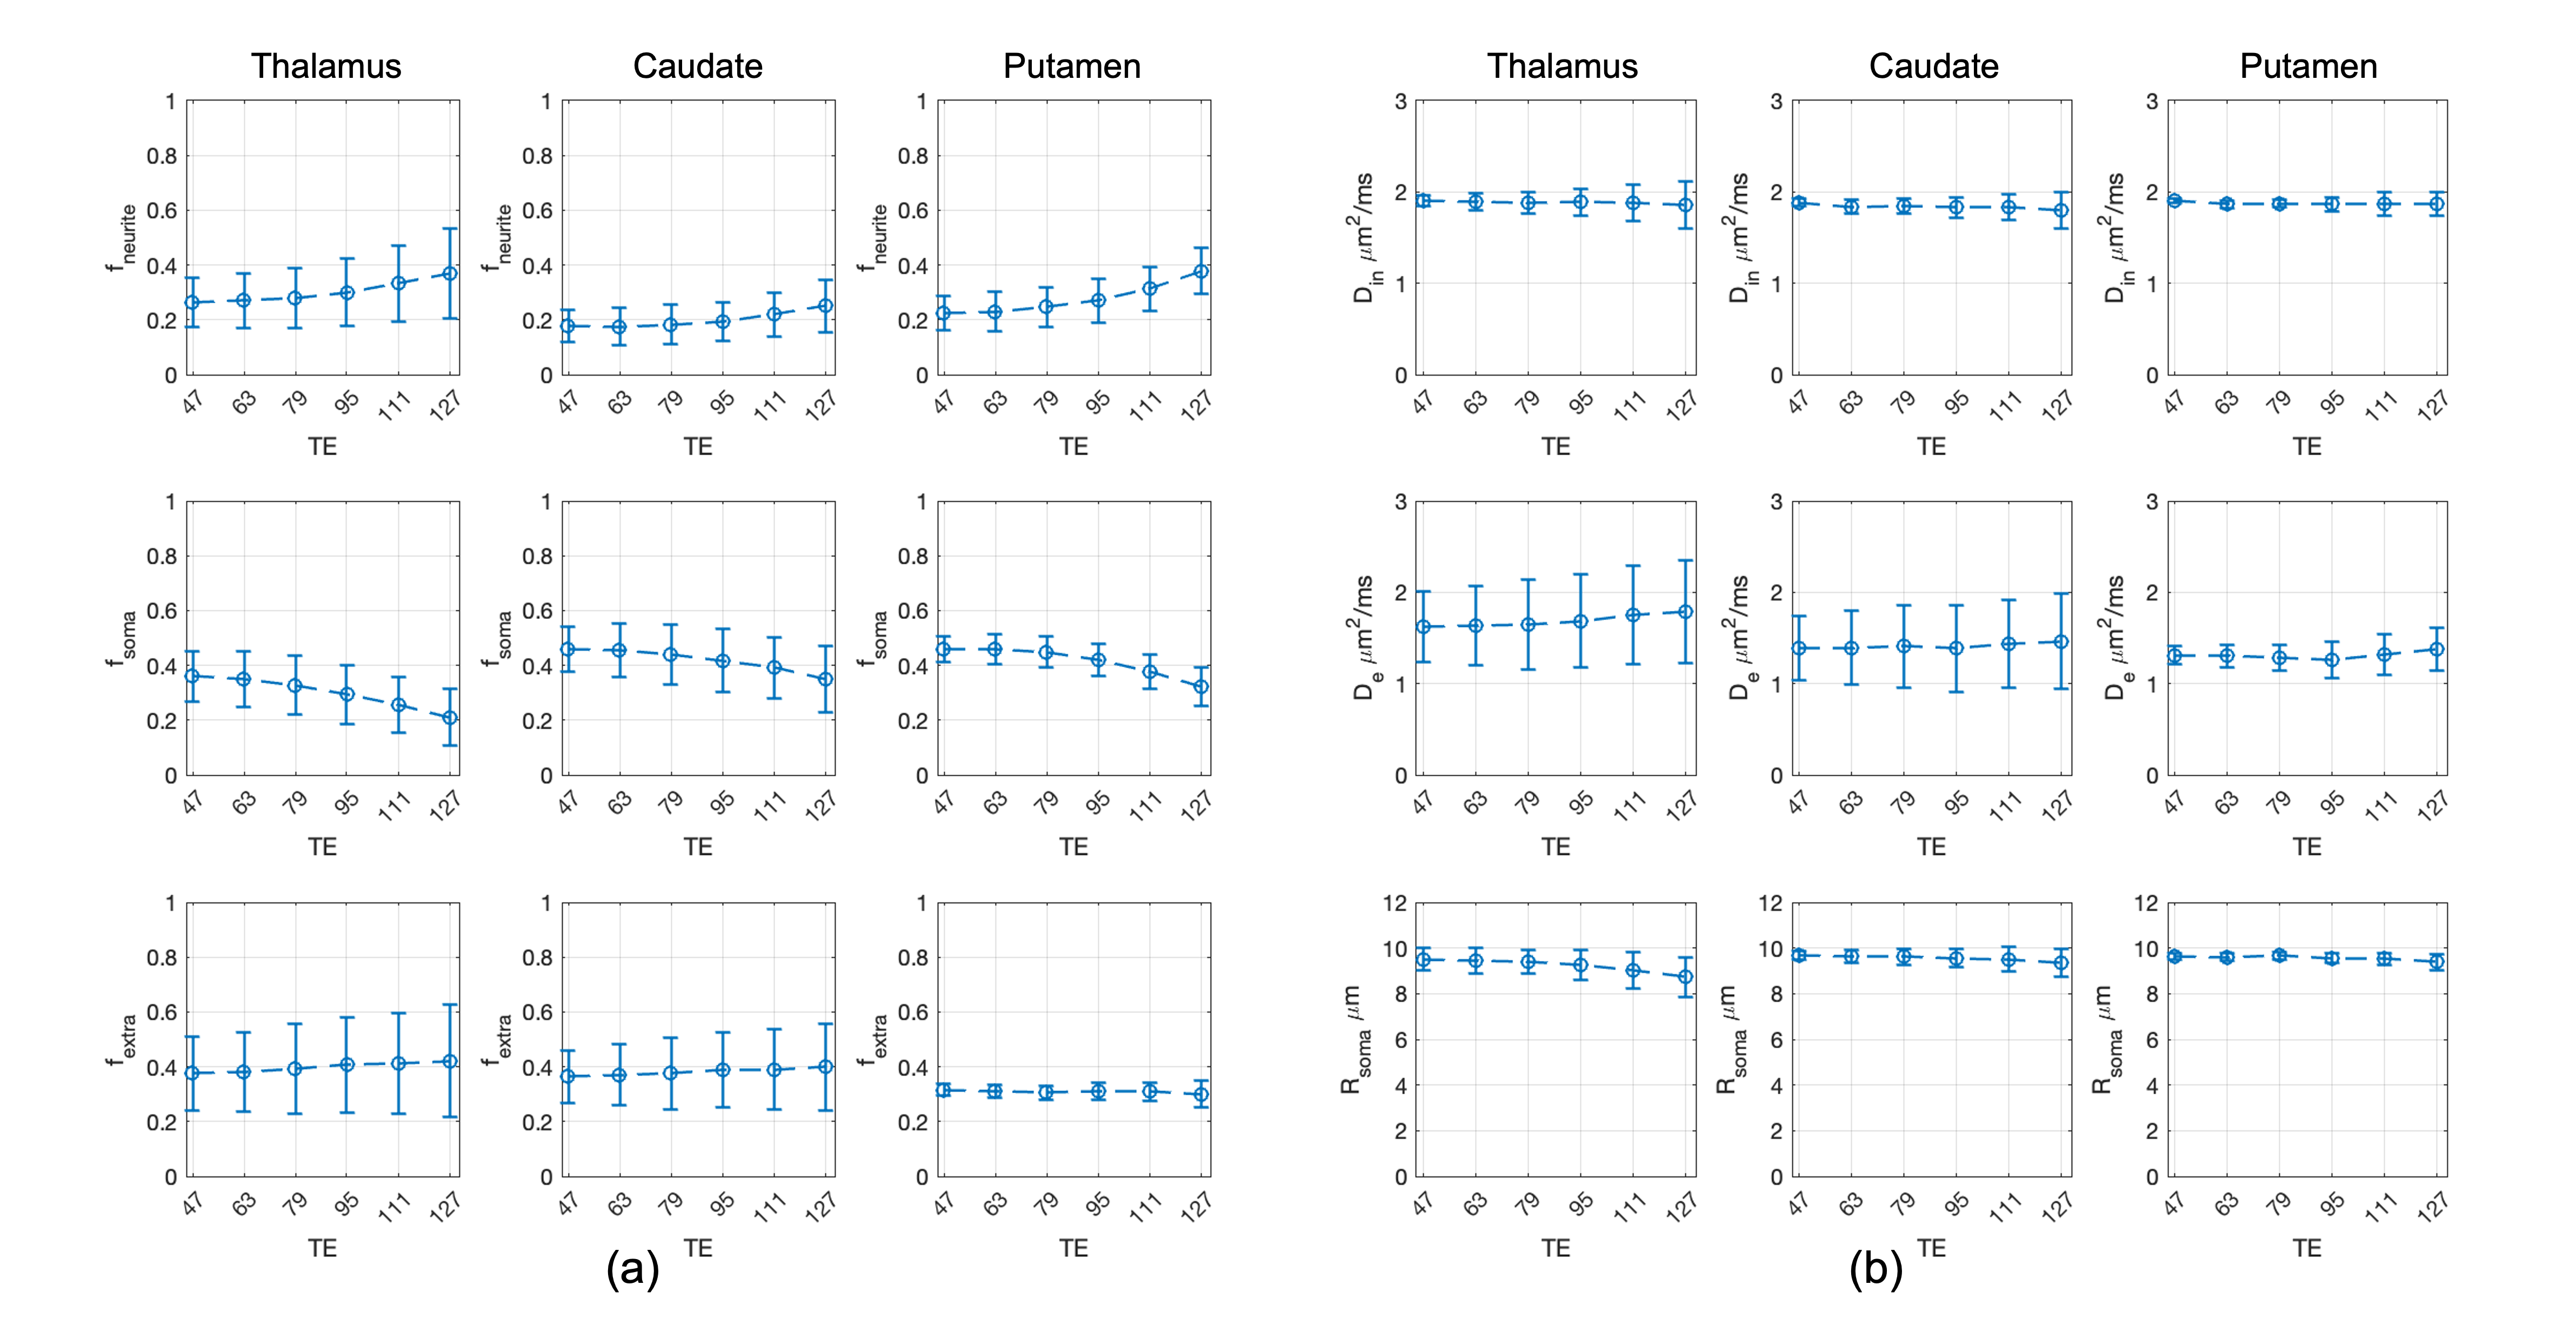
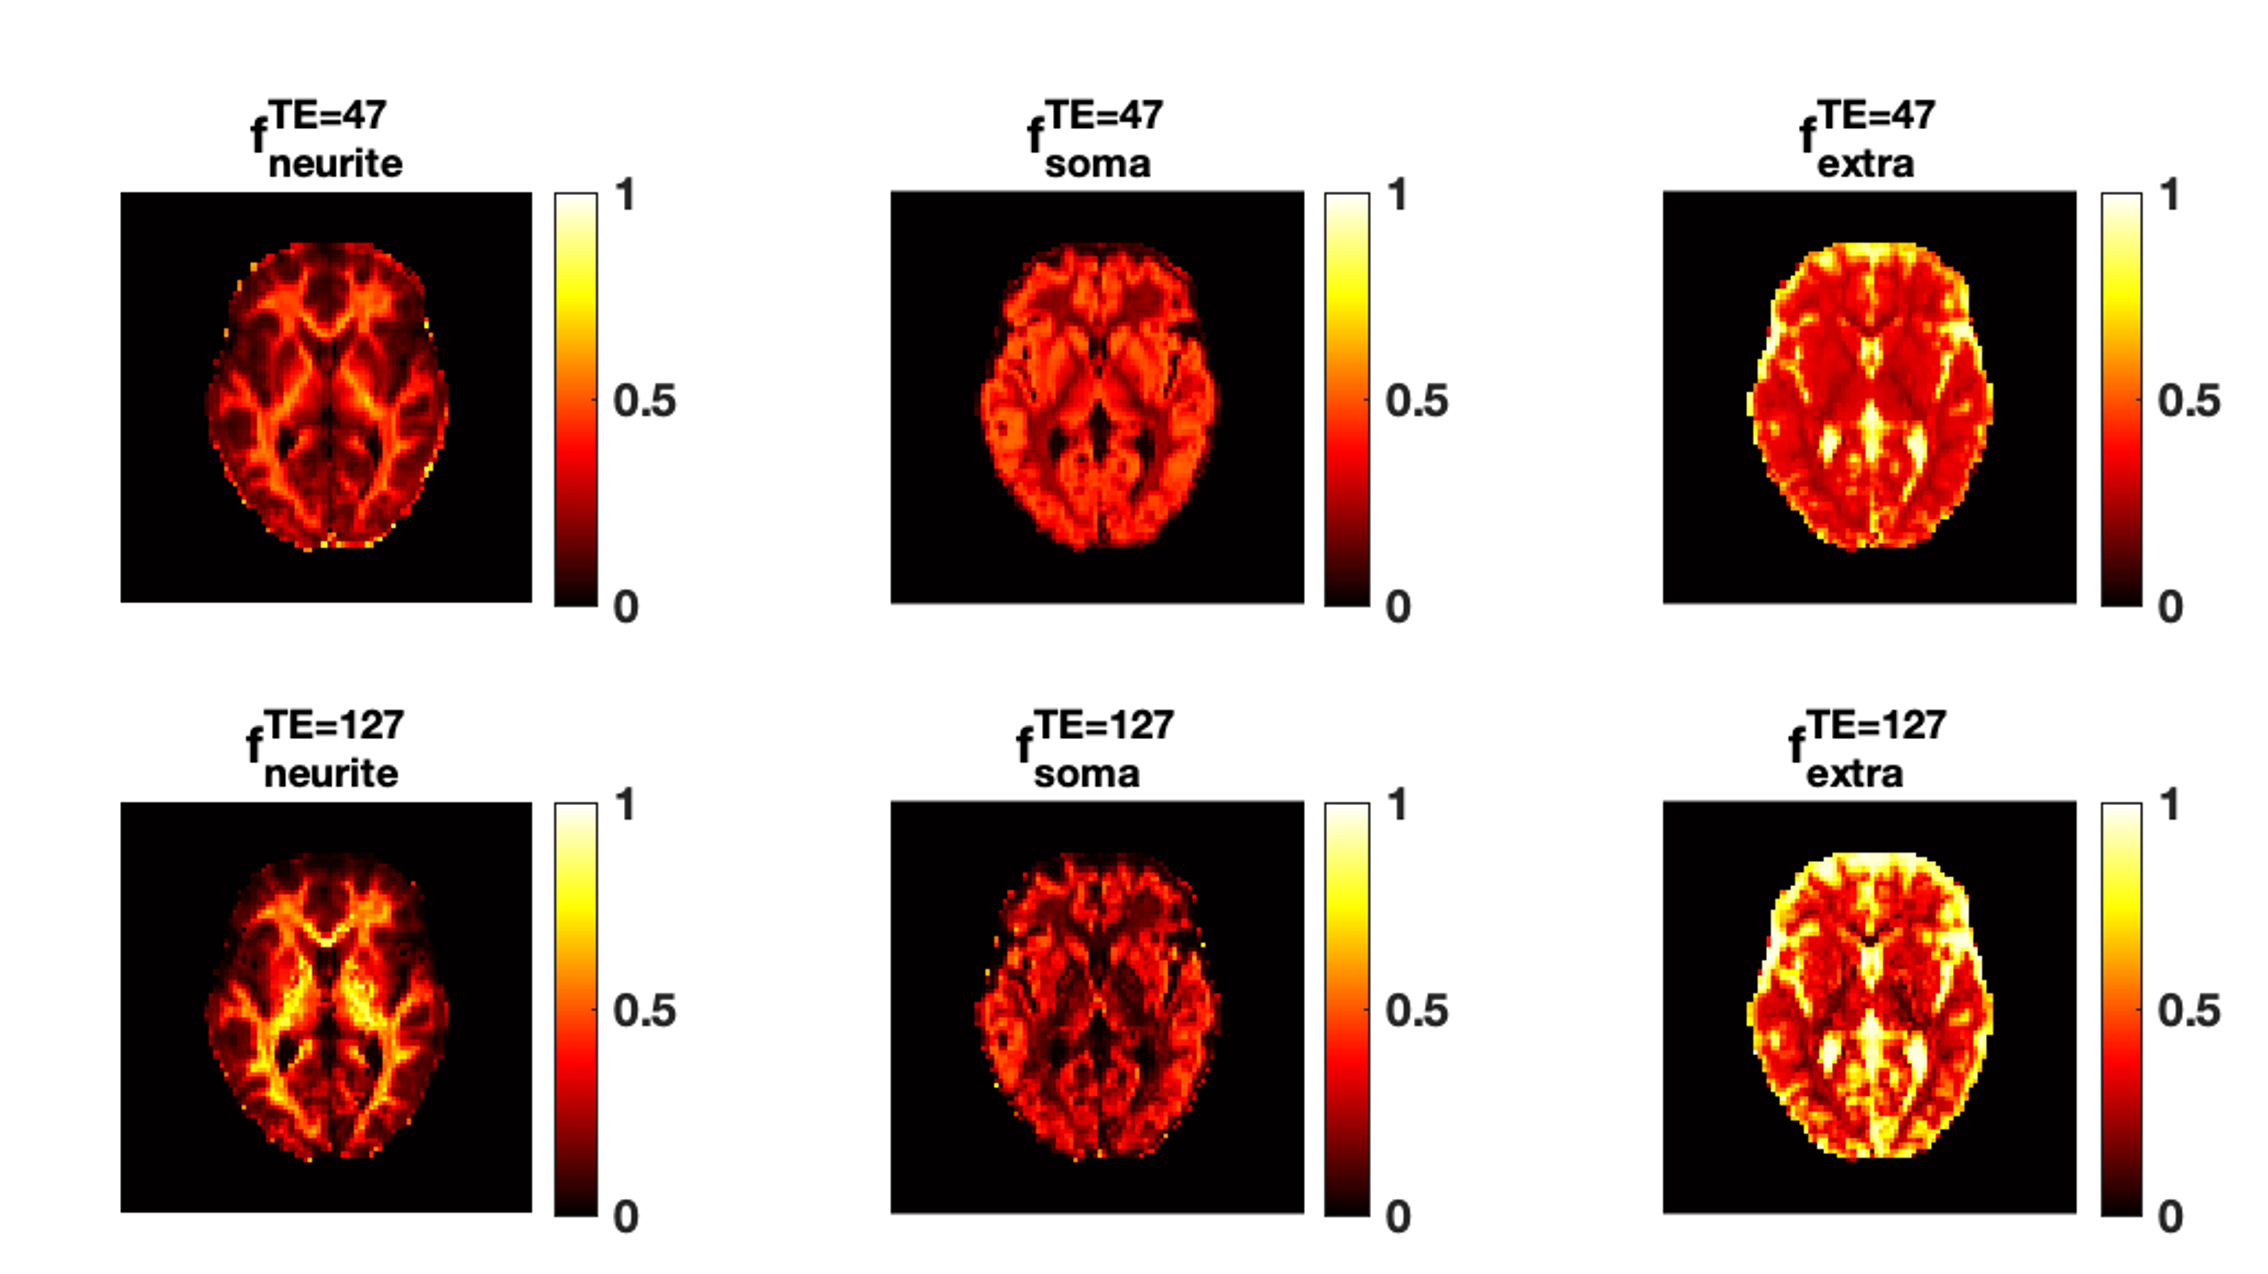
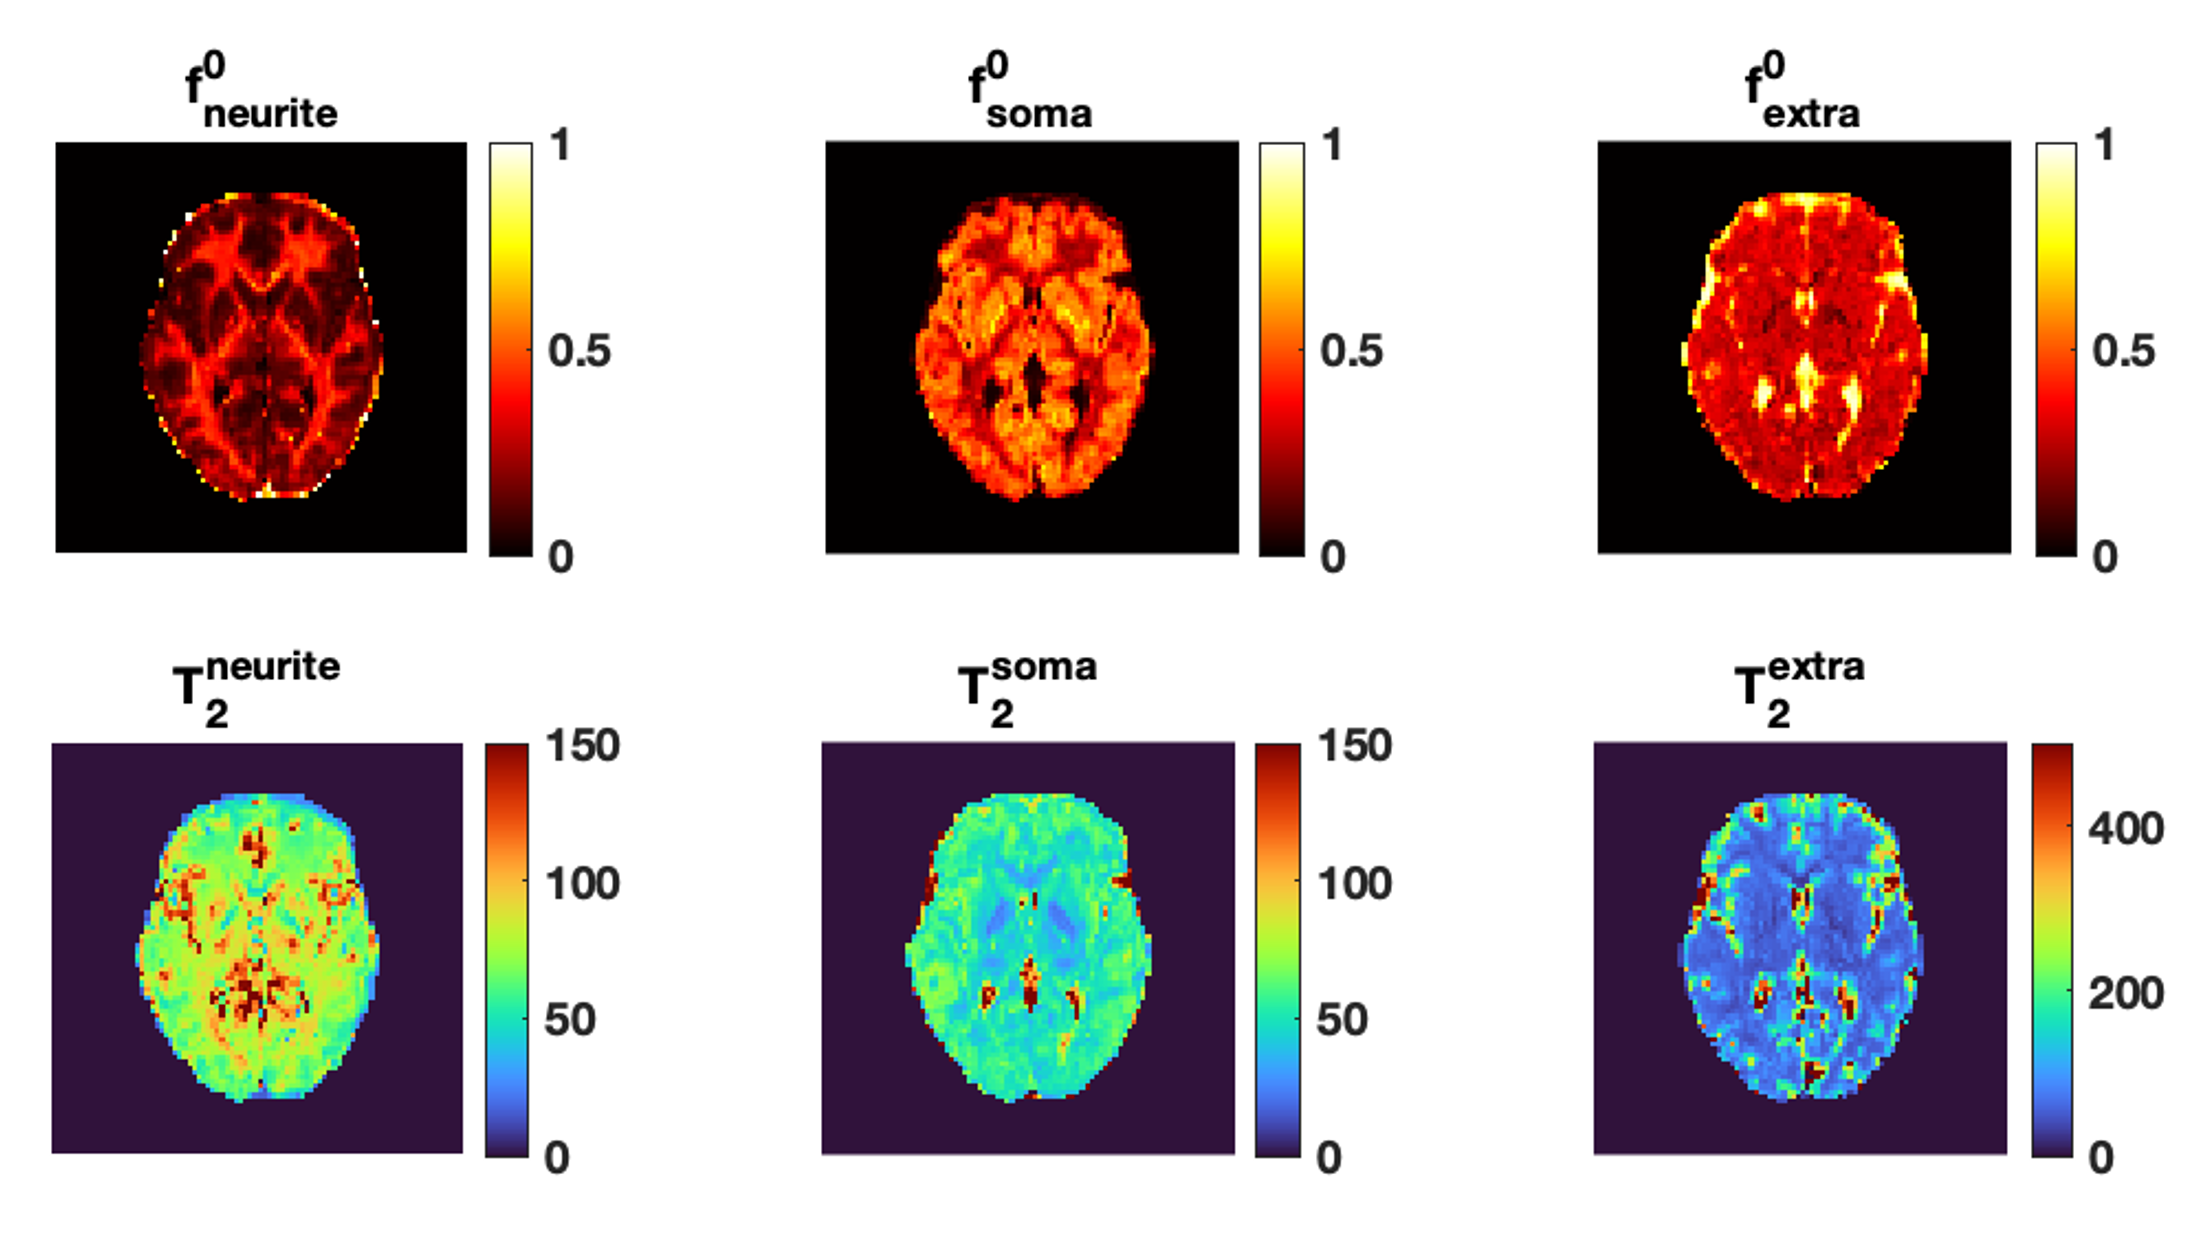
Fig.1 shows the mean normalised diffusion direction-averaged signals at each TE within typical subcortical GM ROIs from a single subject. We excluded cortical GM ROIs due to partial volume with CSF. As TE increases, the diffusion signals decay more slowly at higher b-values. The reduction in signal decay as TE increases results in an estimation of increasing intra-neurite fraction $$$f_{neurite}$$$ and decreasing intra-soma fraction $$$f_{soma}$$$ as shown in Fig.2; the extra-cellular signal fraction $$$f_{extra}$$$ remains relatively stable in these ROIs since $$$ f_{extra}(t)=1-f_{neurite}(t)-f_{soma}(t)$$$; the other SANDI estimated parameters including diffusivities and soma size remains relatively stable in the given ROIs. To demonstrate the impact of TE on SANDI-derived compartmental fractions, maps from the shortest and longest TEs are given in Fig.3.Fig.4 shows the multi-TE SANDI estimated compartmental signal fraction maps and apparent compartmental T2 maps from the dataset in Fig.1 and Fig.2. In the subcortical ROIs, The estimated apparent $$$T_2^{neurite}$$$ (88 [78-99] ms) is much higher than $$$T_2^{soma}$$$ (47 [42-50] ms) and $$$T_2^{extra}$$$ (58 [53-78] ms), causing an over-estimated $$$f_{neurite}$$$ and under-estimated $$$f_{soma}$$$ with single TE data, the extent of which increases as TE increases. While we provide apparent intra-soma T2 estimation for the first time, the range of T2 in the intra-neurite compartment agrees with values reported in previous studies7–9. Moreover, our findings of shorter apparent T2 for the soma compartment also agree with the known different chemical compositions of soma and neurite cytoplasm, with soma having for example more than double the lipid content of neurite17 and more iron18. Nevertheless, further investigations are needed to support our findings and interpretations.
Fig.5 shows the distributions of compartmental T2 values in the whole-brain subcortical and cortical GM region for the two subjects. Findings from the two subjects agree very well with each other. In the cortical GM region, due to CSF contamination, the range of extra-neurite T2 is much higher than intra-neurite and intra-soma T2 estimations. The intra-neurite T2 and intra-soma T2 are more consistent between subcortical and cortical GM.
Conclusion
This study improves the quantification of apparent neurite fraction and soma fraction in the GM, facilitating their interpretation and comparison in future neuroimaging studies. The multi-TE SANDI also estimates the apparent T2 relaxation time of soma for the first time, which could be indicator of iron content and useful in neurodevelopmental and plasticity studies.Acknowledgements
M.P. is supported by the UKRI Future Leaders Fellowship MR/T020296/2. The data were acquired at the UK National Facility for In Vivo MR Imaging of Human Tissue Microstructure funded by the EPSRC (grant EP/M029778/1), and The Wolfson Foundation. DKJ is supported in part by a Wellcome Trust Investigator Award (096646/Z/11/Z) and Wellcome Trust Strategic Award (104943/Z/14/Z). CMWT was supported by the Dutch Research Council (NWO) (17331) and the Wellcome Trust (215944/Z/19/Z).References
1. Zhang H, Schneider T, Wheeler-Kingshott CA, Alexander DC. NODDI: Practical in vivo neurite orientation dispersion and density imaging of the human brain. Neuroimage. 2012;61(4):1000-1016. doi:10.1016/j.neuroimage.2012.03.0722.
2. Novikov DS, Fieremans E, Jespersen SN, Kiselev VG. Quantifying brain microstructure with diffusion MRI: Theory and parameter estimation. NMR Biomed. 2019;32(4). doi:10.1002/nbm.39983.
3. Alexander DC, Dyrby TB, Nilsson M, Zhang H. Imaging brain microstructure with diffusion MRI: practicality and applications. NMR Biomed. 2019;32(4):186-198. doi:10.1002/nbm.38414.
4. McKinnon ET, Jensen JH, Glenn GR, Helpern JA. Dependence on b-value of the direction-averaged diffusion-weighted imaging signal in brain. Magn Reson Imaging. 2017;36. doi:10.1016/j.mri.2016.10.0265.
5. Palombo M, Ianus A, Guerreri M, et al. SANDI: A compartment-based model for non-invasive apparent soma and neurite imaging by diffusion MRI. Neuroimage. 2020;215. doi:10.1016/j.neuroimage.2020.1168356.
6. Ianuş A, Carvalho J, Fernandes FF, et al. Soma and Neurite Density MRI (SANDI) of the in-vivo mouse brain and comparison with the Allen Brain Atlas. Neuroimage. 2022;254. doi:10.1016/j.neuroimage.2022.1191357.
7. Veraart J, Novikov DS, Fieremans E. TE dependent Diffusion Imaging (TEdDI) distinguishes between compartmental T2 relaxation times. Neuroimage. Published online 2018. doi:10.1016/j.neuroimage.2017.09.0308.
8. Lampinen B, Szczepankiewicz F, Novén M, et al. Searching for the neurite density with diffusion MRI: Challenges for biophysical modeling. Hum Brain Mapp. 2019;40(8):2529-2545. doi:10.1002/hbm.245429.
9. Gong T, Tong Q, He H, Sun Y, Zhong J, Zhang H. MTE-NODDI: Multi-TE NODDI for disentangling non-T2-weighted signal fractions from compartment-specific T2 relaxation times. Neuroimage. 2020;217. doi:10.1016/j.neuroimage.2020.11690610.
10. Sairanen V, Leemans A, Tax CMW. Fast and accurate Slicewise OutLIer Detection (SOLID) with informed model estimation for diffusion MRI data. Neuroimage. 2018;181:331-346. doi:10.1016/j.neuroimage.2018.07.00311.
11. Vos SB, Tax CMW, Luijten PR, Ourselin S, Leemans A, Froeling M. The importance of correcting for signal drift in diffusion MRI. Magn Reson Med. 2017;77(1). doi:10.1002/mrm.2612412.
12. Veraart J, Novikov DS, Christiaens D, Ades-aron B, Sijbers J, Fieremans E. Denoising of diffusion MRI using random matrix theory. Neuroimage. 2016;142. doi:10.1016/j.neuroimage.2016.08.01613.
13. Kellner E, Dhital B, Kiselev VG, Reisert M. Gibbs-ringing artifact removal based on local subvoxel-shifts. Magn Reson Med. 2016;76(5). doi:10.1002/mrm.2605414.
14. Andersson JLR, Sotiropoulos SN. An integrated approach to correction for off-resonance effects and subject movement in diffusion MR imaging. Neuroimage. 2016;125:1063-1078. doi:10.1016/j.neuroimage.2015.10.01915.
15. Glasser MF, Sotiropoulos SN, Wilson JA, et al. The minimal preprocessing pipelines for the Human Connectome Project. Neuroimage. 2013;80:105-124. doi:10.1016/j.neuroimage.2013.04.12716.
16. Woolrich MW, Jbabdi S, Patenaude B, et al. Bayesian analysis of neuroimaging data in FSL. Neuroimage. 2009;45(1 Suppl). doi:10.1016/j.neuroimage.2008.10.05517.
17. Calderon RO, Attema B, DeVries GH. Lipid Composition of Neuronal Cell Bodies and Neurites from Cultured Dorsal Root Ganglia. J Neurochem. 1995;64(1). doi:10.1046/j.1471-4159.1995.64010424.x18.
18. Kirilina E, Helbling S, Morawski M, et al. Superficial white matter imaging: Contrast mechanisms and whole-brain in vivo mapping. Sci Adv. Published online 2020. doi:10.1126/sciadv.aaz9281
Figures