0765
Effects of SNR on T2 and T2* estimates from a cardiac gradient-echo spin-echo (GESE) echo planar sequence1University of Utah, Salt Lake City, UT, United States, 2UCAIR, salt lake city, UT, United States
Synopsis
Keywords: Signal Modeling, Multi-Contrast, Gradient-echo spin-echo (GESE); Echo Planar;
The bias and precision of T2 and T2* estimates for a five-echo GESE model were studied using CRLB and Monte Carlo simulations. Different SNR cases were implemented by varying the standard deviation of added noise or the T2/T2* ratio. An in-vivo study with high SNRs for all EPI readouts was performed to validate the simulation.
Introduction
Combined multi-echo GE and SE echo-planar imaging (EPI) sequences for the simultaneous quantification of T2 and T2* have been shown to be useful in brain perfusion quantification [1, 2]. Recently this approach has been extended to myocardial oxygenation [3]. However, the SNR influences on T2 and T2* estimation bias and precision have not been studied in depth. This is an important consideration since noise levels can be affected by various factors in both acquisition and post-processing. To guide the simultaneous quantification of T2 and T2* values with a GESE method, two valuable statistical tools, the CRLB and Monte Carlo method, are implemented in simulations.Methods
Figure 1 shows the GESE sequence used in this work. A reduced field-of-view is achieved with an outer volume suppression technique that is different from the saturation pulses used in previous cardiac applications [3-5]. Five EPI images were acquired to fit T2 and T2* along with S01 and S02 to account for RF profile mismatch between the excitation and refocus RF pulses in the GESE signal model equation [6].Two aspects of SNR requirements were studied in the simulation. For the first, Rician noise was added to each readout to study a range of SNR from 1 to 10 in the last (fifth) echo signal. Secondly, the T2/T2* ratio of the myocardium varies from person to person. In addition, a particular T2/T2* ratio may cause a flat signal decay for the mixed spin-echo duration, hence noise may affect the bias and precision of T2 estimation. Varying the T2/T2* ratio from 1.3 to 2.3 with a fixed noise standard deviation ($$$\sigma$$$noise) can be performed to study the effect on T2 bias and precision. Other fixed parameters for the simulation include T2=40ms and T2*=25ms, the ratio of two signals (S01/S02=1.25), the first EPI readout time was 10ms, and the echo spacing was 15ms. Additionally, a nonlinear least-square fitting algorithm with Monte Carlo simulations was implemented to estimate T2 and T2* values given noisy data.
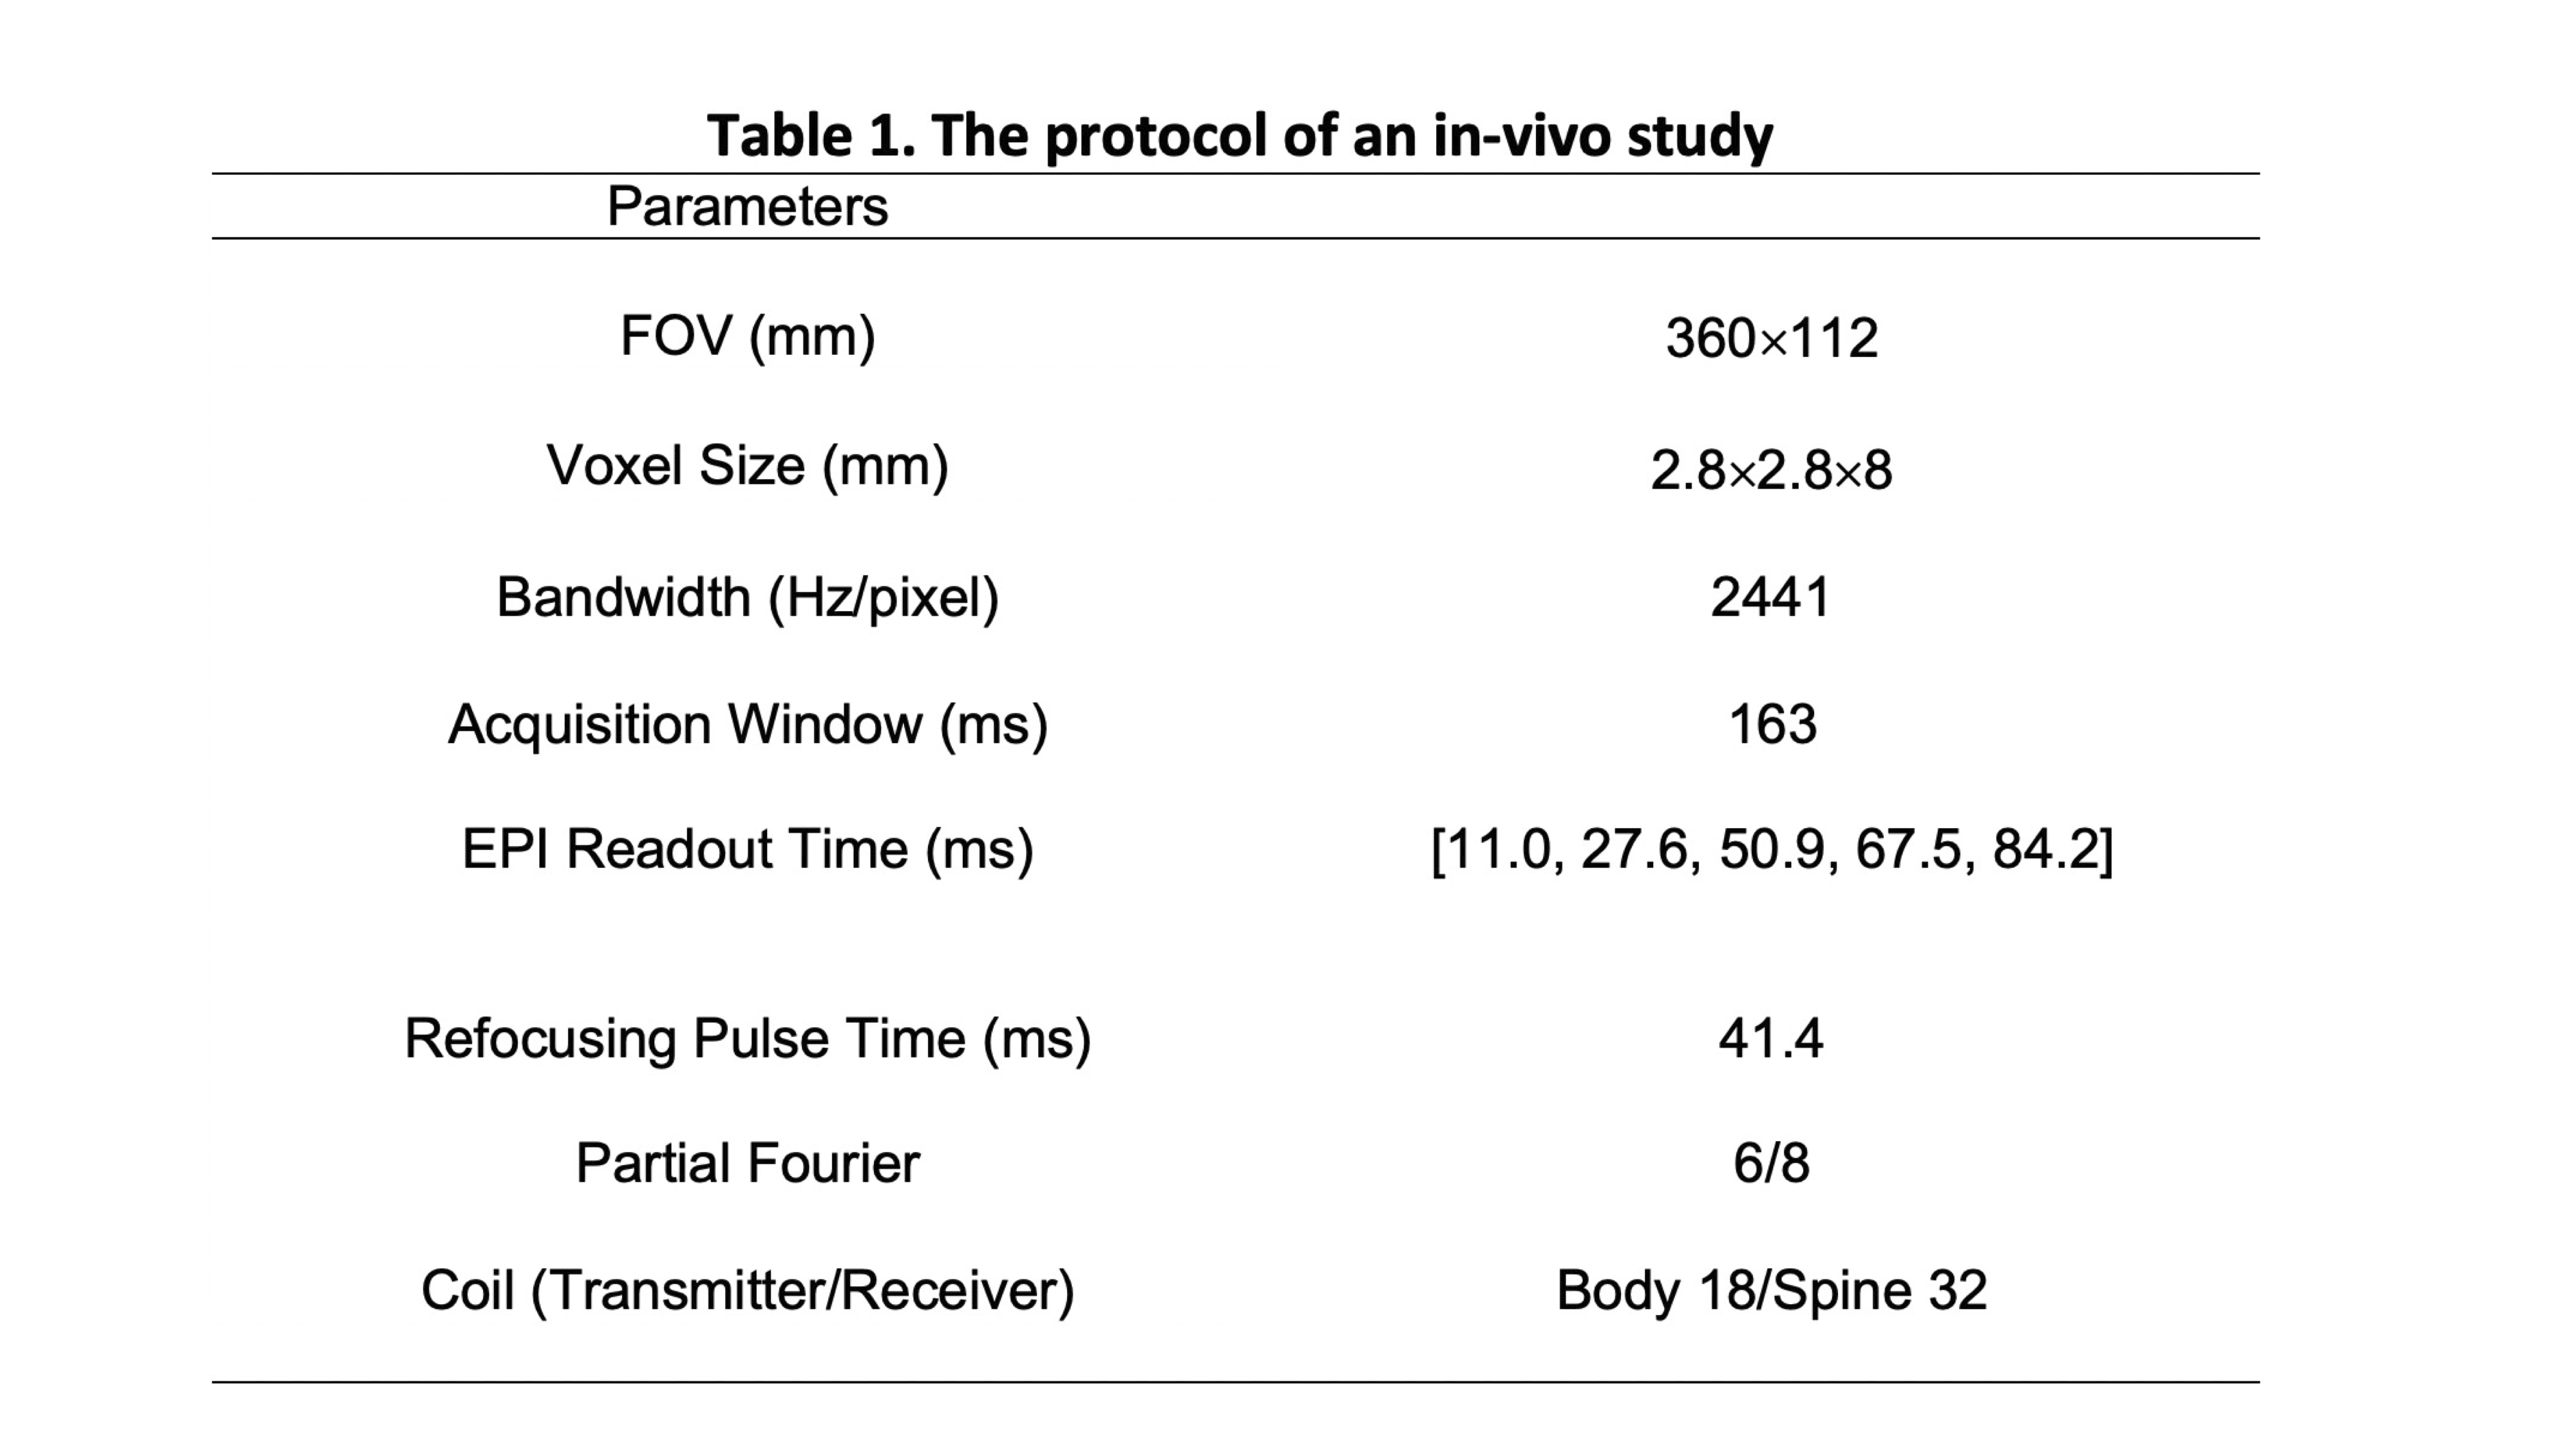
A normal subject was imaged on a 3T MRI scanner (Vida, Siemens AG, Erlangen, Germany). The GESE sequence obtained five single-shot EPI echoes and a 6/8 partial Fourier for each echo image. Each image was from 24 k-space lines acquired in the single-shot EPI readout. Details of the acquisitions are in Table 1. Clinical T2 maps used a T2-prepared sequence (TE = 0,30,55ms), and T2* values used a multi-echo gradient echo sequence. The SNR of the GESE data was calculated from the difference image between two consecutive frames that had the most similar echo signals from the same region of interest as in [7].
Results
Figure 2 shows the minimal standard deviation bound of T2 and T2* using CRLB simulations. A dramatic improvement of the CRLB can be observed with the increase of SNR for a fixed T2/T2* ratio in 2(A), and T2 tends to have a larger CRLB than T2* for the GESE sequence. Figure 2(B) shows the effect of the T2/T2* ratio on the longitudinal magnetization evolution after the refocusing pulse. The intersections of five vertical lines with the magnetization time curves reflect the center of the five readout times. Figure 2(C) and (D) show that the CLRB for T2 increases as the T2/T2* ratio increases while it changes little for T2*. Figure 3 shows the estimation bias and standard deviation of T2 and T2* under different SNR conditions. Figure 3(A) and (B) indicate that the bias and standard deviation decrease as the SNR increases. For T2/T2*=1.6 in 3(A), the bias for T2 and T2* is smaller than 1ms (black dotted lines) when SNR is greater than 6. On the other hand, when a low noise level is fixed in 3(C), the T2/T2* ratio has little impact on the estimation. However, given a larger noise level in 3(D), the bias of T2 increases for larger T2/T2* ratios.The SNR of five EPI readouts for the in-vivo study is [90,54,26,23,19]. The benefit of high SNR can give comparable T2 and T2* values (T2: 39.9 ± 5.3ms; T2*: 29.7 ± 3.8ms) with the reference values (T2: 40.2 ± 2.0ms; T2*: 29.0 ± 1.6ms) from clinical mapping methods.
Discussion
In this study, the bias and precision are dependent on the SNR requirement for the readouts. Specifically, the simulation suggests that an SNR requirement larger than 6 for the last echo signal can obtain T2 and T2* bias smaller than 1ms when T2/T2* ratio is 1.6. Since a normal T2/T2* ratio is ~1.5, the in-vivo study with SNR greater than 19 can obtain T2 and T2* values with low bias, as expected from simulations. SNR requirements may become challenging for in-vivo studies when the spatial resolution needs to be increased or if parallel imaging with lower SNR is used.Conclusion
The GESE sequence with varying SNR was studied in this work. The CRLB and Monte Carlo simulations with a nonlinear fitting show that SNR > 6 for T2/T2* < 2 and SNR > 10 for T2/T2* >= 2 are the requirements for obtaining comparable T2 and T2* values with clinical mappings.Acknowledgements
No acknowledgement found.References
[1] P.A. Bandettini, E.C. Wong, A. Jesmanowicz, R.S. Hinks, J.S. Hyde, Spin-echo and gradient-echo EPI of human brain activation using BOLD contrast: a comparative study at 1.5 T, NMR Biomed 7(1-2) (1994) 12-20.
[2] M. Han, B. Yang, B. Fernandez, M. Lafontaine, P. Alcaide-Leon, A. Jakary, B.L. Burns, M.A. Morrison, J.E. Villanueva-Meyer, S.M. Chang, S. Banerjee, J.M. Lupo, Simultaneous multi-slice spin- and gradient-echo dynamic susceptibility-contrast perfusion-weighted MRI of gliomas, NMR Biomed 34(1) (2021) e4399.
[3] M. van den Boomen, M.K. Manhard, G.J.H. Snel, S. Han, K.E. Emblem, R. Slart, D.E. Sosnovik, C. Catana, B.R. Rosen, N.H.J. Prakken, C.T. Nguyen, R.J.H. Borra, K. Setsompop, Blood Oxygen Level-Dependent MRI of the Myocardium with Multiecho Gradient-Echo Spin-Echo Imaging, Radiology 294(3) (2020) 538-545.
[4] S. Weingärtner, S. Moeller, S. Schmitter, M. Akçakaya, Highly-Accelerated Simultaneous Multi-Slice CMR Using Outer Volume Suppression: Time-Efficient Characterization of Cardiac Function In A Single Breath-hold, Proceedings of the Society for Cardiovascular Magnetic Resonance (2018).
[5] D.Y. Zeng, C.A. Baron, M.O. Malave, A.B. Kerr, P.C. Yang, B.S. Hu, D.G. Nishimura, Combined T2 -preparation and multidimensional outer volume suppression for coronary artery imaging with 3D cones trajectories, Magn Reson Med 83(6) (2020) 2221-2231.
[6] H. Schmiedeskamp, M. Straka, R. Bammer, Compensation of slice profile mismatch in combined spin- and gradient-echo echo-planar imaging pulse sequences, Magn Reson Med 67(2) (2012) 378-88.
[7] O. Dietrich, J.G. Raya, S.B. Reeder, M.F. Reiser, S.O. Schoenberg, Measurement of signal-to-noise ratios in MR images: influence of multichannel coils, parallel imaging, and reconstruction filters, J Magn Reson Imaging 26(2) (2007) 375-85.
Figures
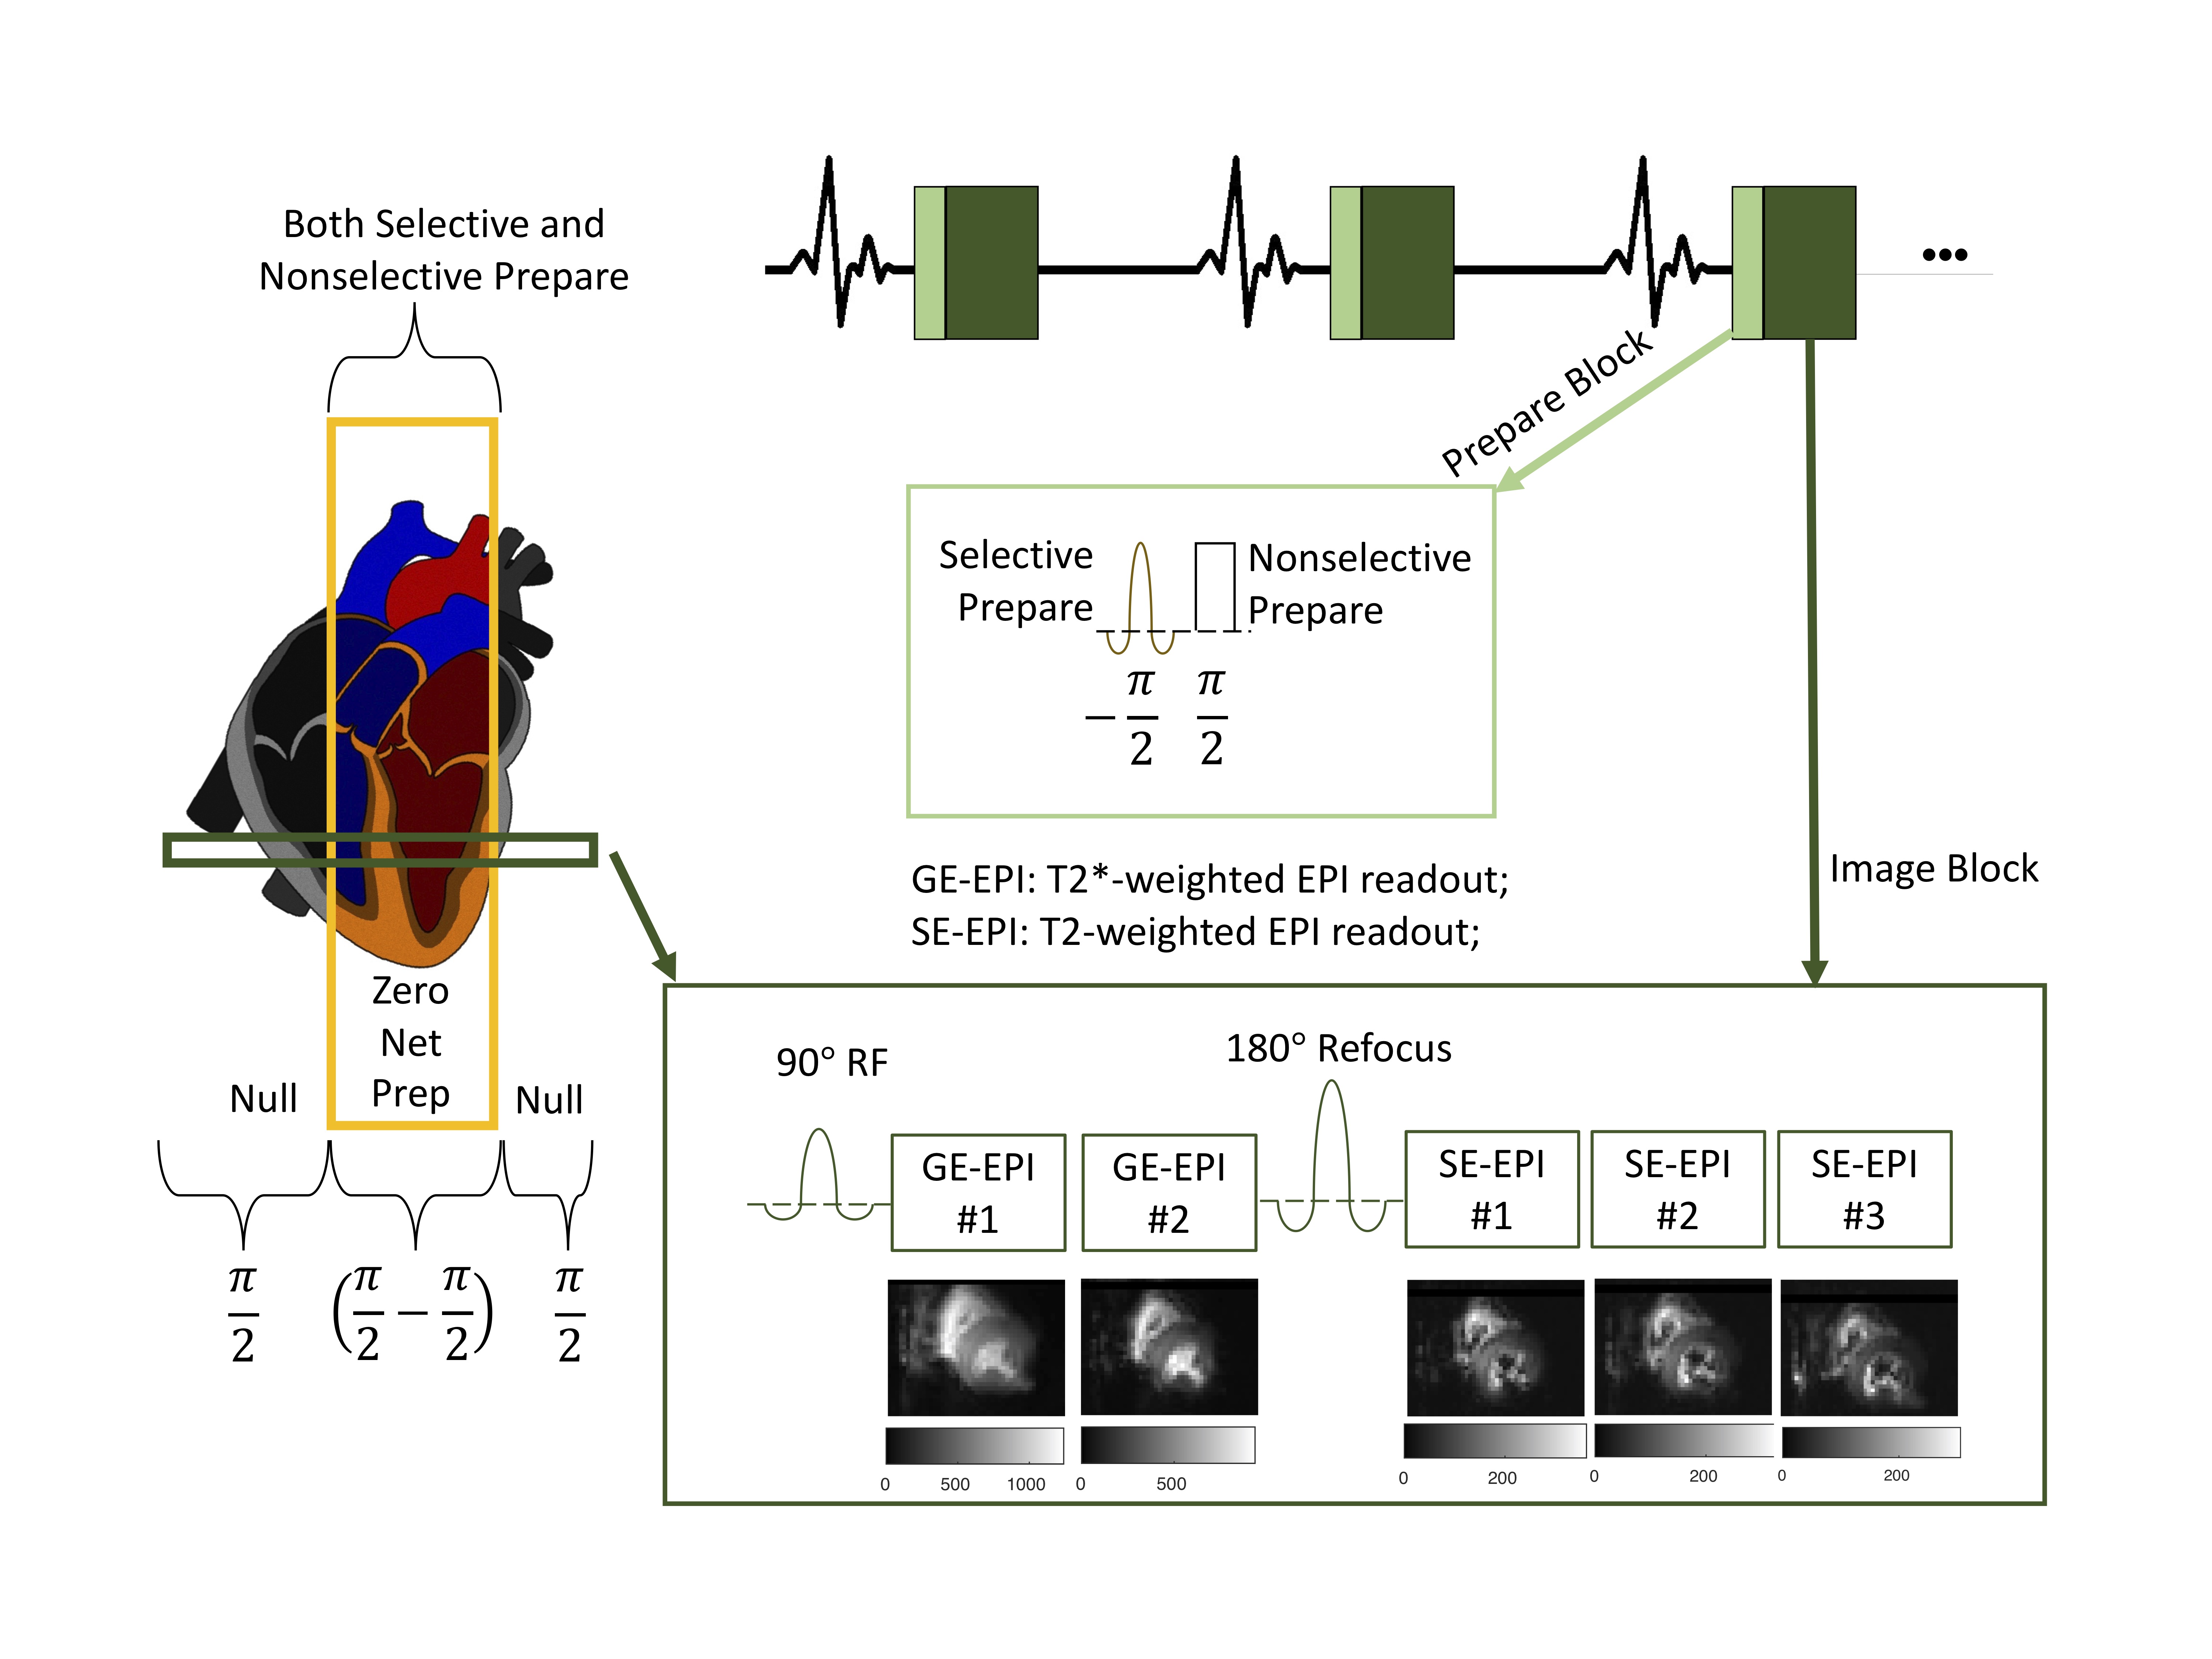
Figure 1. The GESE sequence. A novel outer volume suppression was implemented. Specifically, the magnetization in the volume of interest is moved into the transverse plane with a selective pulse. The spins in the volume of interest are then returned to the longitudinal plane with the non-selective pulse while everything else is saturated. The time between the peak of the selective pulse and the start of the non-selective pulses is 1.07ms. The GESE sequence acquired five EPI readouts, including two gradient-echo images and three mixed spin-echo images.
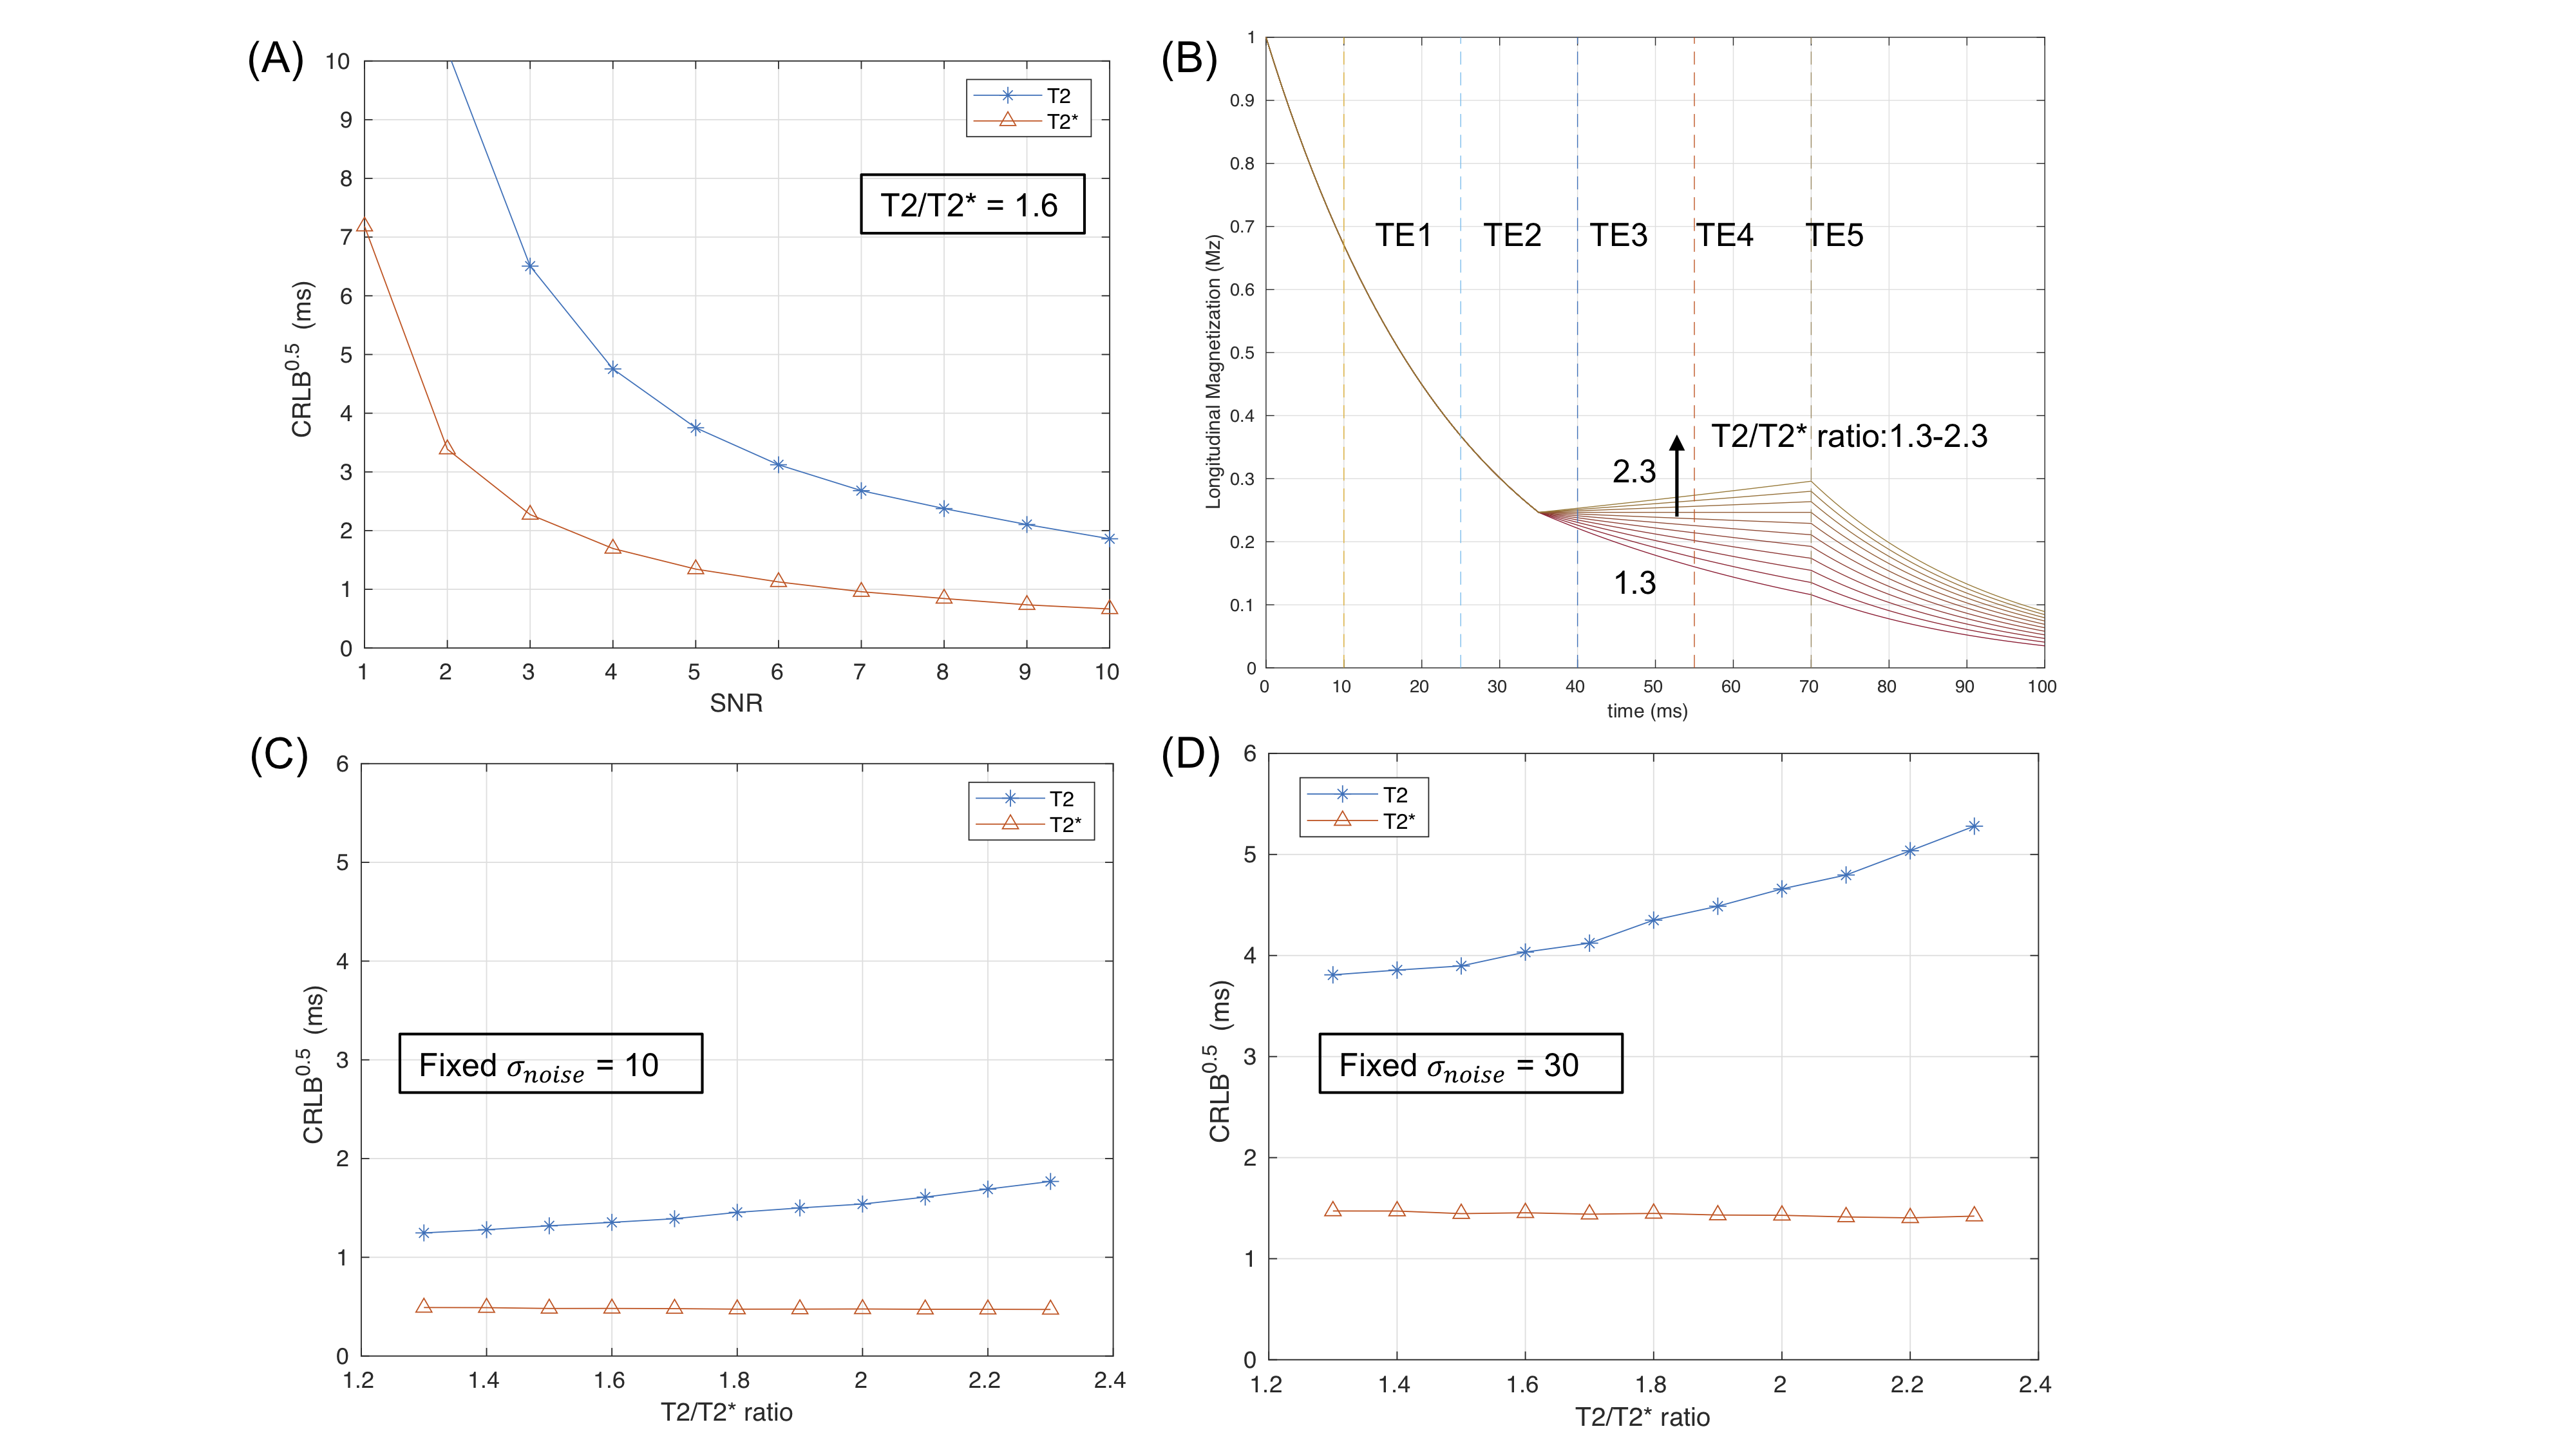
Figure 2. CRLB simulations with changing SNR or T2/T2* ratio. (A) shows the dependency of the square root of CRLB on the SNR variation. (B) shows the magnetization evolution of the GESE model with different T2/T2* ratios, ranging from 1.3 to 2.3, and five echo times (vertical lines) were applied for the simulation. (C) and (D) show the effect of the T2/T2* ratio on CRLB with fixed noise standard deviation. The CRLB of T2 increases with the T2/T2* ratio while T2* changes little.
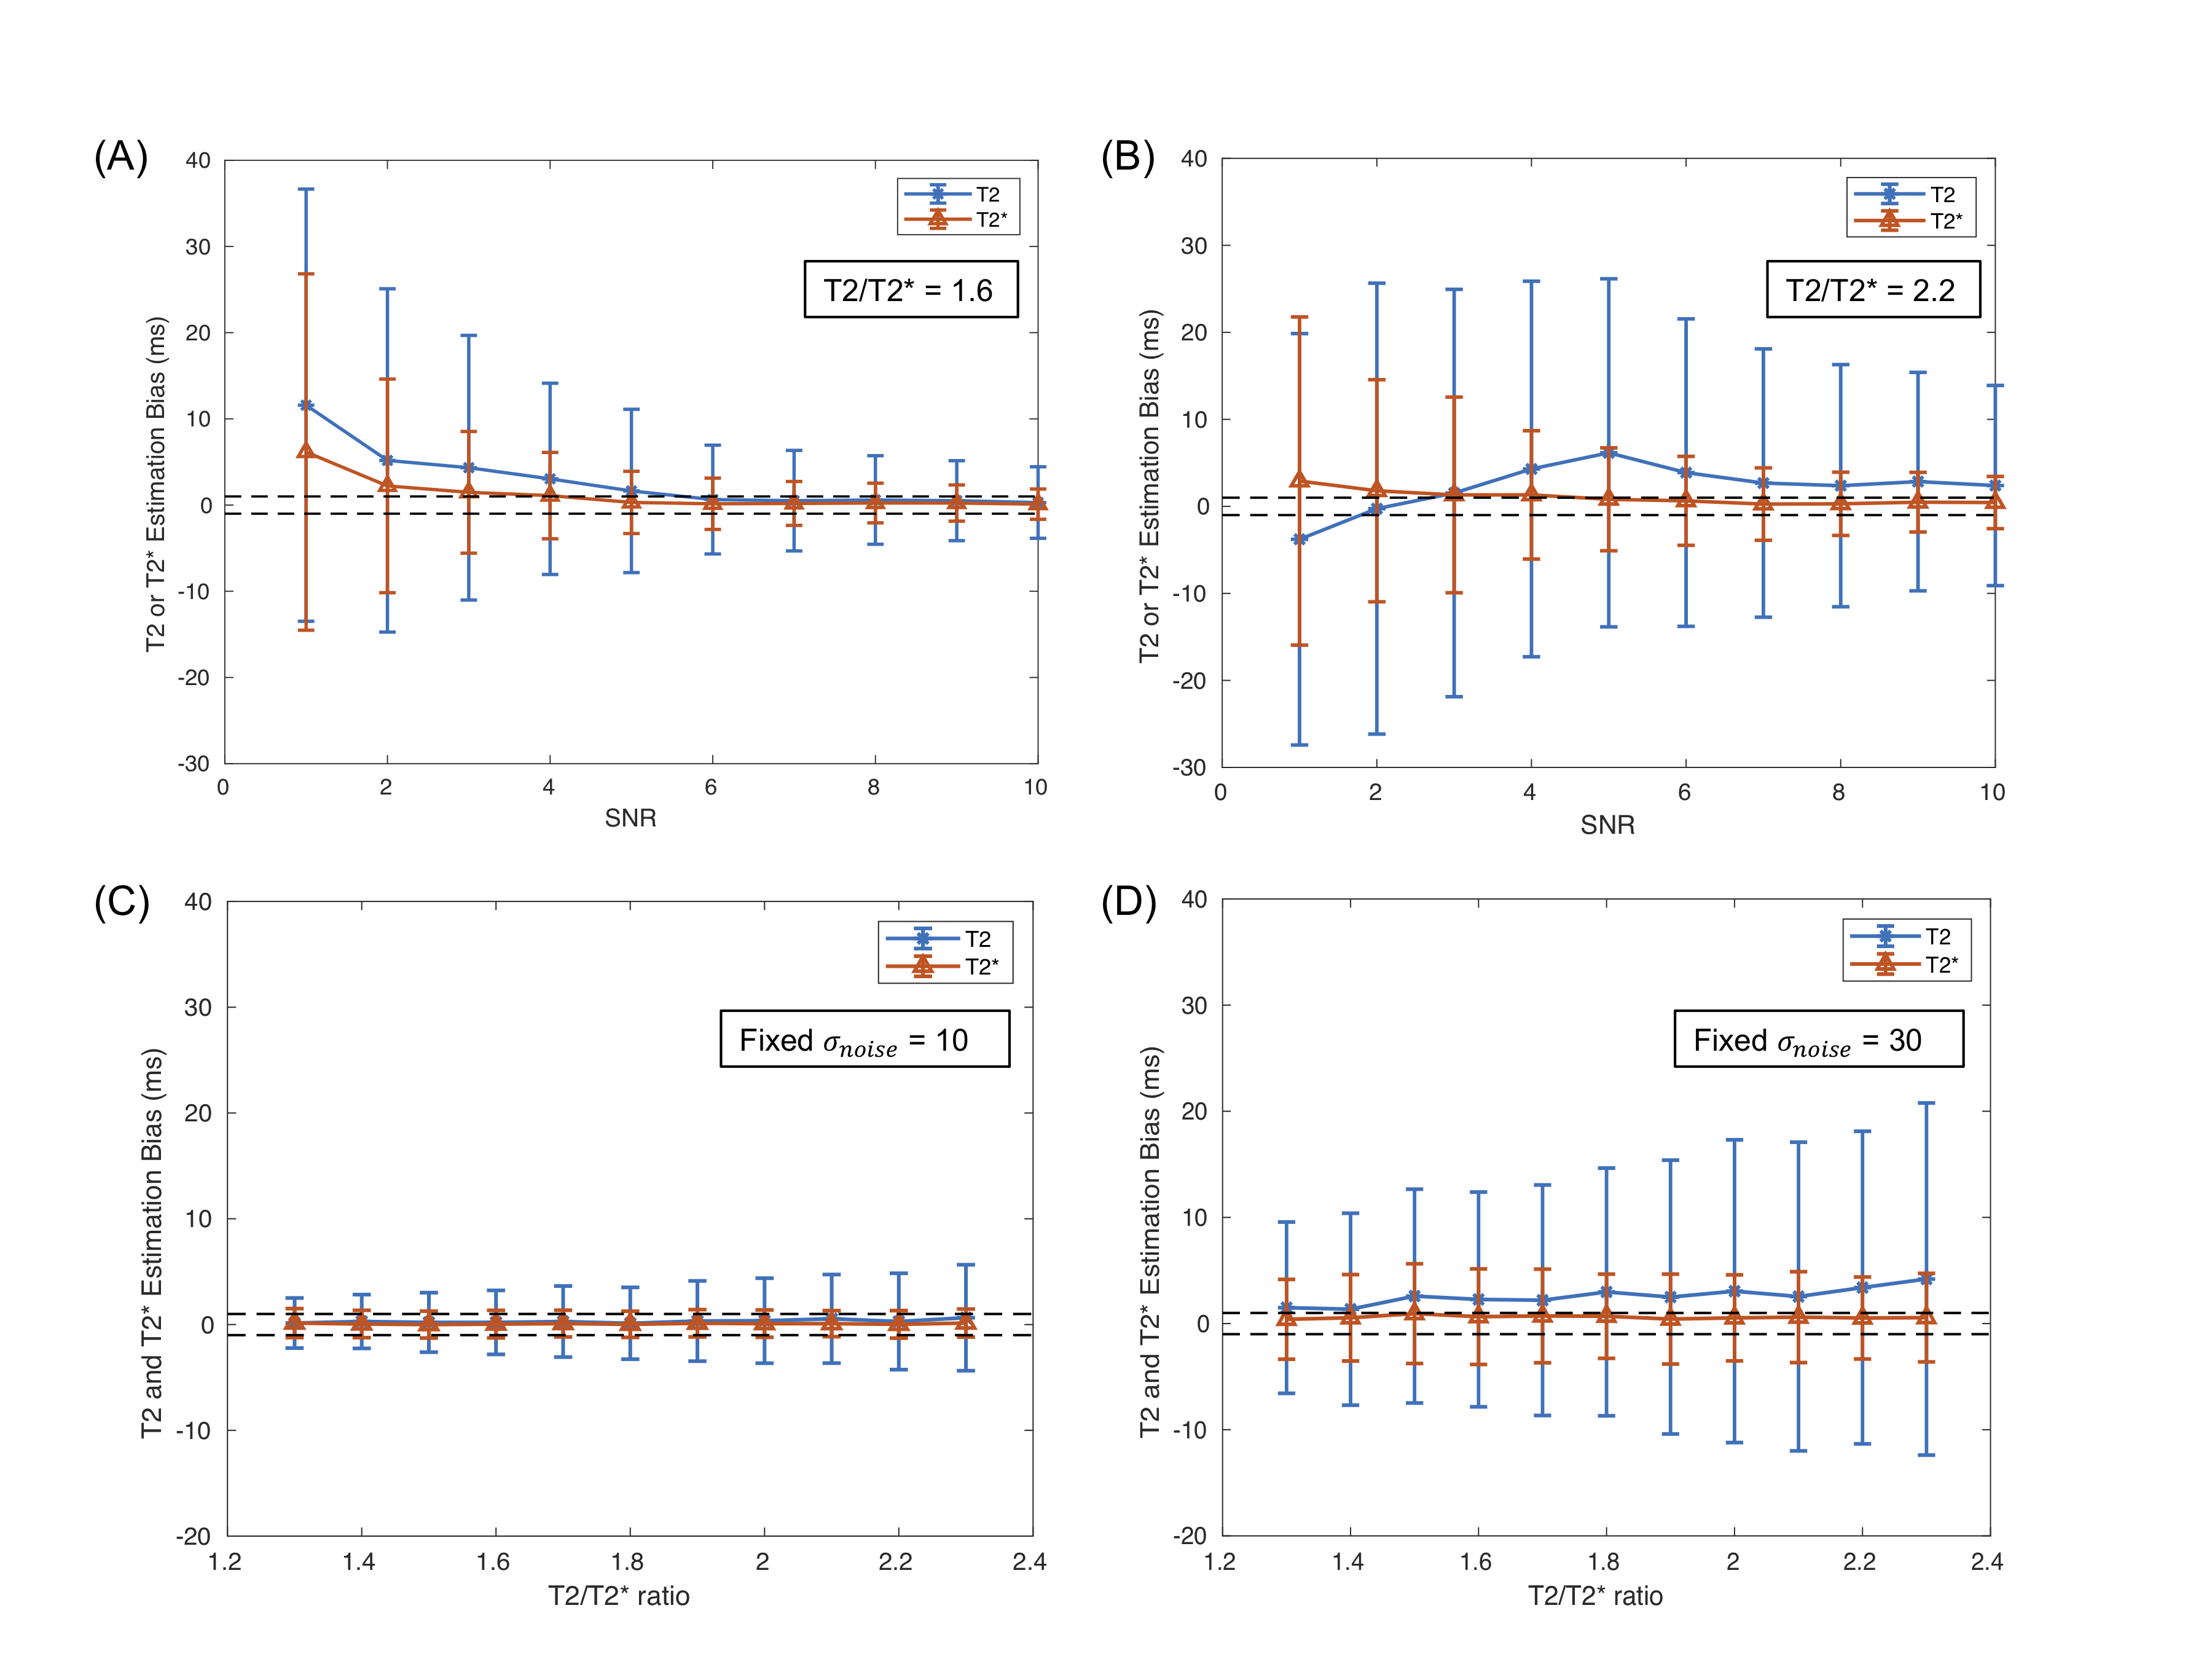
Figure 3. The bias and precision of T2 and T2* estimations using Monte Carlo simulations. For T2/T2* = 1.6 (A), the bias for T2 and T2* is smaller than 1 ms when the SNR of the last (5th) echo is larger than 6. For T2/T2* = 2.2 (B), the bias for T2* is smaller than 1 ms since SNR is larger than 3, but SNR needs to be much higher than 10 to make the bias of T2 smaller than 1 ms. When the fixed noise level is low in (C), the bias and standard deviation of T2 and T2* are quite small, while it causes an increasing impact with the T2/T2* ratio for high noise.