0764
Simultaneous T2/T2* quantification for oxygen extraction fraction estimation using GE-SE EPIK: A preliminary study in brain tumor patients1Institute of Neuroscience and Medicine - 4, Forschungszentrum Juelich GmbH, Jülich, Germany, 2RWTH Aachen University, Aachen, Germany, 3Department of Nuclear Medicine, RWTH Aachen University Hospital, Aachen, Germany, 4JARA-BRAIN - Translational Medicine, Aachen, Germany, 5Institute of Neuroscience and Medicine - 11, Forschungszentrum Juelich GmbH, Jülich, Germany, 6Department of Neurology, RWTH Aachen University Hospital, Aachen, Germany
Synopsis
Keywords: Multi-Contrast, Oxygenation, Oxygen Extraction Fraction
The versatile information provided by simultaneous multi-contrast GE/SE acquisitions keeps interest in this area high. This work extends the previously published 10-echo GE-SE EPIK to investigate brain tumor patients. Within this scope, a single-slice 12-second acquisition provides quantification of T2 and T2* with application to oxygen extraction fraction (OEF) information. Data from four tumor patients were acquired, revealing increased T2/T2* values and increased OEF in regions with variable amino acid uptake in O-(2-[18F]fluoroethyl)-L-tyrosine (FET) PET.Introduction
Combined gradient-echo (GE) and spin-echo (SE) acquisitions provide access to a wide range of parameters, e.g. relaxation times, blood and oxygenation information, which are valuable in the investigation of tumor heterogeneity1. The oxygen extraction fraction (OEF) is known to be an important biomarker for disturbed brain metabolism in various diseases2. While the current gold-standard is 15O-PET, the short half-life (2 minutes) makes the application logistically challenging, ultimately limiting its usability. The increasing interest in MR solutions for OEF quantification has motivated the development of the proposed GE-SE EPIK sequence. It offers a fast, contrast agent-free method for simultaneous T2, T2* and OEF quantification. Our previous work3 has demonstrated the advantages of GE-SE EPIK over EPI-based approaches: increased spatial resolution, improved temporal resolution, and a larger number of acquired echoes – including two pure SEs. The accuracy of T2/T2* in healthy subjects compared to reference methods was shown along with the sensitivity of OEF measurements in breath-hold experiments. This work extends the GE-SE EPIK method to brain tumor patients and investigates changes in T2/T2*/OEF and also incorporates an intrinsic voxel-wise computation of the venous cerebral blood volume (vCBV).Methods
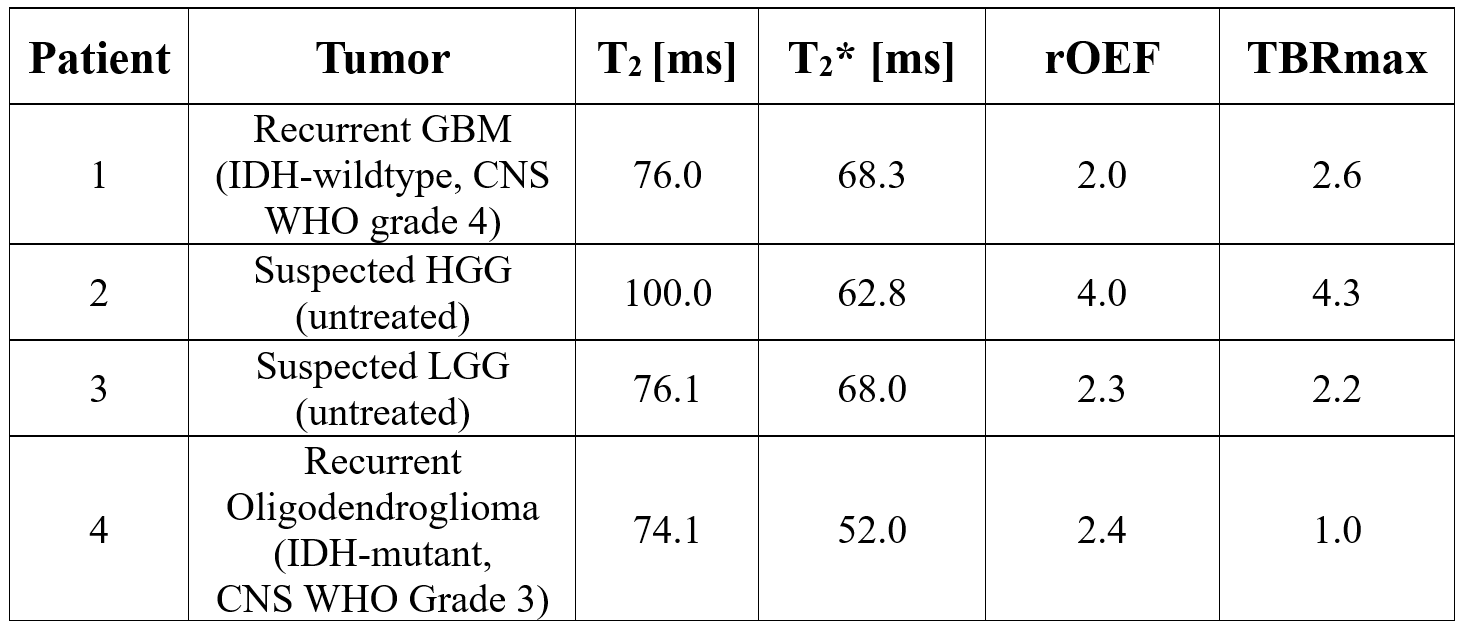
The 10-echo GE-SE EPIK sequence was used to acquire data from four tumor patients at a 3T hybrid MR-PET TRIO scanner simultaneous to amino acid PET using the tracer O-(2-[18F]fluoroethyl)-L-tyrosine (FET)4,5. A single-slice acquisition was performed with TR=1s, TE=10, 20, 41, 51, 66, 76, 86, 107, 117 and 132ms. Figure 1 shows the sequence diagram, including a depiction of an exemplary signal envelope and a schematic of the vCBV calculation. Further details about the patient characteristics are presented in Table 1.T2/T2* values were extracted from the acquired signal by voxel-wise nonlinear least-squares fitting to the following signal equation:
$$S(t)=\begin{cases}S_{0}\,{\cdot}\,e^{-tR_{2}^{*}}&0<t<\frac{TE_{SE1}}{2}\\\frac{S_{0}}{\delta}\,{\cdot}\,e^{-TE_{SE1}(R_{2}^{*}-R_{2})}\,{\cdot}\,e^{-t(2R_{2}-R_{2}^{*})}&\frac{TE_{SE1}}{2}<t\,{\le}\,TE_{SE1}\\\frac{S_{0}}{\delta}\,{\cdot}\,e^{+TE_{SE1}(R_{2}^{*}-R_{2})}\,{\cdot}\,e^{-tR_{2}^{*}}&TE_{SE1}<t<\frac{1}{2}\,{\cdot}\,(TE_{SE1}+TE_{SE2})\\\frac{S_{0}}{\Delta}\,{\cdot}\,e^{-TE_{SE2}(R_{2}^{*}-R_{2})}\,{\cdot}\,e^{-t(2R_{2}-R_{2}^{*})}&\frac{1}{2}\,{\cdot}\,(TE_{SE1}+TE_{SE2})<t\,{\le}\,TE_{SE2}\end{cases}$$
Additional fitting parameters are the net signal S0 and slice profile correction factors δ, Δ6. Next, vCBV was calculated by7
$$vCBV=\frac{S_{\mathrm{extr}}(TE_{SE})}{S(TE_{SE})},$$
where Sextr is the extrapolated signal at the spin echo time based on the neighboring GESE echoes, and S(TESE) is the signal directly acquired at the SE. Finally, OEF values for a given oxygen saturation close to 100% were computed by (Hct=0.36, Δ𝜒0=0.246 ppm per unit Hct)8
$$OEF=\frac{R_{2}'}{vCBV\,{\cdot}\,4/3\,{\cdot}\,π\,{\cdot}\,γ\,{\cdot}\,Δ𝜒0\,{\cdot}\,Hct\,{\cdot}\,B_{0}}.$$
The regions of interest in each tumor dataset were identified in FET-PET images and manually segmented using ITK-Snap8. Relative OEF values (rOEF) are computed by normalizing the respective mean values from the tumor region by the mean values from normal WM.
Results
Three of four patients showed increased FET uptake in the tumor area and increased rOEF suggestive of recurrent tumor with restricted oxygen supply. The FET PET images, T2, T2* and rOEF maps of these patients are presented in Figure 2. Patient 4 with a pretreated oligodendroglioma, CNS WHO grade 3 and suspected tumor recurrence exhibited indifferent FET uptake but increased rOEF (Figure 3). This observation supports the diagnosis of necrosis, which is likely in this patient treated with radiochemotherapy9. An overview of mean T2/T2* values of the tumor ROI and rOEF for all patients is given in Table 1. Moreover, maximal tumor-to-brain ratios (TBR) obtained from FET PET are provided. Figure 4 shows a comparison of rOEF and the maximal TBR from FET PET. OEF and TBR appear to be coupled in cases 1 to 3, but there is a decoupling in case 4, which is probably due to radionecrosis instead of tumor recurrence.Discussion and conclusion
For all patients, a change in T2/T2* was observed in the tumor areas and increased rOEF was found. Patient 4, however, showed low FET uptake in the tumor area in contrast to the other patients. The observation in patients 1 to 3 is consistent with recurrent or residual tumor showing insufficient oxygen supply with increased rOEF10. The low FET uptake in patient 4 makes recurrent tumor unlikely. It has been shown, however, that increased rOEF is also a typical finding in necrotic tissue11. As the patient was pre-treated by radiochemotherapy, the presence of necrosis is very likely in this case. It is tempting to speculate that the combination of FET PET and rOEF imaging might be helpful to differentiate recurrent tumor and treatment-related changes. Future studies will aim to investigate this issue. The amount of available information within an acquisition time of 12 seconds underlines the potential and versatility of the GE-SE EPIK approach. Future work will focus on validating the observed findings, e.g. by comparison to OEF-QSM or perfusion-based vCBV. In detail, the underlying OEF model only incorporates extravascular signal sources, whereas in pathologies such as tumors, intravascular sources may play a non-negligible component. Further, the accuracy of T2* quantification can be improved by increasing the SNR, by either reducing the TE or averaging. A future goal will be the extension of the study to a larger patient cohort to investigate the potential of combined GE-SE EPIK and FET PET to characterize brain tumor types and differentiate recurrent tumors from treatment-related changes. In conclusion, the application of GE-SE EPIK to brain tumor patients revealed a clear change in T2, T2* and increased OEF in tumor regions showing variable FET uptake. These findings are promising and warrant further investigations of GE-SE EPIK combined with hybrid FET PET measurements.Acknowledgements
The authors thank the MTAs and organizational staff involved in the patient measurements. Further, the authors thank Claire Rick for her contribution.References
[1] K. M. Schmainda et al., “Characterization of a First-Pass Gradient-Echo Spin-Echo Method to Predict Brain Tumor Grade and Angiogenesis,” AJNR Am. J. Neuroradiol., vol. 25, no. 9, pp. 1524–1532, Oct. 2004.
[2] D. Jiang and H. Lu, “Cerebral oxygen extraction fraction MRI: Techniques and applications,” Magn. Reson. Med., p. mrm.29272, May 2022, doi: 10.1002/mrm.29272.
[3] F. Küppers, S. D. Yun, and N. J. Shah, “Development of a novel 10-echo multi-contrast sequence based on EPIK to deliver simultaneous quantification of T2 and T2* with application to oxygen extraction fraction,” Magn. Reson. Med., vol. 88, no. 4, pp. 1608–1623, Oct. 2022, doi: 10.1002/mrm.29305.
[4] D. Pauleit, “O-(2-[18F]fluoroethyl)-L-tyrosine PET combined with MRI improves the diagnostic assessment of cerebral gliomas,” Brain, vol. 128, no. 3, pp. 678–687, Jan. 2005, doi: 10.1093/brain/awh399.
[5] L. Caldeira et al., “The Jülich Experience With Simultaneous 3T MR-BrainPET: Methods and Technology,” IEEE Trans. Radiat. Plasma Med. Sci., vol. 3, no. 3, pp. 352–362, May 2019, doi: 10.1109/TRPMS.2018.2863953.
[6] H. Schmiedeskamp, M. Straka, and R. Bammer, “Compensation of slice profile mismatch in combined spin- and gradient-echo echo-planar imaging pulse sequences,” Magn. Reson. Med., vol. 67, no. 2, pp. 378–388, 2012, doi: 10.1002/mrm.23012.
[7] D. A. Yablonskiy, “Quantitation of intrinsic magnetic susceptibility-related effects in a tissue matrix. Phantom study,” Magn. Reson. Med., vol. 39, no. 3, pp. 417–428, Mar. 1998, doi: 10.1002/mrm.1910390312.
[8] X. He and D. A. Yablonskiy, “Quantitative BOLD: Mapping of human cerebral deoxygenated blood volume and oxygen extraction fraction: Default state,” Magn. Reson. Med., vol. 57, no. 1, pp. 115–126, 2007, doi: 10.1002/mrm.21108.
[9] P. A. Yushkevich et al., “User-guided 3D active contour segmentation of anatomical structures: Significantly improved efficiency and reliability,” NeuroImage, vol. 31, no. 3, pp. 1116–1128, Jul. 2006, doi: 10.1016/j.neuroimage.2006.01.015.
[10] A. Stadlbauer et al., “MR Imaging–derived Oxygen Metabolism and Neovascularization Characterization for Grading and IDH Gene Mutation Detection of Gliomas,” Radiology, vol. 283, no. 3, pp. 799–809, Jun. 2017, doi: 10.1148/radiol.2016161422.
[11] A. Stadlbauer et al., “Intratumoral heterogeneity of oxygen metabolism and neovascularization uncovers 2 survival-relevant subgroups of IDH1 wild-type glioblastoma,” Neuro-Oncol., vol. 20, no. 11, pp. 1536–1546, Oct. 2018, doi: 10.1093/neuonc/noy066.
Figures