0762
Characterization of T2-dependent microstructural spectra using combined relaxation-diffusion MRI1Brigham and Women's Hospital, Boston, MA, United States, 2Harvard Medical School, Boston, MA, United States
Synopsis
Keywords: Signal Representations, Diffusion/other diffusion imaging techniques
We proposed a method for joint modeling and analysis for diffusion MRI data with multiple TEs and examined the performance of using in vivo data acquired from a clinical scanner. The contribution of this work includes the characterization of b-value-dependent T2 relaxation rates, comparing prediction results using subsampled TEs, and characterization of microstructural spectral and long and short TEs using extrapolated signals. The results show that the proposed method can provide novel features to characterize T2-dependent microstructure using rdMRI acquired from clinical scanners.
Introduction
Diffusion magnetic resonance imaging (dMRI) probes water diffusion in complex tissue to characterize the underlying microstructure. Microstructural measures are usually derived based on dMRI data acquired at a single echo time (TE). Several recent methods have been developed for joint analysis of dMRI with multiple TEs, i.e., the so-called combined relaxation-diffusion MRI (rdMRI), for more accurate characterization of tissue microstructure using the joint distribution of T2 relaxation rate and diffusivity(1,2,3) and to estimate multi-compartment models(4,5). Our recent work(7) has also introduced a method to estimate the joint moments of relaxation rate and diffusivity using rdMRI with multiple b-values and TEs. In this abstract, we introduce an extension of the method in (7) to characterize TE (or T2)-dependent microstructure with fewer b-values and TEs. We consider the following signal representation for rdMRI signals:$$ s(b,{\bf u}, TE) = s(b,{\bf u})e^{-r_2(b, {\bf u}) TE} $$
where $$$r_2(b, {\bf u})$$$ represents the b-value and direction-dependent T2 relaxation rate. The relaxation-independent signal $$$s(b,{\bf u})$$$ and $$$r_2(b, {\bf u})$$$ are jointly estimated using rdMRI measurements. Different from the method in (7), the above equation does not impose any specific representation of diffusion signals so that the representation is feasible even with one non-zero b-value. The contribution of this work includes 1) characterization of b-value-dependent relaxation rates as new features of tissue microstructure, 2) examination of estimation results with subsampled TEs, and 3) comparison of microstructure measures using extrapolated dMRI at long and short TEs. It was shown in (8) that intra-axonal water has longer T2 than extra-axonal water. Thus, we expect that the above representation can extrapolate signals to longer TEs to enhance signals from intra-axonal space.
Experiment
Two rdMRI datasets were acquired using a 3T Siemens Prisma scanner. The first dataset has been used in (7), which includes dMRI with 5 TEs as TE = 71, 101, 131, 161, and 191 ms. For each TE, the dMRI measurements were acquired along 30 directions at b=700, 1400, 2100, 2800, and 3500 s/mm2 together with 6 volumes with b=0. The second dataset includes 3 TEs at TE = 91, 106, 121 ms. For TE=91 and 121ms, dMRI measurements were acquired along 30 directions at b = 1000, 3000, 4000, 5000, and 6000 s/mm2 , together with 6 volumes at b=0. For TE=106 ms, dMRI measurements were only acquired at b=0 and 6000 s/mm2. Both datasets have 2.5 mm isotropic voxels. The diffusion time and pulse width were fixed with varying TEs.Analysis
For the first dataset, the proposed model was used to fit the measurements using a nonlinear least squares fitting algorithm. The b-value-dependent relaxation rates were estimated with a constraint that the signals are monotonically decreasing with increasing b-values. Moreover, we subsampled the TEs and compared the estimation results with results obtained using all 5 TEs. The subsampled datasets include 2 TEs with TE = 71, 131 ms, 3 TEs with TE = 71, 101, 131 ms, and 4 TEs with TE = 71, 101, 131, 161 ms. We used results with all 5 TEs as a reference and computed the normalized root mean square error (NRMSE) of the estimated signals, the fractional anisotropy (FA), and mean kurtosis (MK).For the second dataset, we applied the estimated models to extrapolate signals to TE = 0, 151, 181 ms. Then, we applied the model proposed in (9) to fit the direction-averaged signal by assuming that the underlying tissue consists of diffusion tensors with different orientations but the same eigenvalues. The perpendicular diffusivity of the diffusion tensor was estimated using the least squares fitting algorithm and converted to the apparent axon radius using the approach in (6).
Results
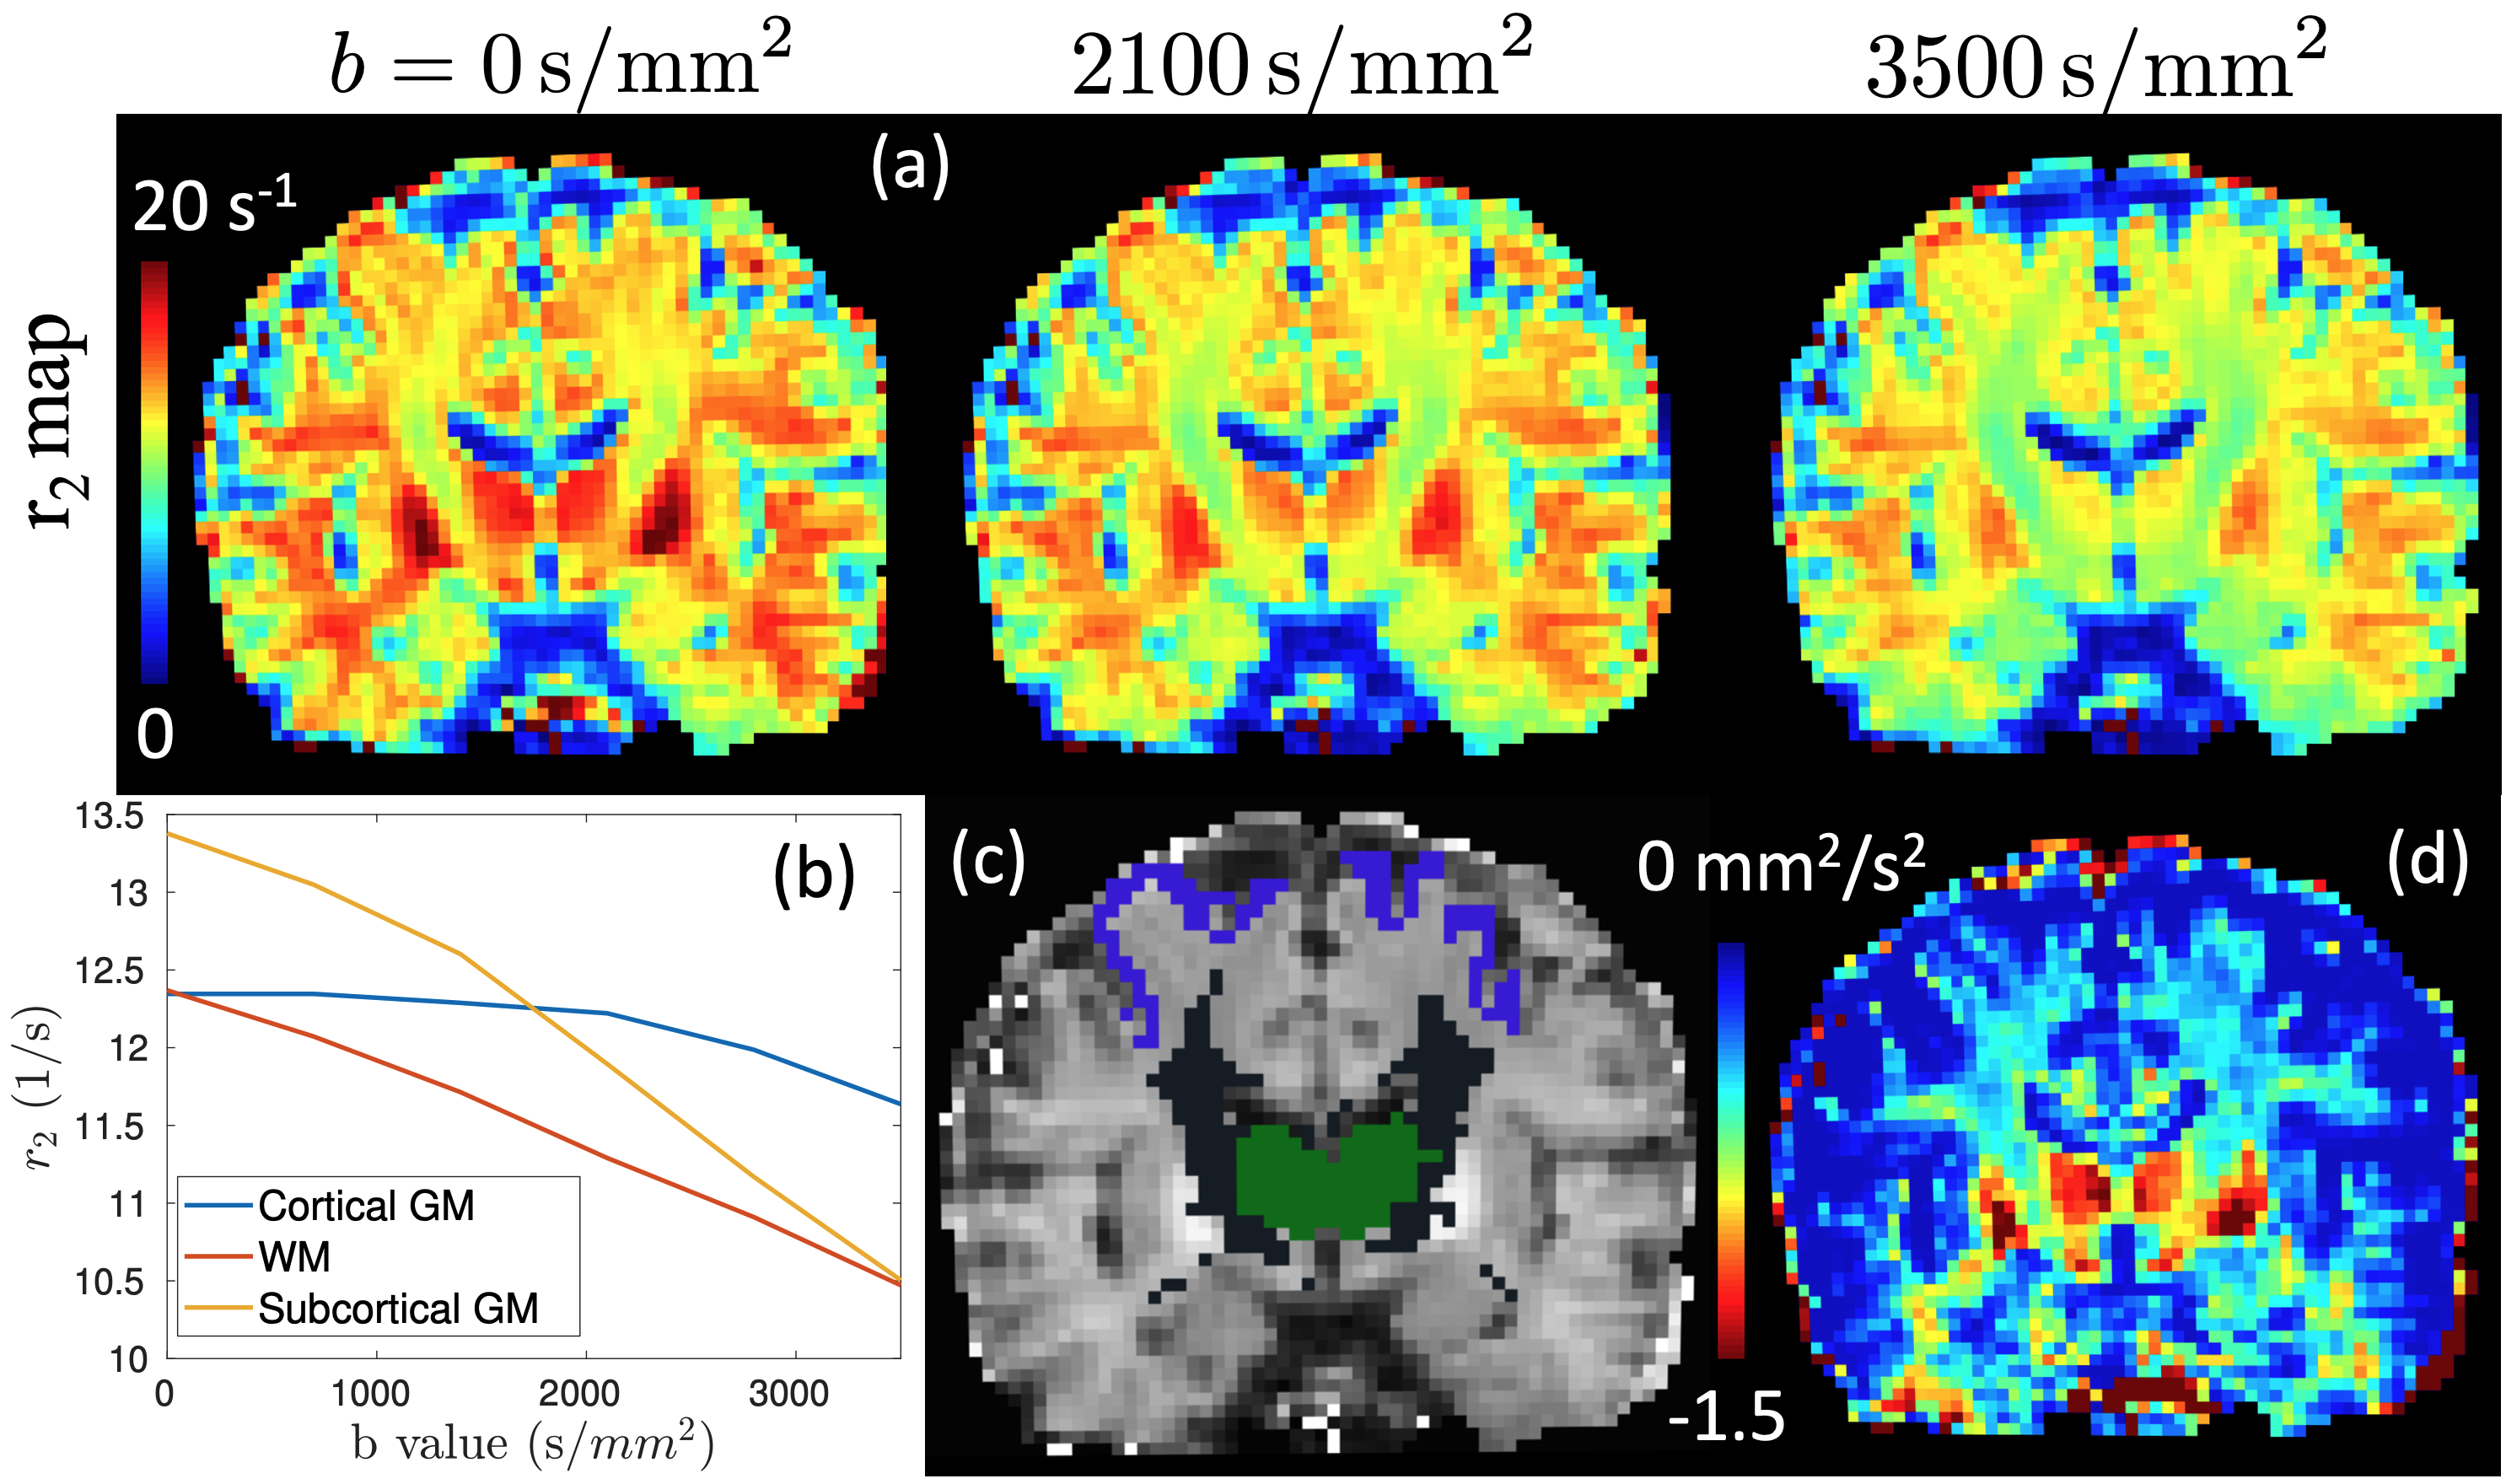
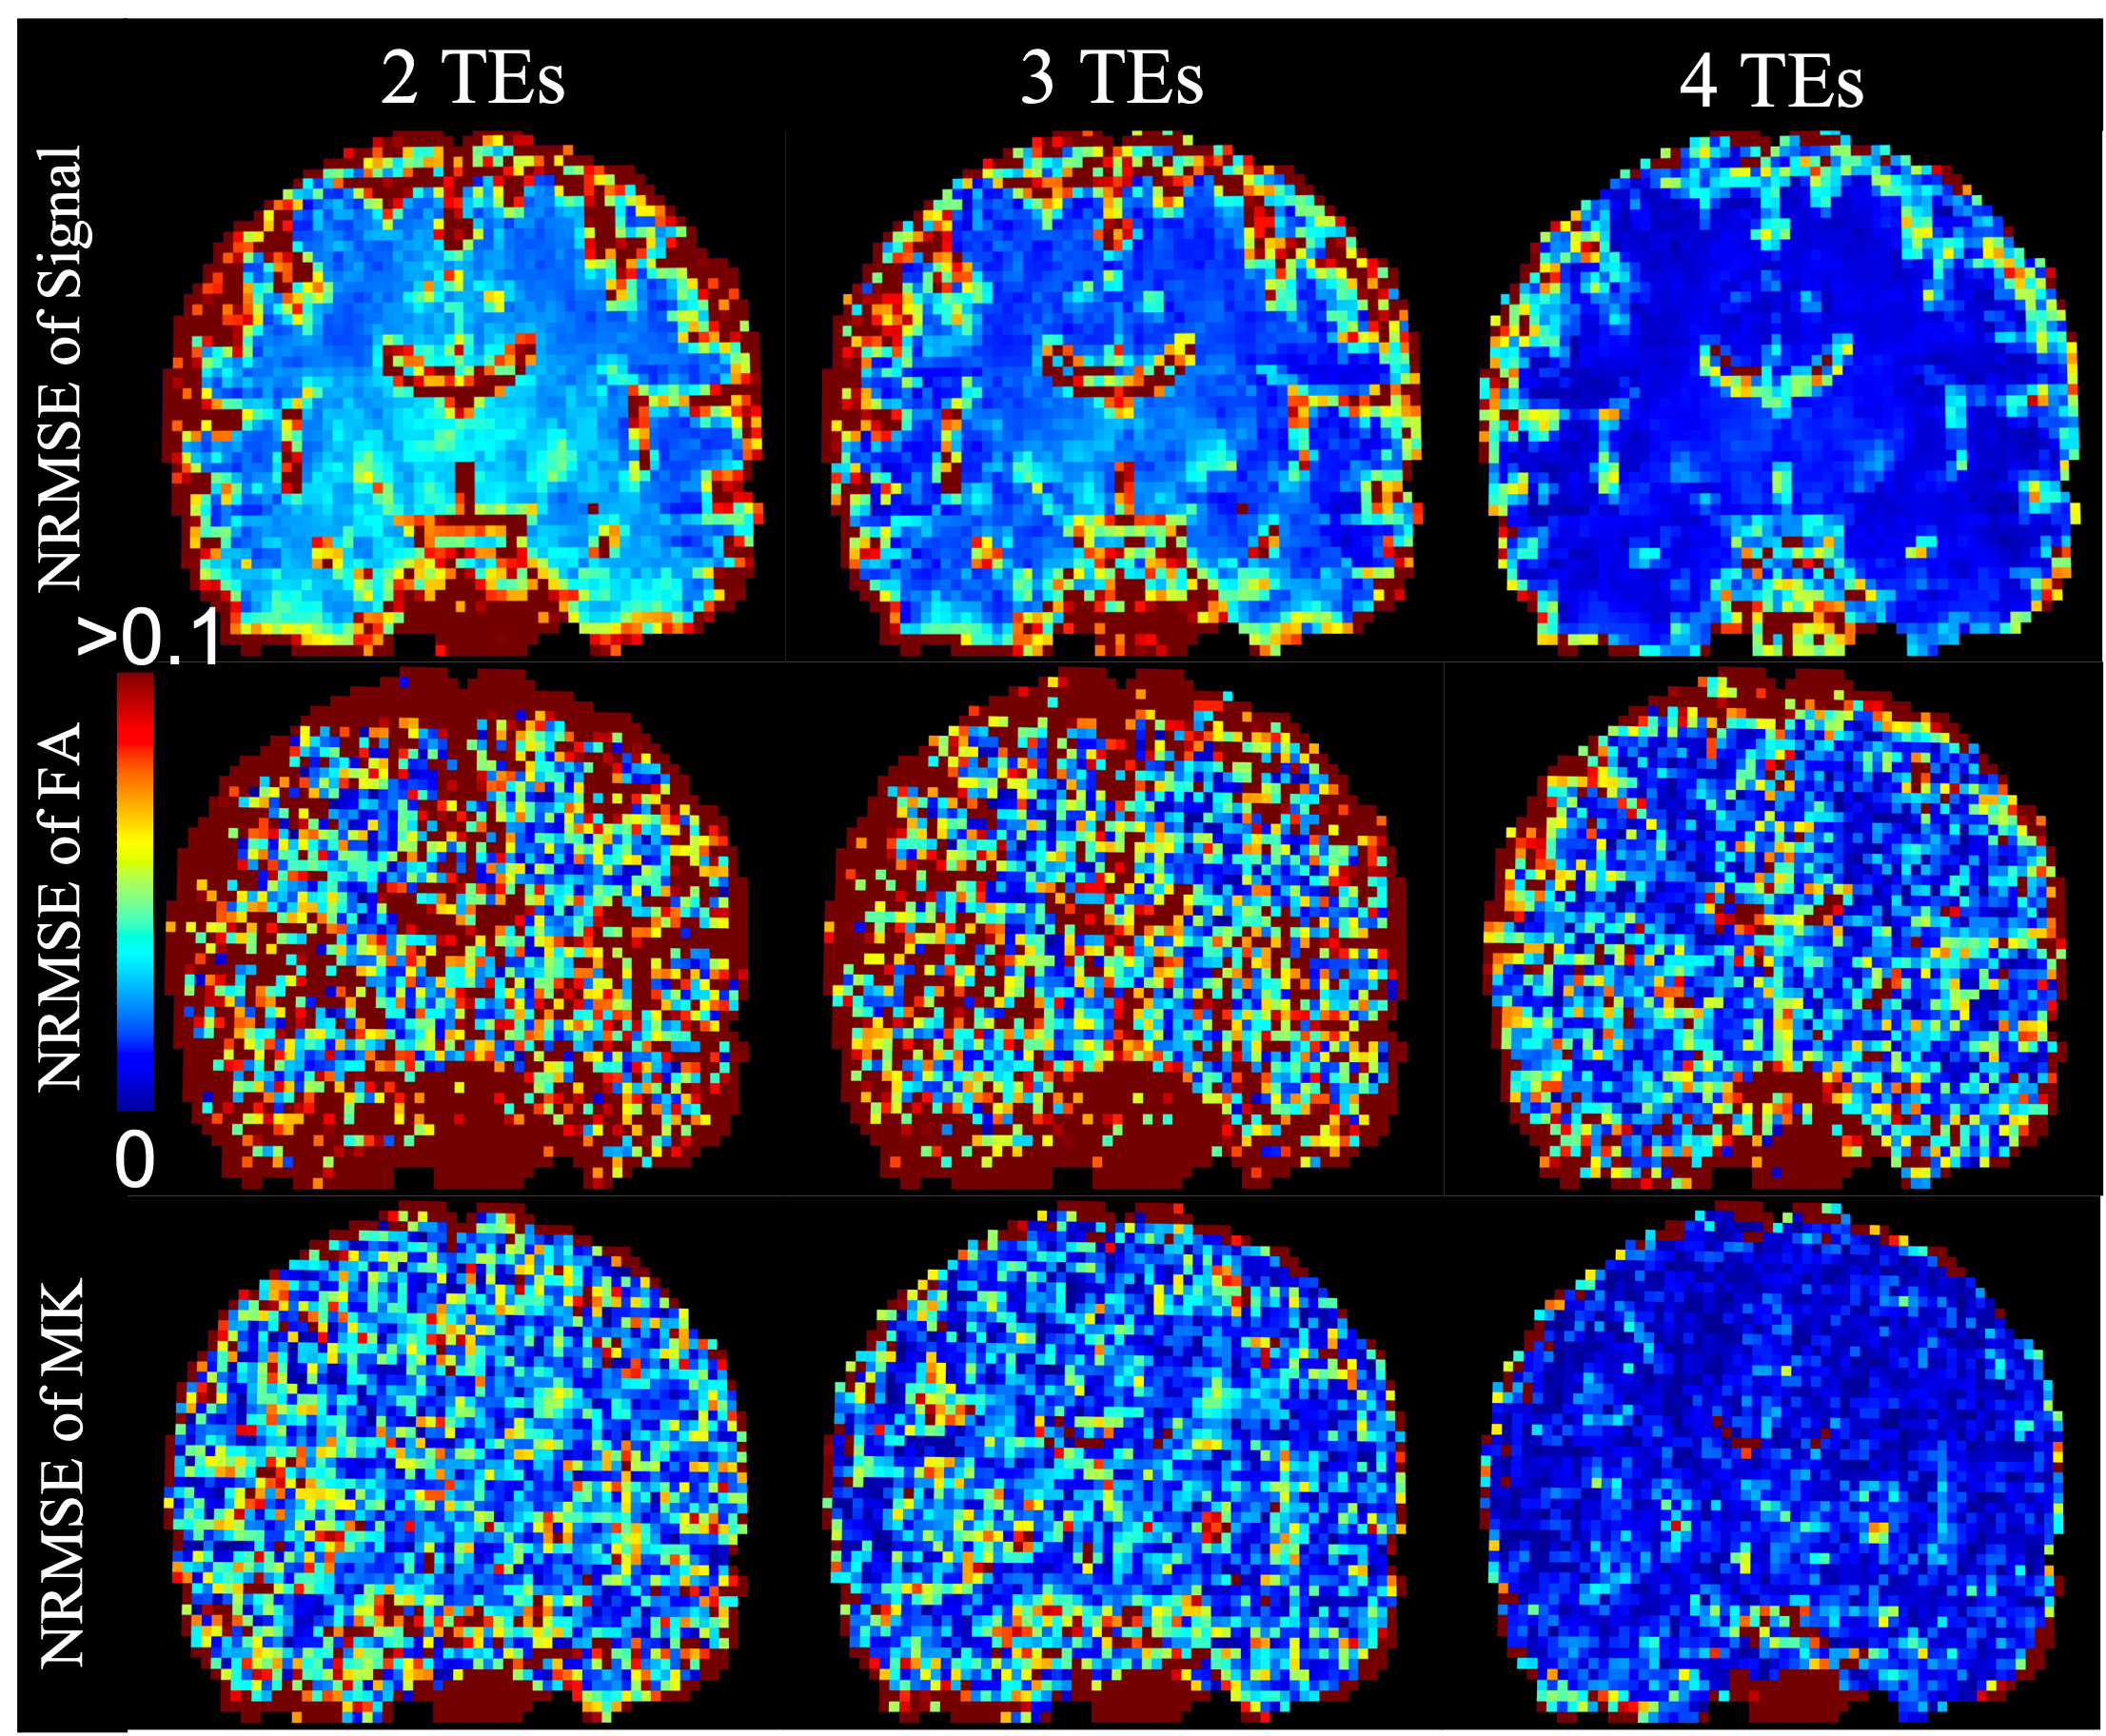
The first row of Fig. 1 illustrates the r2 maps of the first dataset at three b-values averaged over all directions. Fig. 1b) shows the mean r2 values in three brain regions illustrated in Fig. 1c) at different b values. Fig. 1d) shows the average slope of the $$$r_2(b)$$$ function which is equal to the correlation between relaxation and diffusivity introduced in (7).Fig. 2. shows the NRMSE maps of the estimated rdMRI signals, FA and MK measures using 2, 3, 4 TEs compared to results using all 5 TEs. With 3 or more TEs the NRMSE values are generally lower than 5% in most brain tissue. The NRMSE of FA is much higher in the gray matter with 3 or fewer TEs.
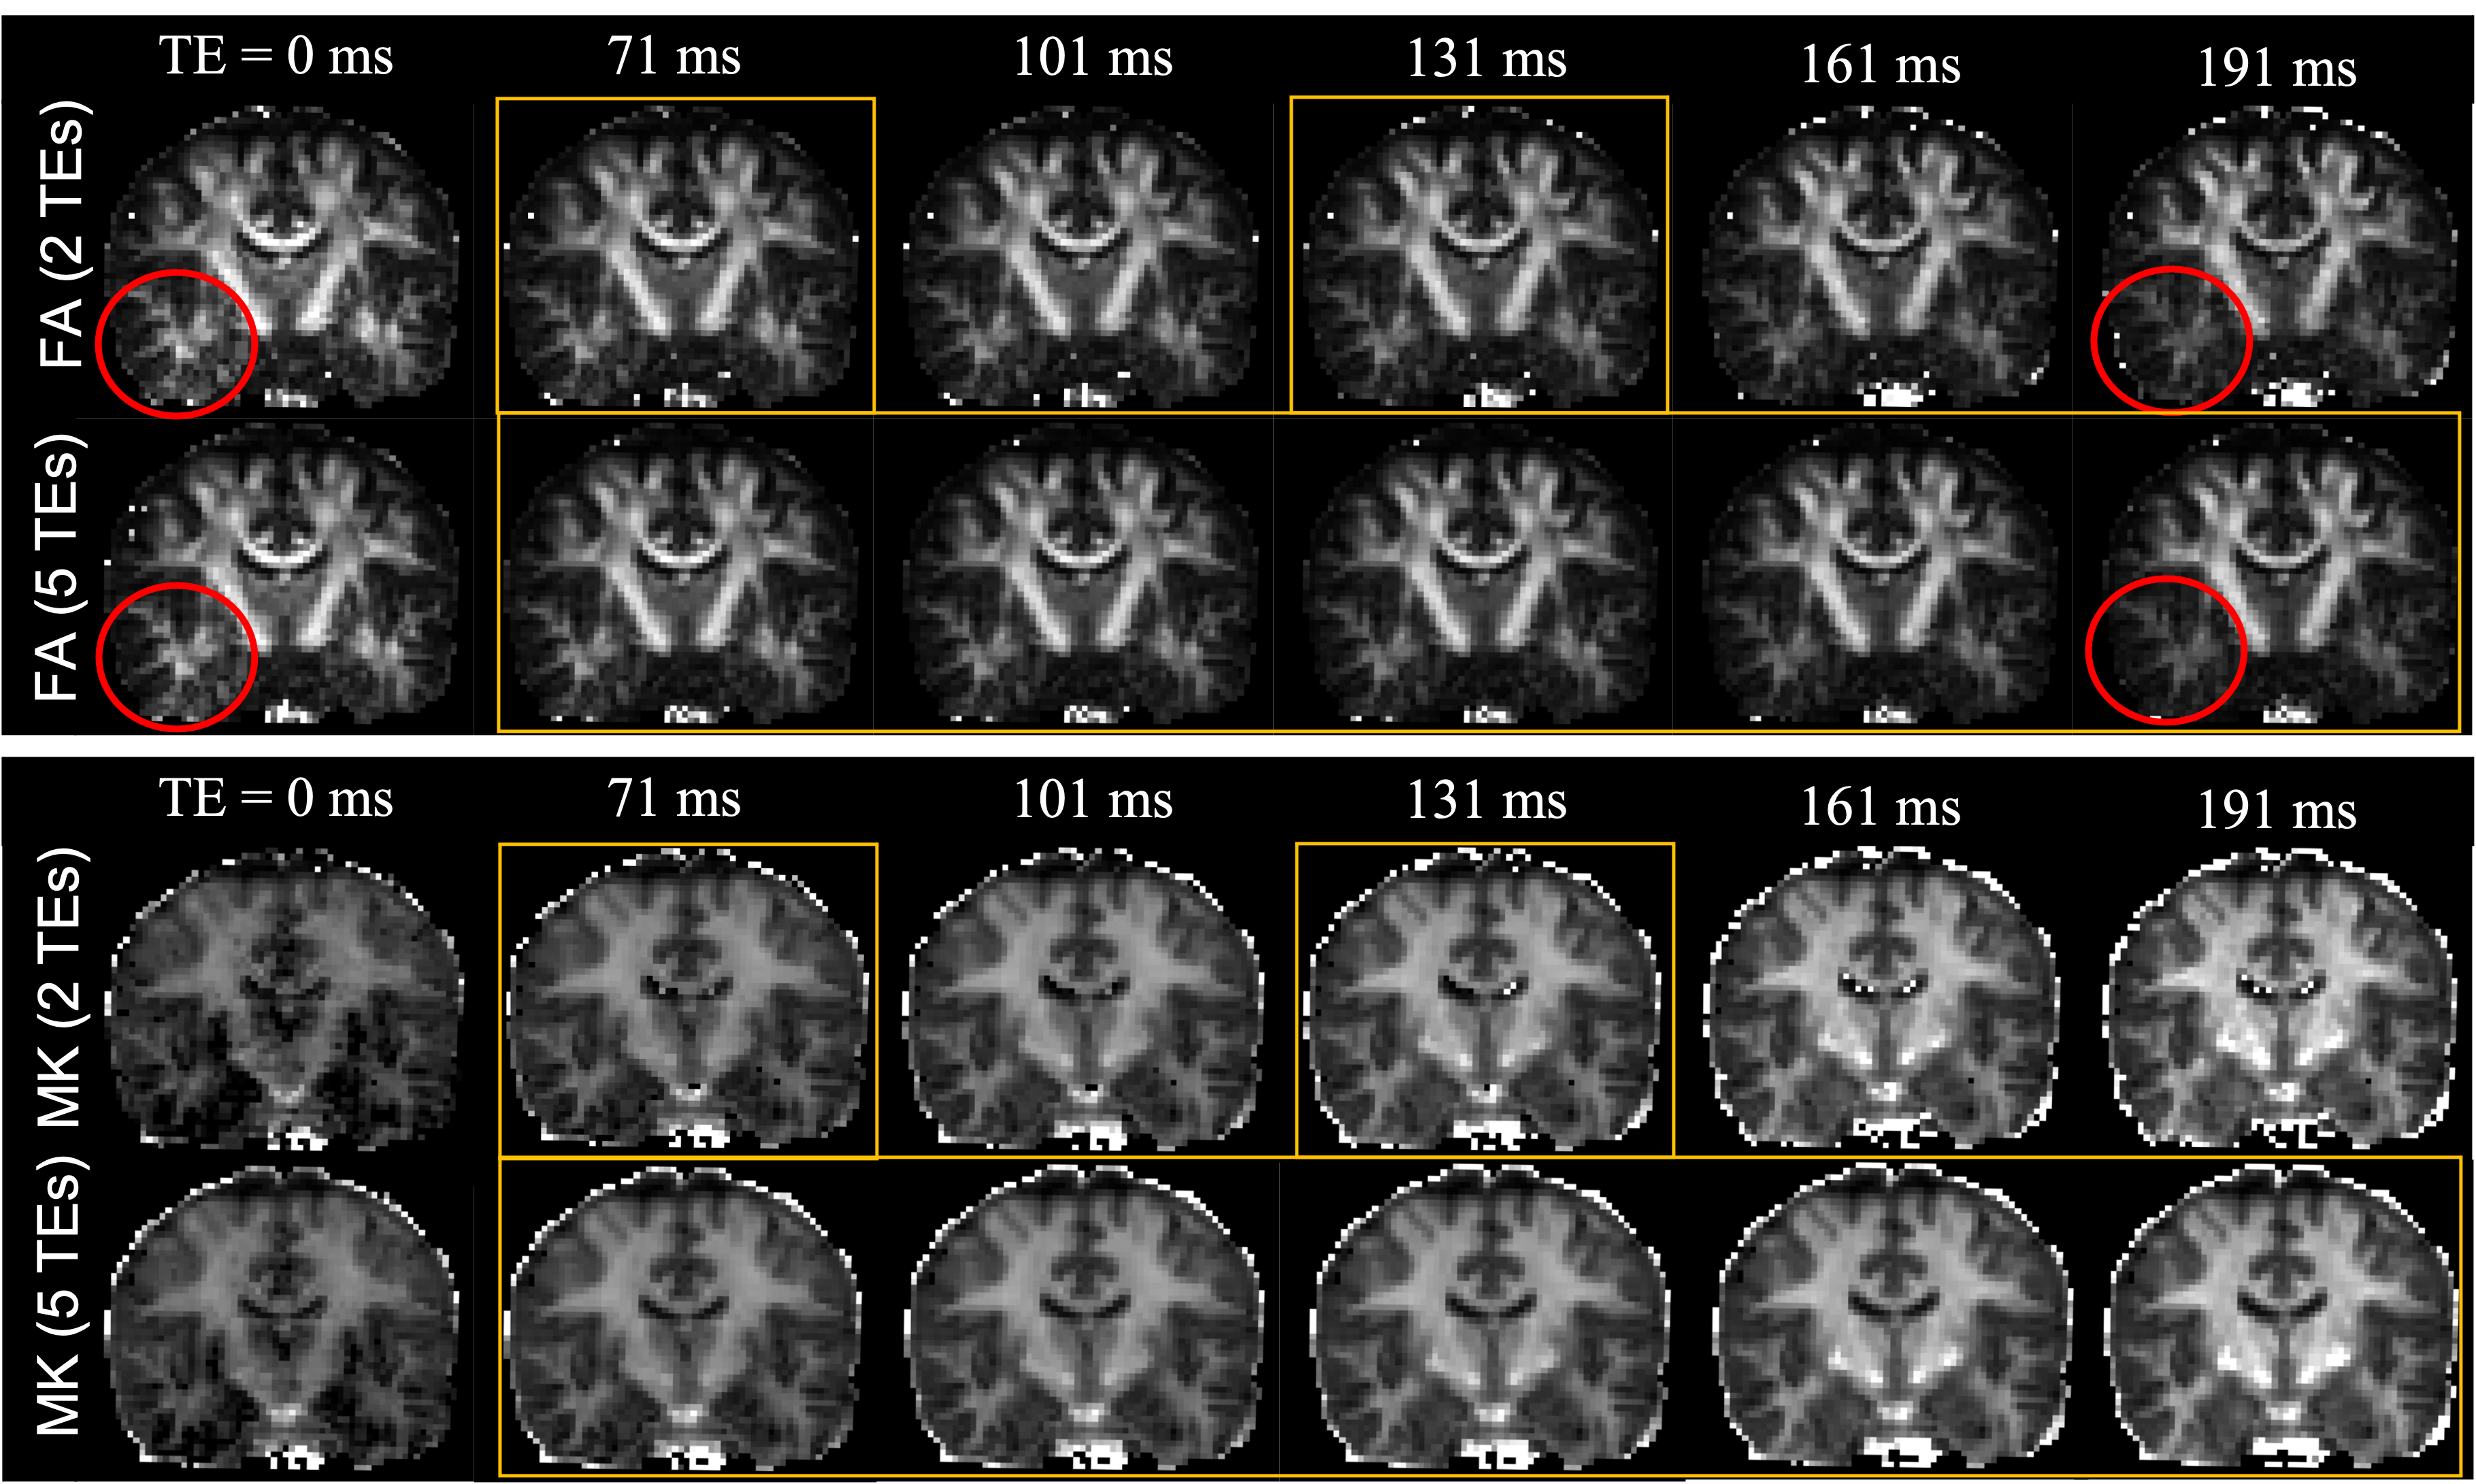
Fig. 3 illustrates the FA and MK maps estimated using 2TEs and 5TEs. The red circle shows that the FA maps of the temporal lobe have a much stronger dependence of TE values than other brain regions. The last two rows show that the MK is much higher at long TEs, indicating potentially much stronger signal content from intra-axonal components.
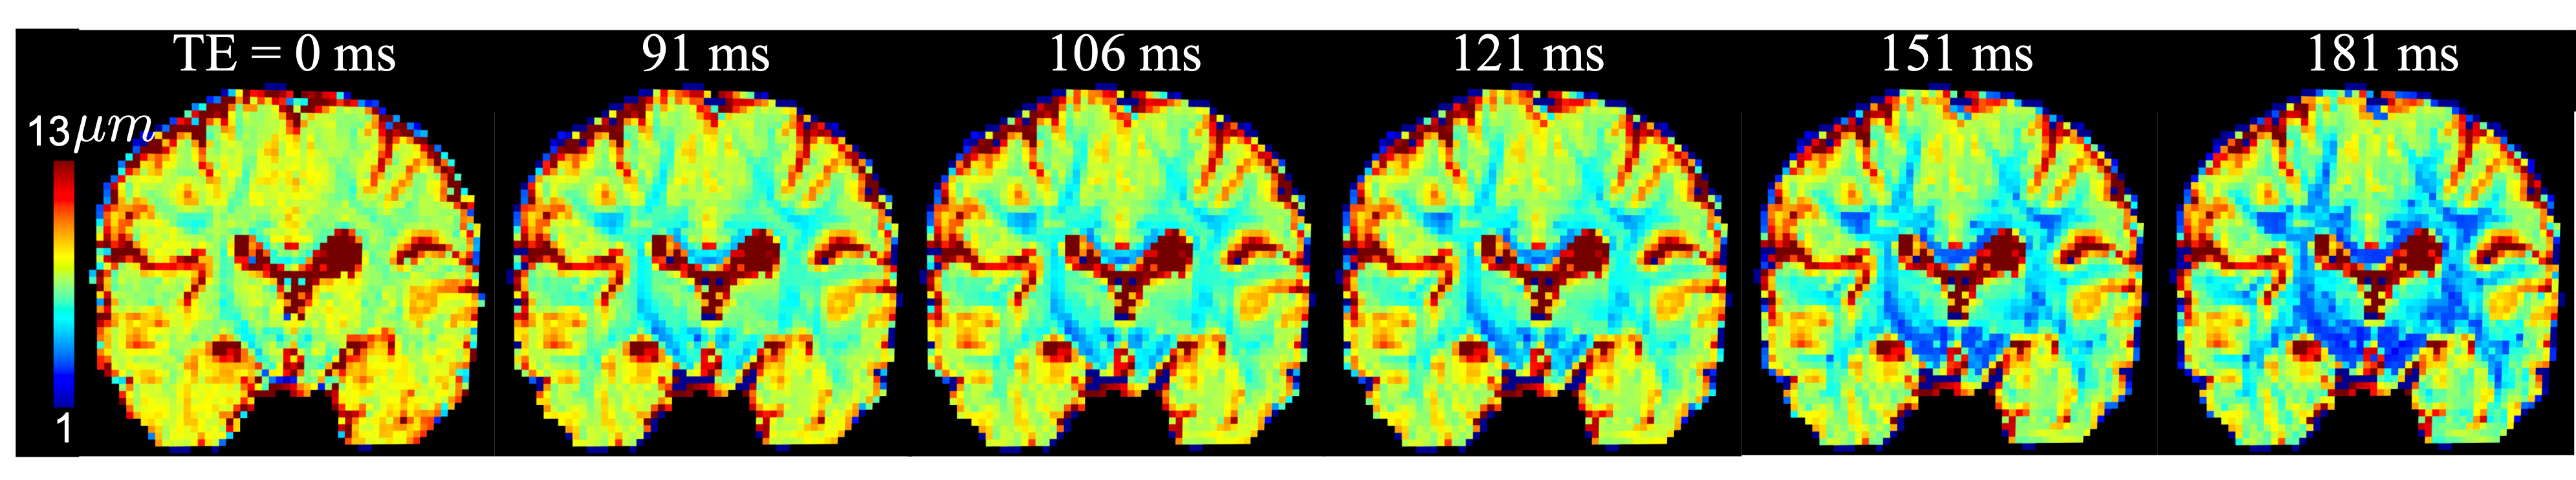
Fig. 4 Illustrates the estimated axon radii using dataset 2. Longer TE leads to smaller apparent axon radii that are close to histology results.
Discussion
We showed that b-value-dependent r2 values provides useful features to characterize tissue microstructure. With the proposed signal representation, rdMRI signals can be extrapolated to very long or short TEs that cannot be directly measured to enhance the sensitivity of imaging measures to specific tissue components.Acknowledgements
References
1. Benjamini D and Basser PJ, "Use of marginal distributions constrained optimization (MADCO) for accelerated 2D MRI relaxometry and diffusometry," Journal of Magnetic Resonance, 271: 40–45, 2016.
2. Slator PJ, Palombo M, Miller KL, Westin CF, Laun F, Kim D, Haldar JP, Benjamini D, Lemberskiy G, de Almeida Martins JP, Hutter J. Combined diffusion-relaxometry microstructure imaging: Current status and future prospects. Magn Reson Med. 86(6): 2987-3011, 2021.
3. Kim D, Doyle EK, Wisnowski JL, Kim JH, and Haldar JP, “Diffusion-relaxation correlation spectroscopic imaging: A multidimensional approach for probing microstructure,” Magnetic Resonance in Medicine, 78(6): 2236–2249, 2017.
4. Gong T, Tong Q, He H, Sun Y, Zhong J, Zhang H. MTE-NODDI: Multi-TE NODDI for disentangling non-T2-weighted signal fractions from compartment-specific T2 relaxation times. Neuroimage. 217:116906, 2020.
5. Veraart J, Novikov DS, and Fieremans E, “TE dependent diffusion imaging (TEdDI) distinguishes between compartmental T2 relaxation times,” NeuroImage, 182:360–369, 2018.
6. Veraart, J., Nunes, D., Rudrapatna, U., Fieremans, E., Jones, D. K., Novikov, D. S.,and Shemesh, N. "Noninvasive quantification of axon radii using diffusion MRI". eLife 9:1–27, 2020.
7. Ning L, Gagoski B, Szczepankiewicz F, Westin C-F, Rathi Y, "Joint RElaxation-Diffusion Imaging Moments (REDIM) to probe neurite microstructure," IEEE Trans Med Imaging, 39(3): 668-677, 2020.
8. McKinnon, E. T., and Jensen, J. H. "Measuring intra-axonal T2 in white matter with direction-averaged diffusion MRI". Magnetic Resonance in Medicine 81(5): 2985–2994, 2019.
9. Kaden, E., Kruggel, F., and Alexander, D. C. Quantitative mapping of the per-axon diffusion coefficients in brain white matter. Magnetic Resonance in Medicine 75(4): 1752–1763, 2016.
Figures