0760
Axonal Diameter Mapping using High Performance Gradients: Feasibility study and Repeatability of Estimates1GE Research, Niskayuna, NY, United States, 2Walter Reed National Military Medical Center, Bethesda, MD, United States, 3Uniformed Services University of the Health Sciences, Bethesda, MD, United States
Synopsis
Keywords: Signal Modeling, Diffusion/other diffusion imaging techniques
High performance gradients allow for the exploration of an expanded diffusion parameter space, that simplifies biophysical model at ultra-high b=7-30 ms/μm2. The choice of b-encoding space can suppress contributions from extra-axonal water signal while utilization of high performance gradient systems allows for maintaining short echo times (TE<63 ms) with adequate SNR. In this study, the feasibility and reproducibility of mapping effective axonal diameter distributions in the in-vivo brain was assessed by making use of a test-retest paradigm. Whole brain white-matter and parcel based reproducibility and sensitivity were evaluated for this promising biomarker.Introduction
Non-invasive quantification of axonal morphology is an exciting avenue for a new class of diffusion MR measurements to be interrogated with more specific information about the underlying brain microstructure1–3, with diffusion-weighted MRI techniques exploring a wider parameter space—available due to advancements in MR gradient capabilities. Existing techniques, tailored for the performance of whole-body clinical MRI scanners, utilized complex biophysical models to compensate for the low b-encoding space and signal contributions dominated by extra-axonal water. With the capabilities of high performance gradient systems4–7, shorter diffusion encoding pulse-widths, shorter TE, reduced distortion and blurring from shorter EPI echo spacing can be achieved with higher PNS thresholds than previously inaccessible8.This capability has enabled in-vivo implementations for time-dependent diffusivity9,10and allows for ultra-high diffusion (≥30 ms/μm2) encoding to simplify modeling of intra-axonal diffusivity1,11,12. This allows for simplified biophysical models to be explored8, where 1) ultra-high diffusion sensitization (>7 ms/μm2) suppresses signal from extra-axonal water11, while 2) powder averaged signal is rotationally invariant mitigating orientation bias13. The signal response can be modeled as a power-law function, allowing for an estimation for effective intra-axonal radii (reff)4.
In this study, a MAGNUS4 head-only gradient system was used to demonstrate the feasibility of mapping reff with ultra-high diffusion encoding. To circumvent the limitation of Rician noise bias, decorrelated phase filtering (DCPF)14 was used along with gradient non-linearity corrections for diffusion encoding15 (critical in high performance systems). Sensitivity for whole brain characterization of the reff was further evaluated by test-retest measures.
Methods
Acquisition: 5-healthy volunteers were scanned twice for test-retest, with one volunteer scanned x3 for determining short (same day) and long (≥7days) term repeatability, under IRB-approved protocols using a 3.0 T MRI (GE Healthcare, Waukesha, WI, USA) fitted with a head-only 200 mT/m and 500 T/m/s MAGNUS gradient (GE Research, Niskayuna, NY, USA). A 32-channel phased array head coil (NOVA Medical, Wilmington, MA, USA) was used for all experiments. A multi-shell diffusion acquisition was used with total of 4x60=240 encoding directions with b=7,18,25, and 30 ms/μm2 (echo-spacing=538 ms, Δ/δ=33/19 ms, TE/TR=63/5500 ms, 2.2-mm isotropic resolution, NEX=1, in-plane R=2, scan-time:20 mins). Diffusion encoding directions were uniformly sampled16,17 on each shell by enforcing antipodal symmetry. A T1-weighted MPRAGE was also acquired for joint spatial normalization and white matter segmentation21.Signal processing: Due to intrinsically low SNR at ultra-high b-values, magnitude reconstruction of dMRI images results in a rectification of the noise floor resulting in inaccurate estimation for model fitting. We adopt DCPF14 which utilizes filter kernels optimized via spatial noise correlation patterns. The output is real-valued data (RVD) that maintains a Gaussian noise distribution. RVD was further corrected for distortion, eddy currents, bulk motion and non-linearity of diffusion-encoding gradients, implemented via a custom reconstruction pipeline21,22 (Figure 1.). In the absence of extra-axonal signal contributions (b≥7ms/μm2), the spherically averaged diffusion-weighted signal is modeled as,
$$S_0=\beta\exp{\left(-bD_a^ \perp \right)}b^{-\frac{1}{2}} (1)$$
With reff, computed using the Neuman approximation, $$$r_{eff}=\sqrt[4]{\frac{48}{7}δ(∆-\frac{δ}{3})D_{0}D_{a^\bot}}$$$ .
Statistical analysis: Whole brain white matter, gray matter, and CSF segmentations along with registration of the Johns Hopkins University (JHU) ICBM-DTI-81 White-Matter Labeled Atlas18 to subject space, were used for assessment of white matter repeatability. In order to evaluate reproducibility, parcel wise correlation between test-retest was computed. Further, Bland-Altman and correlation coefficients were estimated per subject over WM for voxel-wise and parcel based analysis, with spearman’s rank correlation coefficient computed.
Results & Discussion
Post-processed, spherically averaged signals is shown in Figure 2A. Striking microstructural detail is evident even at b-values of 30 ms/μm2. This is primarily due to high-performance gradient systems where short TE (~63 ms) and echo spacing (<500 ms) can be achieved. Whole brain WM, GM and CSF parcels highlight the signal decay profile with sensitivity of the signal to the underlying microstructural distributions and the expected deviations from power-law scaling in WM (Figure 2B).The distribution of reff in whole brain WM highlights the tail-weighted distribution that can be interrogated (Figure 3A). Violin plots show the density distributions across and within the corpus callosum, highlighting interesting intra-parcel variability. The data is in good agreement with prior literature1,3,19,20
Kernel density plots for whole brain WM (Figure 4A) and WM parcels (Figure 4B) highlight strong correlation and repeatability, with tighter variations in short (CV~3.5%) vs. long-term test-retest (CV~4.0%). Bland-Altman plots using WM parcels show lack of systematic bias and high intra-subject reproducibility for test-retest (Figure 4B and 5). On average, across subjects, the coefficient of variation for WM parcels was 3.2%, approximately demonstrating the same order of magnitude as conventional diffusion metrics. Spearman’s rank correlations coefficient on average showed high repeatability with positive correlation between test-retest, r= [0.95], p = 0.00*.
Conclusion
Test-retest statistics across 5 subjects showed good repeatability on a mean parcel basis, with single unit CV values demonstrating the ability to detect subtle changes in the brain on a per-subject basis. The repeatability establishes the floor of changes in the brain that can be observed in studies leveraging reff for biomarker evaluation or neuroplastic changes in the brain. However localized changes are not captured in this approach and further work is required to understand the limits of sensitivity due to variations in crossing fiber regions, fiber undulations or other confounds to the signal.Acknowledgements
Grant funding from NIH U01EB028976, NIH U01EB024450, CDMRP W81XWH-16-2-0054.
The opinions or assertions contained herein are the views of the authors and are not to be construed as the views of the U.S. Department of Defense, Walter Reed National Military Medical Center, or the Uniformed Services University.
References
1. Veraart, J. et al. Noninvasive quantification of axon radii using diffusion MRI. eLife 9, e49855 (2020).
2. Assaf, Y., Blumenfeld-Katzir, T., Yovel, Y. & Basser, P. J. Axcaliber: A method for measuring axon diameter distribution from diffusion MRI. Magnetic Resonance in Medicine 59, 1347–1354 (2008).
3. Barakovic, M. et al. Bundle-Specific Axon Diameter Index as a New Contrast to Differentiate White Matter Tracts. Front Neurosci 15, 646034 (2021).
4. Foo, T. K. F. et al. Highly efficient head-only magnetic field insert gradient coil for achieving simultaneous high gradient amplitude and slew rate at 3.0T (MAGNUS) for brain microstructure imaging. Magnetic Resonance in Medicine 83, 2356–2369 (2020).
5. Feinberg, D. A. et al. Design and Development of a Next-Generation 7T human brain scanner with high-performance gradient coil and dense RF arrays. Proceedings of the 29th Annual Meeting of the ISMRM, Virtual Meeting (2021) (2021).
6. Huang, S. Y. et al. Connectome 2.0: Developing the next-generation ultra-high gradient strength human MRI scanner for bridging studies of the micro-, meso- and macro-connectome. Neuroimage 243, 118530 (2021).
7. Setsompop, K. et al. Pushing the limits of in vivo diffusion MRI for the Human Connectome Project. NeuroImage 80, 220–233 (2013).
8. Tan, E. T. et al. Peripheral nerve stimulation limits of a high amplitude and slew rate magnetic field gradient coil for neuroimaging. Magnetic Resonance in Medicine 83, 352–366 (2020).
9. Tan, E. T. et al. Oscillating diffusion-encoding with a high gradient-amplitude and high slew-rate head-only gradient for human brain imaging. Magnetic Resonance in Medicine 84, 950–965 (2020).
10. Zhu, A. et al. https://cds.ismrm.org/protected/21MPresentations/abstracts/3639.html.
11. McKinnon, E. T., Jensen, J. H., Glenn, G. R. & Helpern, J. A. Dependence on b-value of the direction-averaged diffusion-weighted imaging signal in brain. Magnetic Resonance Imaging 36, 121–127 (2017).
12. Burcaw, L. M., Fieremans, E. & Novikov, D. S. Mesoscopic structure of neuronal tracts from time-dependent diffusion. Neuroimage 114, 18–37 (2015).
13. Afzali, M., Knutsson, H., Özarslan, E. & Jones, D. K. Computing the Orientational-Average of Diffusion-Weighted MRI Signals: A Comparison of Different Techniques. http://biorxiv.org/lookup/doi/10.1101/2020.11.18.388272 (2020) doi:10.1101/2020.11.18.388272.
14. Sprenger, T., Sperl, J. I., Fernandez, B., Haase, A. & Menzel, M. I. Real valued diffusion-weighted imaging using decorrelated phase filtering. Magnetic Resonance in Medicine 77, 559–570 (2017).
15. Tan, E. T., Marinelli, L., Slavens, Z. W., King, K. F. & Hardy, C. J. Improved correction for gradient nonlinearity effects in diffusion-weighted imaging. Journal of Magnetic Resonance Imaging 38, 448–453 (2013).
16. Dk, J., Ma, H. & A, S. Optimal strategies for measuring diffusion in anisotropic systems by magnetic resonance imaging. Magnetic resonance in medicine vol. 42 https://pubmed.ncbi.nlm.nih.gov/10467296/ (1999).
17. Jones, D. K. The effect of gradient sampling schemes on measures derived from diffusion tensor MRI: a Monte Carlo study. Magn Reson Med 51, 807–815 (2004).
18. Oishi, K. et al. Human brain white matter atlas: Identification and assignment of common anatomical structures in superficial white matter. NeuroImage 43, 447–457 (2008).
19. Veraart, J., Raven, E. P., Edwards, L. J., Weiskopf, N. & Jones, D. K. The variability of MR axon radii estimates in the human white matter. Human Brain Mapping 42, 2201–2213 (2021).
20. Gooijers, J. et al. Indices of callosal axonal density and radius from diffusion MRI relate to upper and lower limb motor performance. NeuroImage 241, 118433 (2021).
21. Quachtran, B., Joshi, A.A., Bhushan, C., Leahy, R.M. and Shattuck, D.W., Combined T1-Diffusion MRI Registration, OHBM, pp2506, 2018
Figures
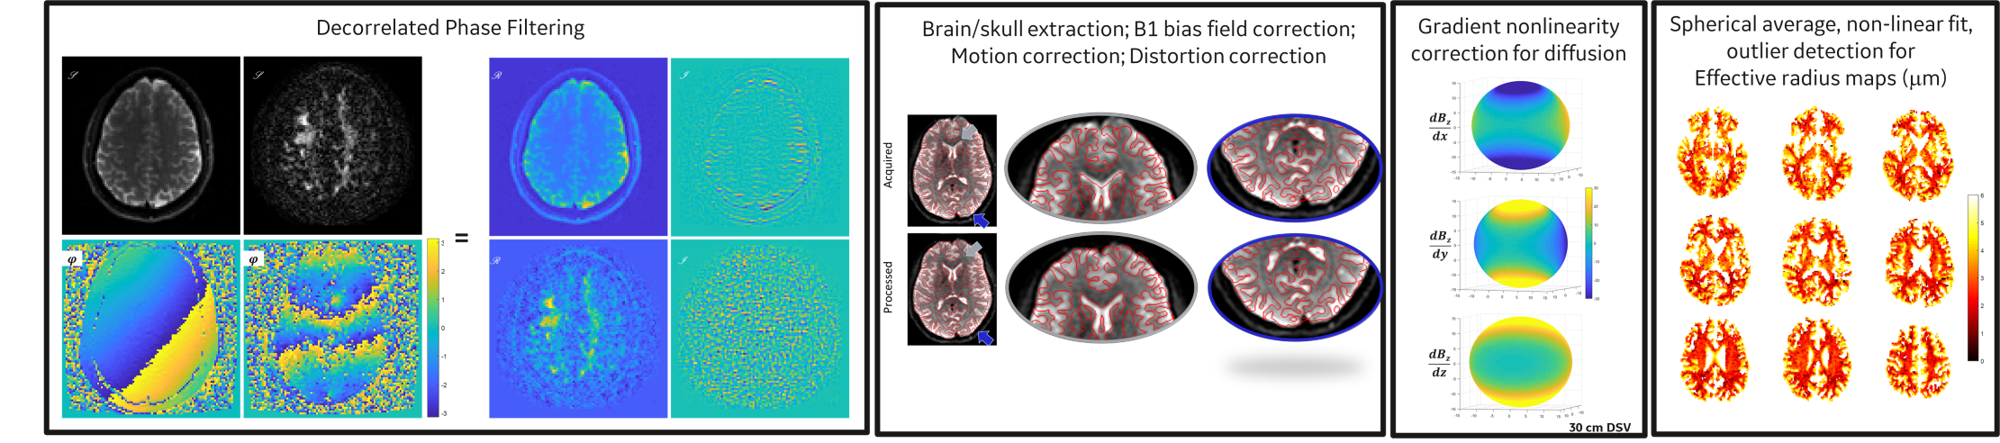
Figure 1. Overview of dMRI processing pipeline used in this study. The first step of the pipeline consists of decorrelated phase filtering for raw dMRI data, which allows for correlated noise/noise distribution bias to be corrected, with real valued data as an output – circumventing Rician bias. Real valued data is then corrected for between volume motion correction, eddy current-induced distortion correction, bias field correction and gradient non-linearity correction for the diffusion space before fitting the signal decay to estimate effective radius maps (mm).
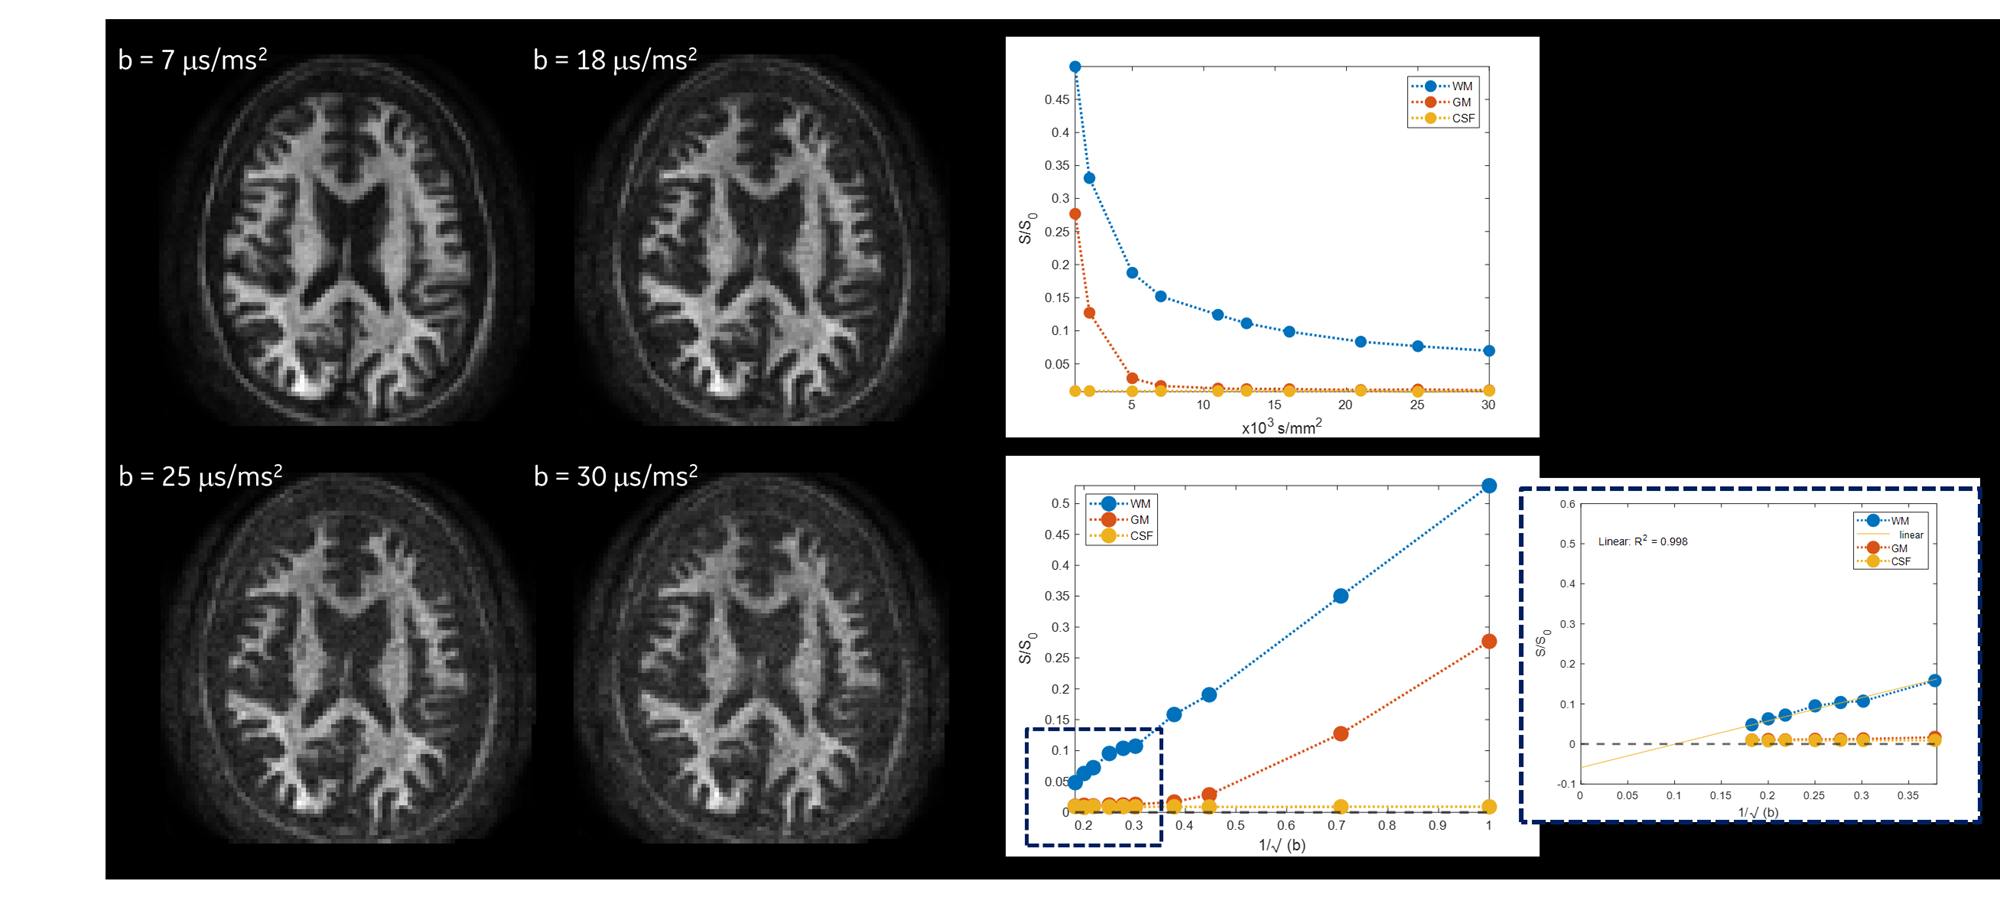
Figure 2. Spherically averaged signal for a representative slice, over an array of b-values is shown. Scatter plots highlight signal decay from whole brain white matter, gray matter, and CSF segmentation from the in vivo human brain both as a function of b-values and as a function of 1/√b . Plots highlight deviation from the power law scaling in mean white matter (as opposed to mean gray matter signal), demonstrating sensitivity of the signal to the radial intra-axonal signal.
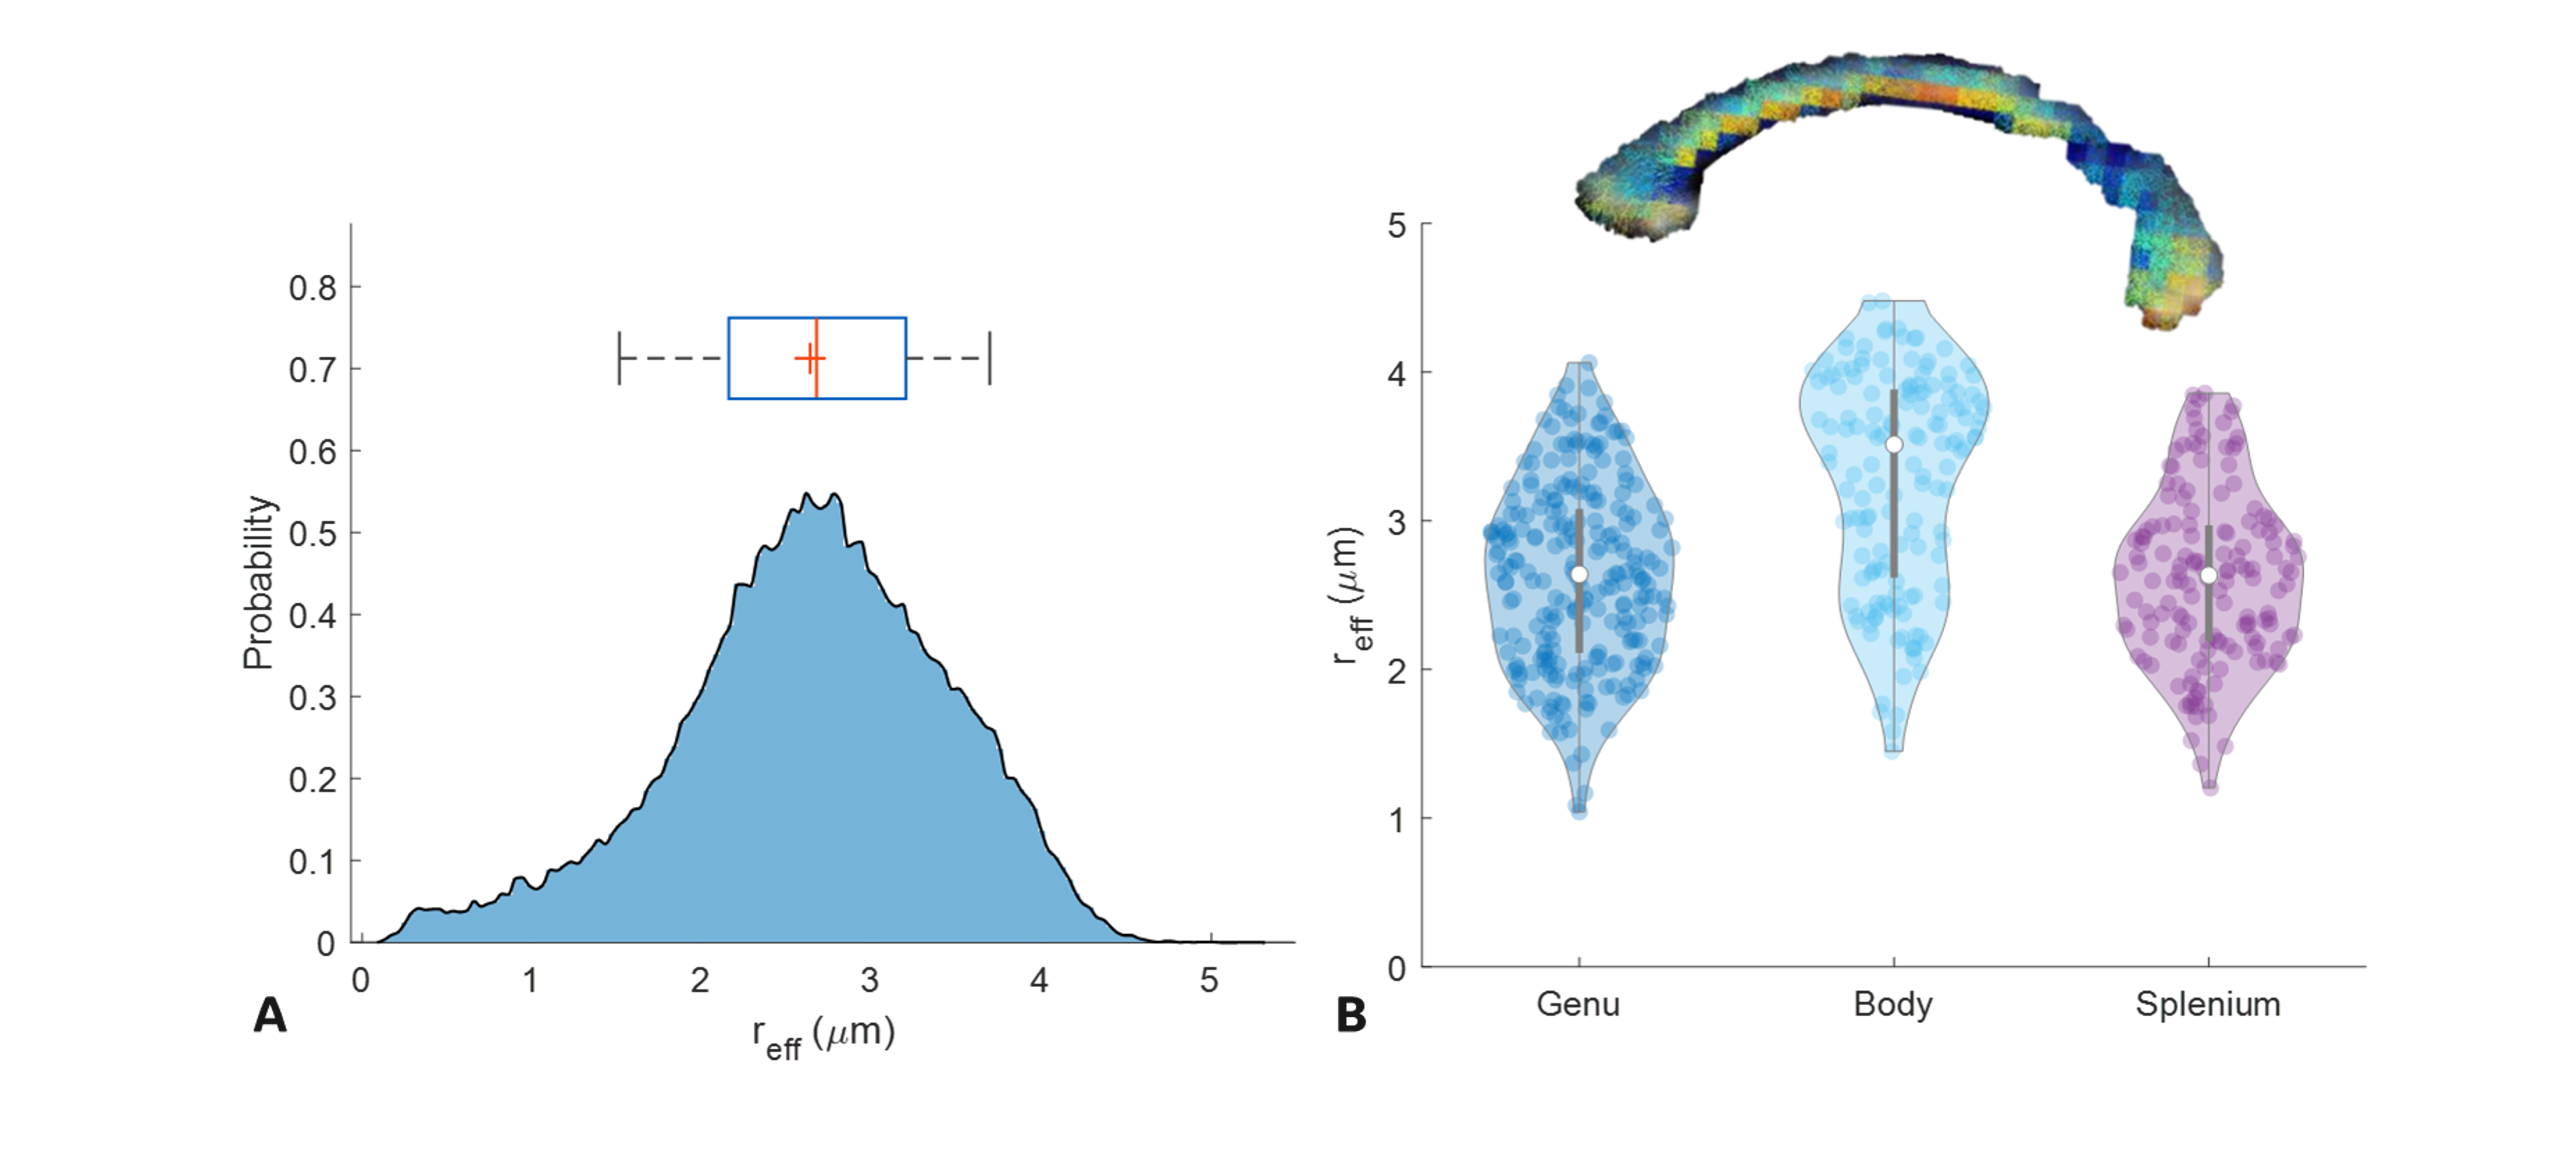
Figure 3. Histogram represents the effective radius distributions over whole brain white matter. Effective radius distributions from different ROIs in the in vivo human corpus callosum are shown in the violin plots. The distributions from the corpus callosum are in good agreement with prior literature.
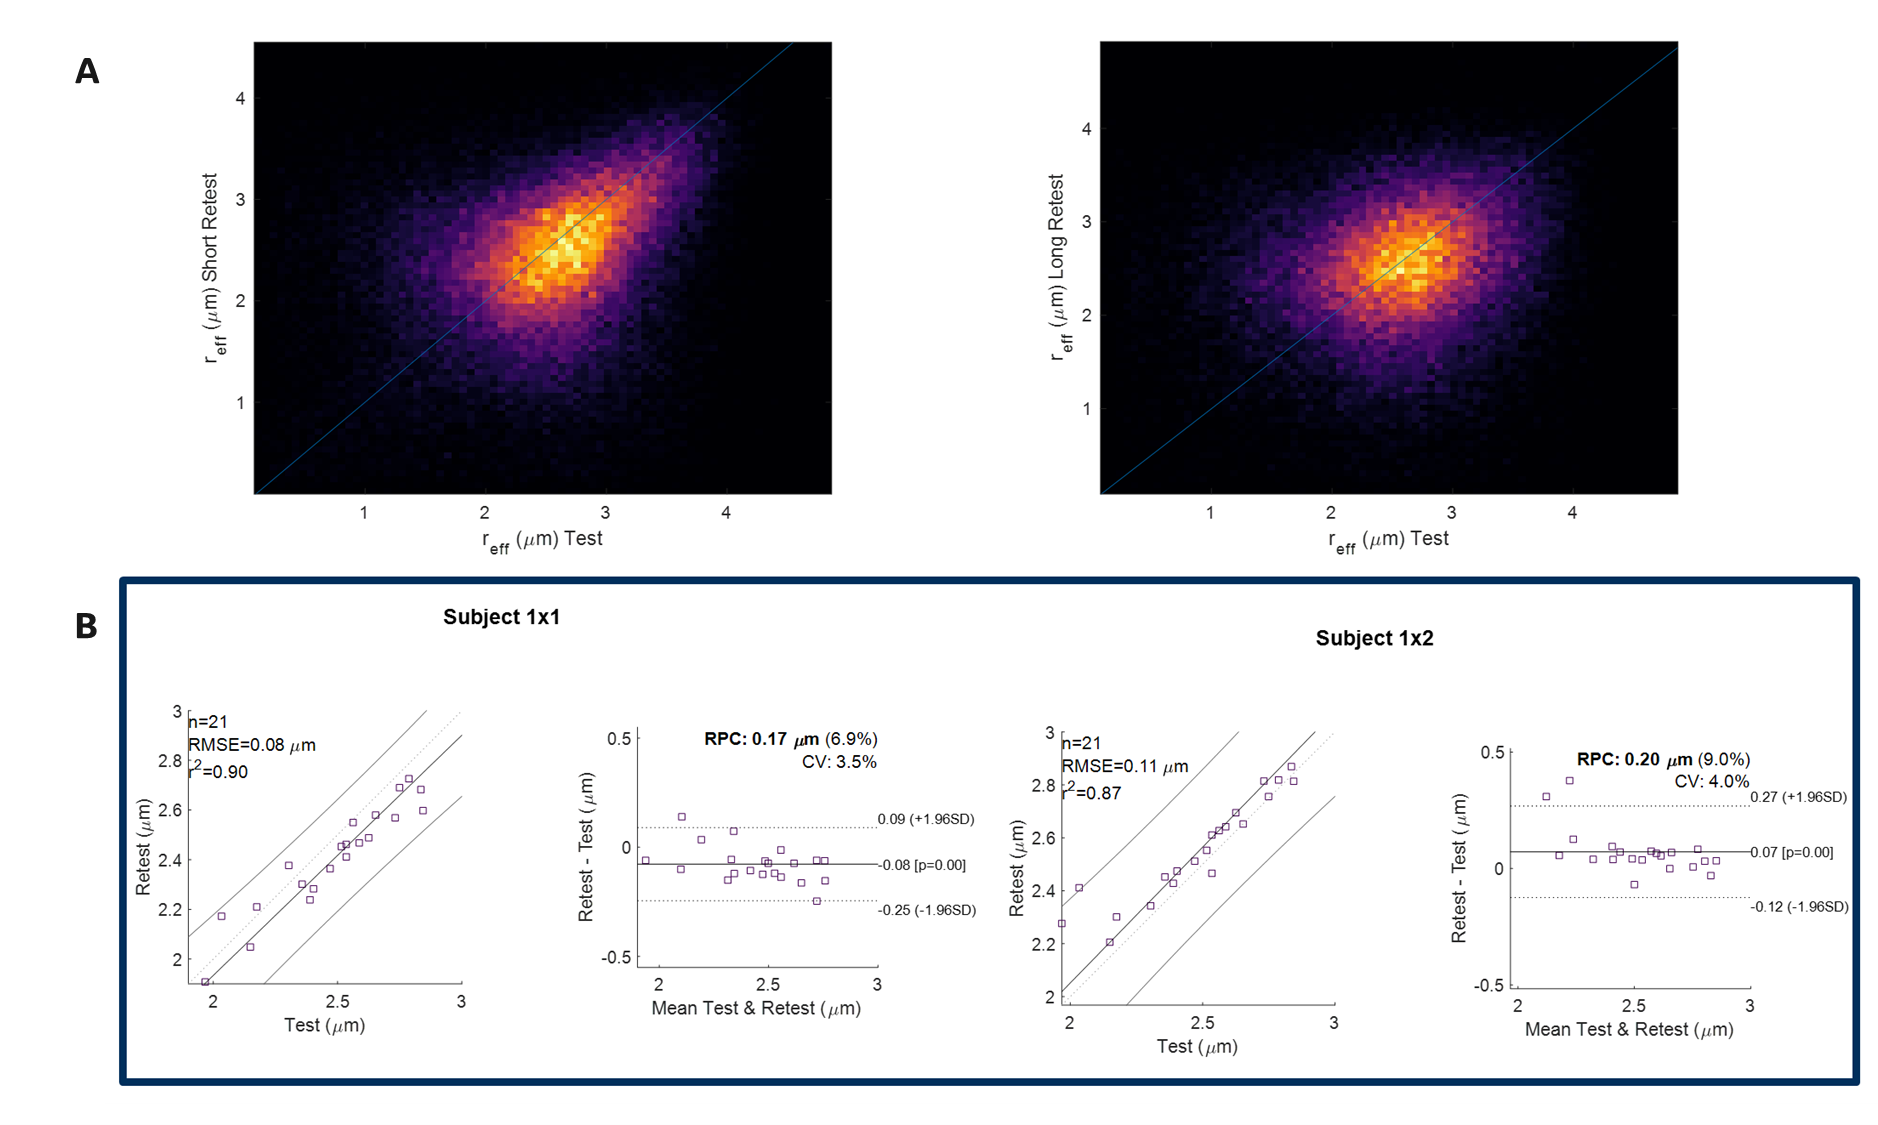
Figure 4. Kernel density plots (yellow is high density) for a representative test-retest volunteer for short and long are shown in (A). Correlation and Bland-Altman plots are presented for 21 white matter parcels using the ICBM atlas for the same subject for short and long test-retest analysis. Notably, high correlation was observed across all sessions with spearman correlation coefficient r = 0.95 and p-value at 0.00*, and coefficient of variation ≤4% across all parcels in this volunteer. Abbreviations: CV, coefficient of variation; RPC, reproducibility coefficient (1.96*SD).
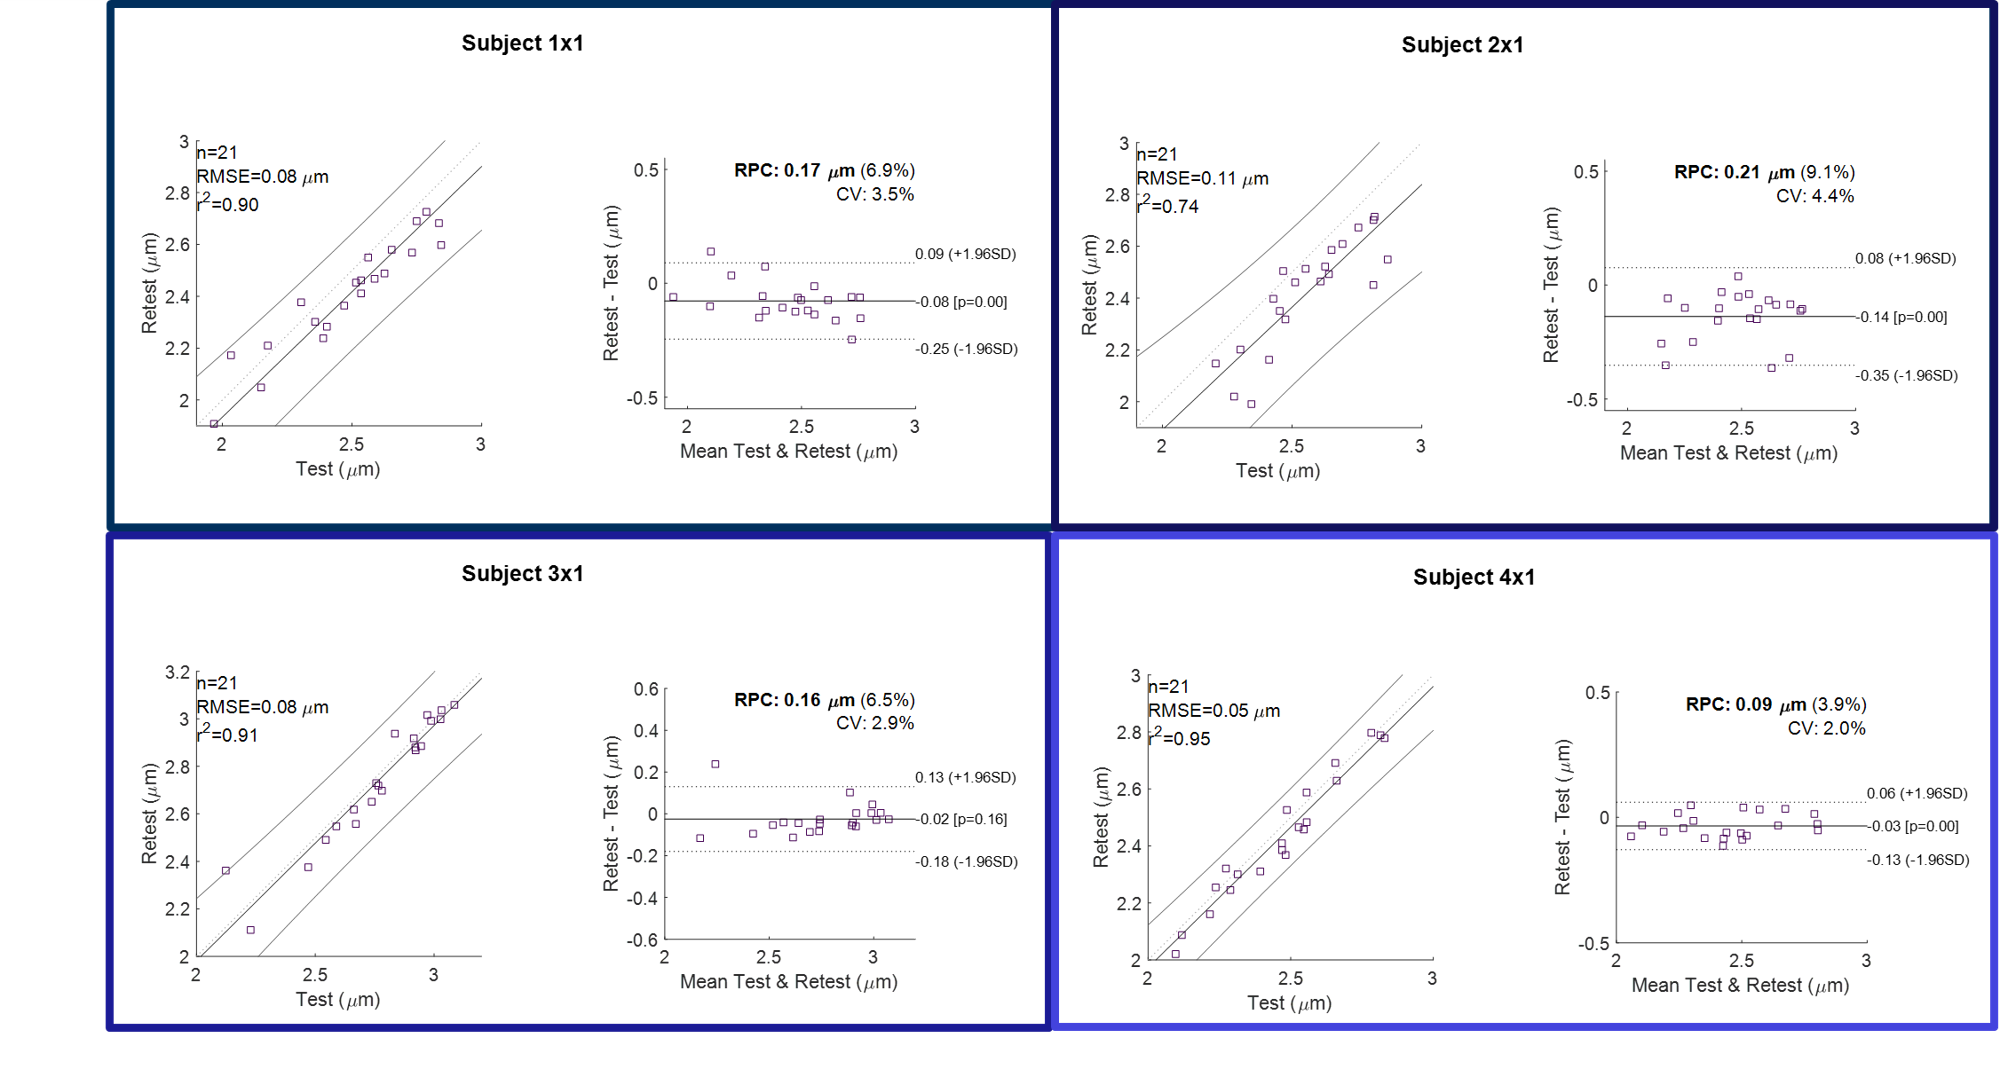
Figure 5. Correlation plots and Bland-Altman analysis for 21 white matter parcels in 4 test-retest volunteers, showing lack of systematic bias and high reproducibility. On average, the coefficient of variation was 3.2%, with a reproducibility coefficient of 0.16 mm (6.6%). Abbreviations: CV, coefficient of variation; RPC, reproducibility coefficient (1.96*SD).