0758
Transmission of Rotary Excitation enables Quantification of Oscillating nT-Fields using a Linear Calibration Model1Department of Internal Medicine I, University Hospital Würzburg, Würzburg, Germany, 2Experimental Physics 5, University of Würzburg, Würzburg, Germany, 3Fraunhofer Institute for Integrated Circuits IIS, Würzburg, Germany, 4Department of Psychiatry, Psychosomatics, and Psychotherapy, University Hospital Würzburg, Würzburg, Germany, 5Department of Psychology, University of Würzburg, Würzburg, Germany, 6Comprehensive Heart Failure Center (CHFC), University Hospital Würzburg, Würzburg, Germany
Synopsis
Keywords: Bioeffects & Magnetic Fields, Quantitative Imaging, spin-lock
Rotary excitation based MRI, which enables spatially resolved, non-invasive, direct detection of biomagnetic fields, complements the measurement range accessible via MEG since detection is independent of the distance to the body surface. We present an extension of the REX method towards quantitative imaging. A calibration function can be composed from REX data of two measurements of adjustable fields projected onto the tissue by the scanner’s gradient system. In subsequent measurements, the field strength can be inferred from the calibration model. First in vivo proof-of-concept measurements show that the calibration successfully eliminates influences of tissue properties and accurately quantifies oscillatory nT-fields.Introduction
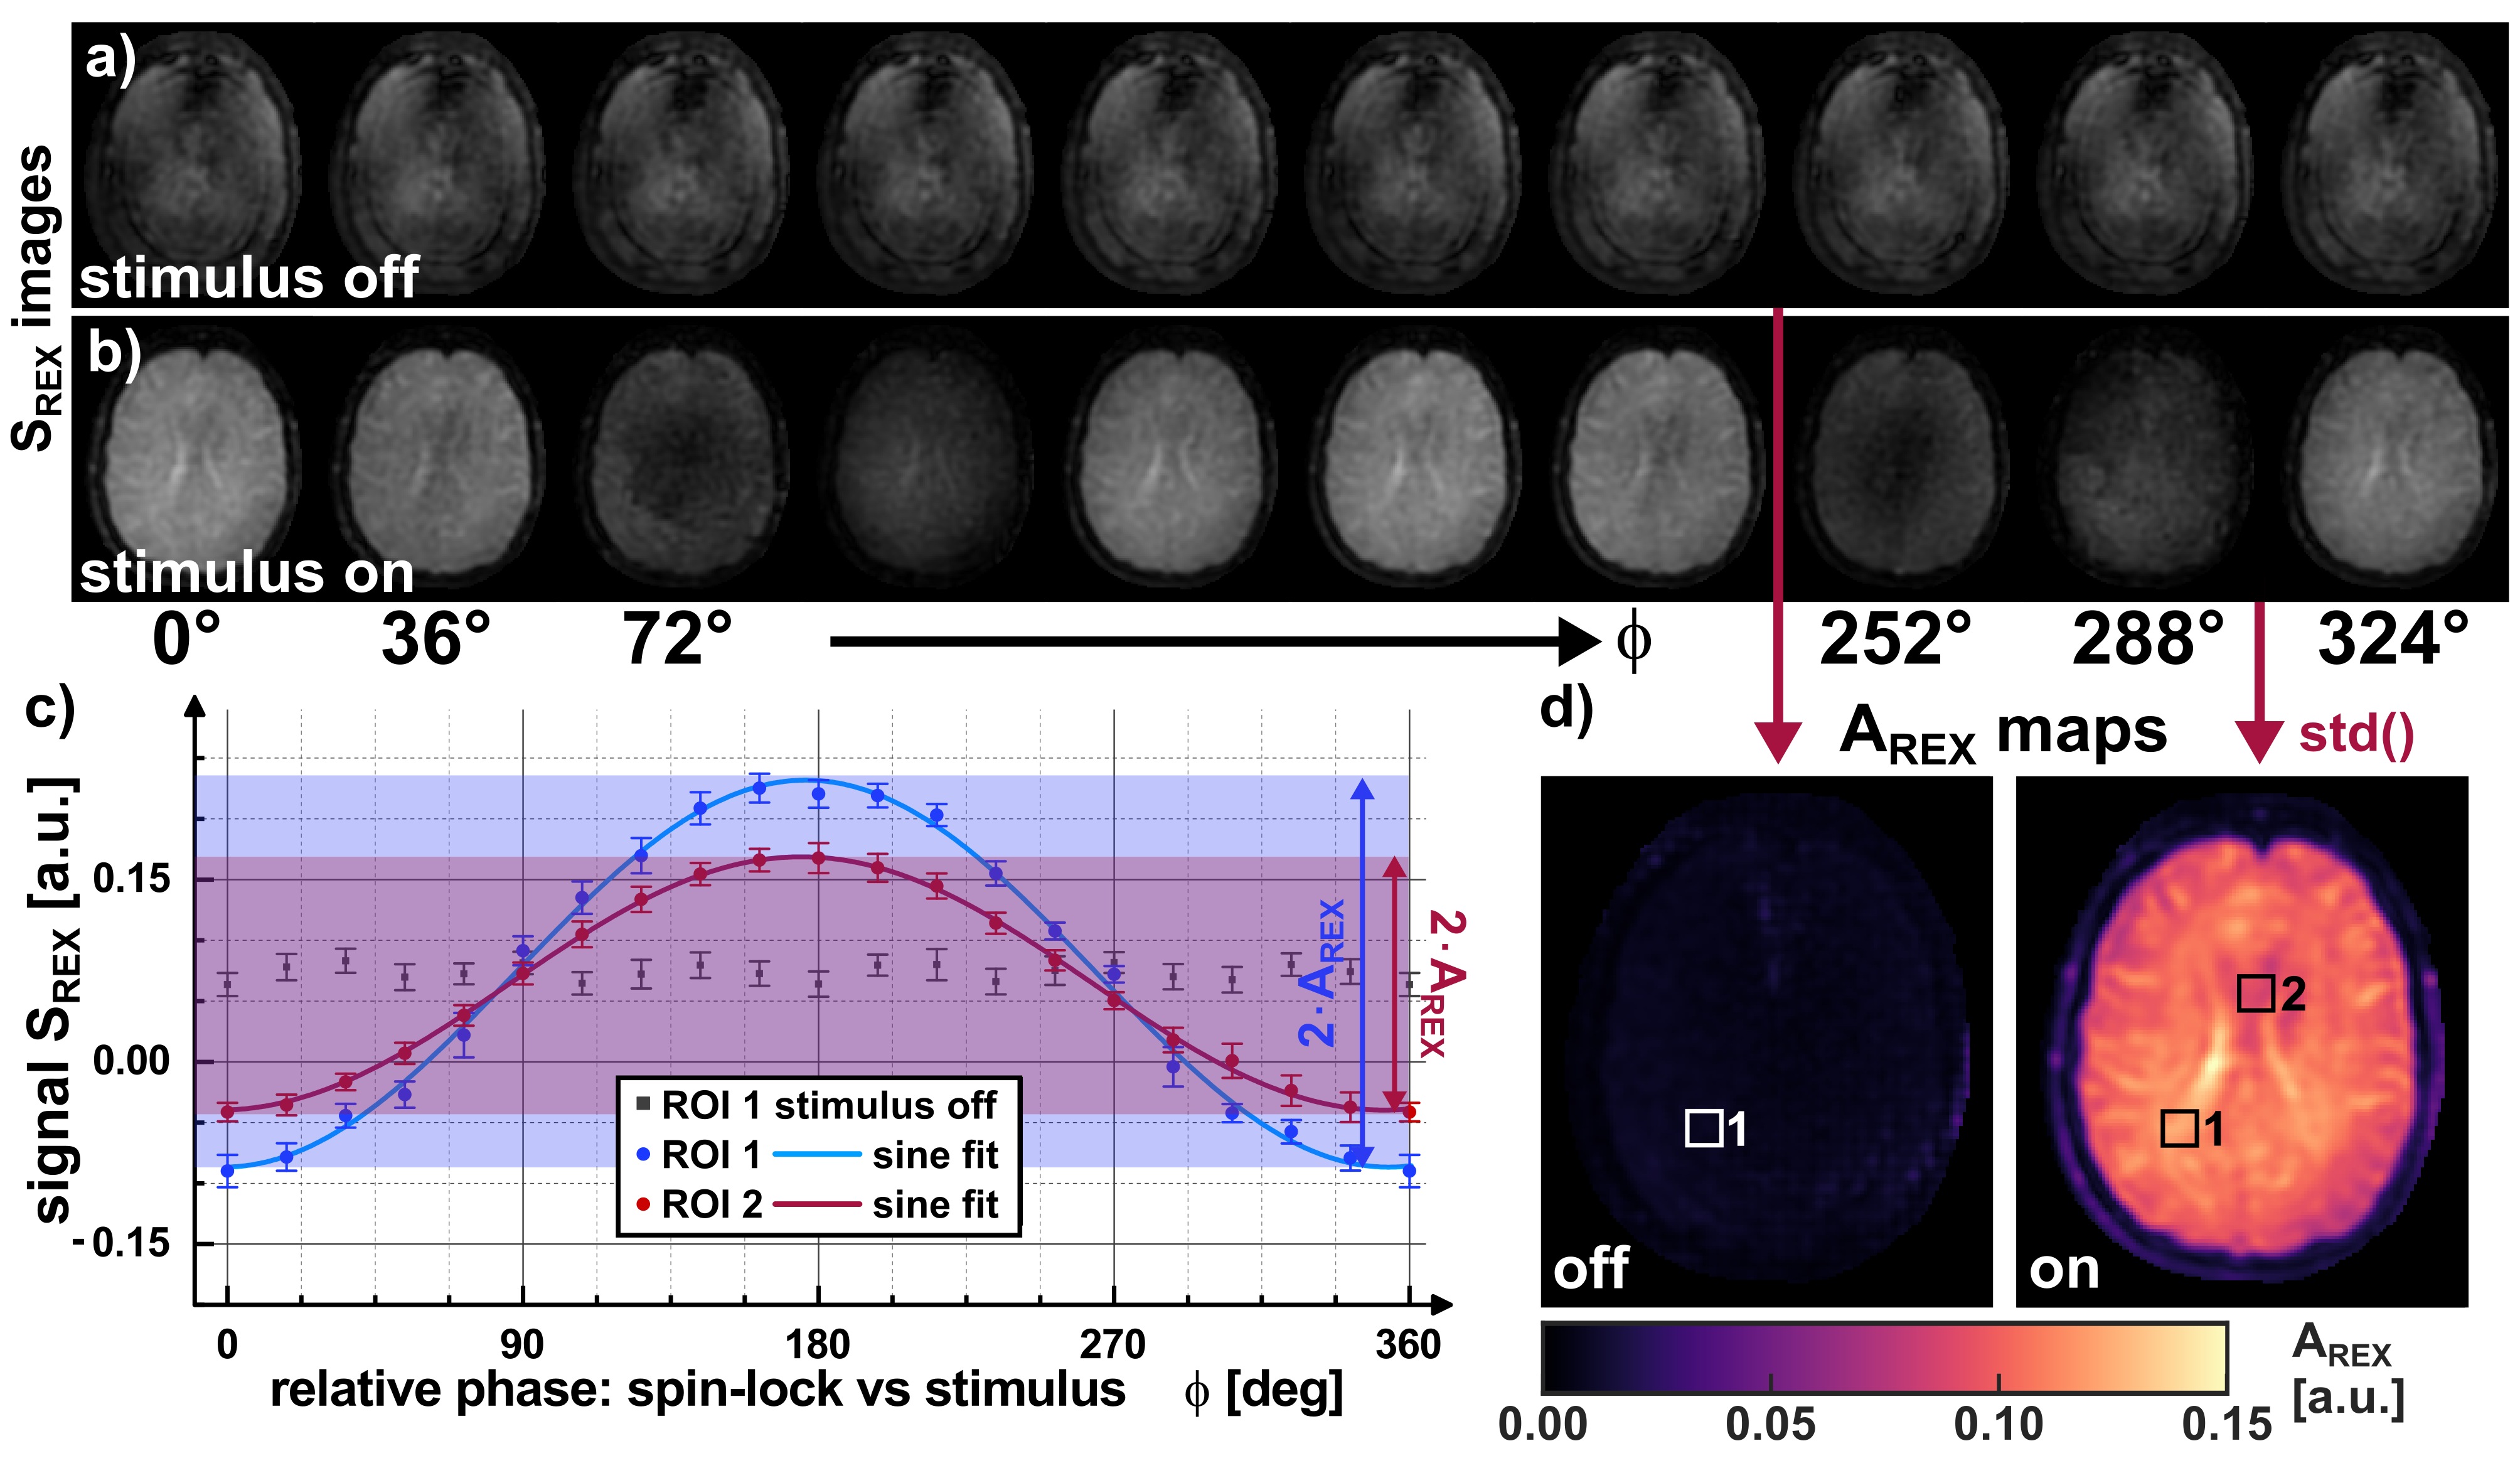
In recent years, spin-lock (SL) based MRI approaches have been introduced which can potentially provide direct and spatially resolved detection of neuronal activity [1,2] and thus may overcome critical limitations of Electroencephalography (EEG), Magnetoencephalography (MEG) as well as blood-oxygenation-level-dependent (BOLD) functional MRI. So far, the highest sensitivity has been demonstrated for SL methods that rely on Rotary Excitation (REX) rather than Rotary Saturation [3]. The REX detection of magnetic oscillations consists of the observation of a sinusoidal signal variation of the MRI signal SREX and the determination of the corresponding amplitude AREX. However, the detected values alone do not provide quantification of magnetic oscillations, since AREX is tissue-dependent and is influenced by relaxation times as well as proton density and local field properties. In this work, we demonstrate that due to the high linearity of the REX effect, quantification of oscillating nT-fields is feasible via a linear model accounting for tissue properties. The calibration applies a method which utilizes ultra-weak gradient waveforms to transmit the REX effect onto the tissue under investigation (transmission of Rotary Excitation, tREX) [4]. In the present study, we validate the concept in a healthy volunteer in brain tissue with magnetic oscillations in the low nT-range.Methods
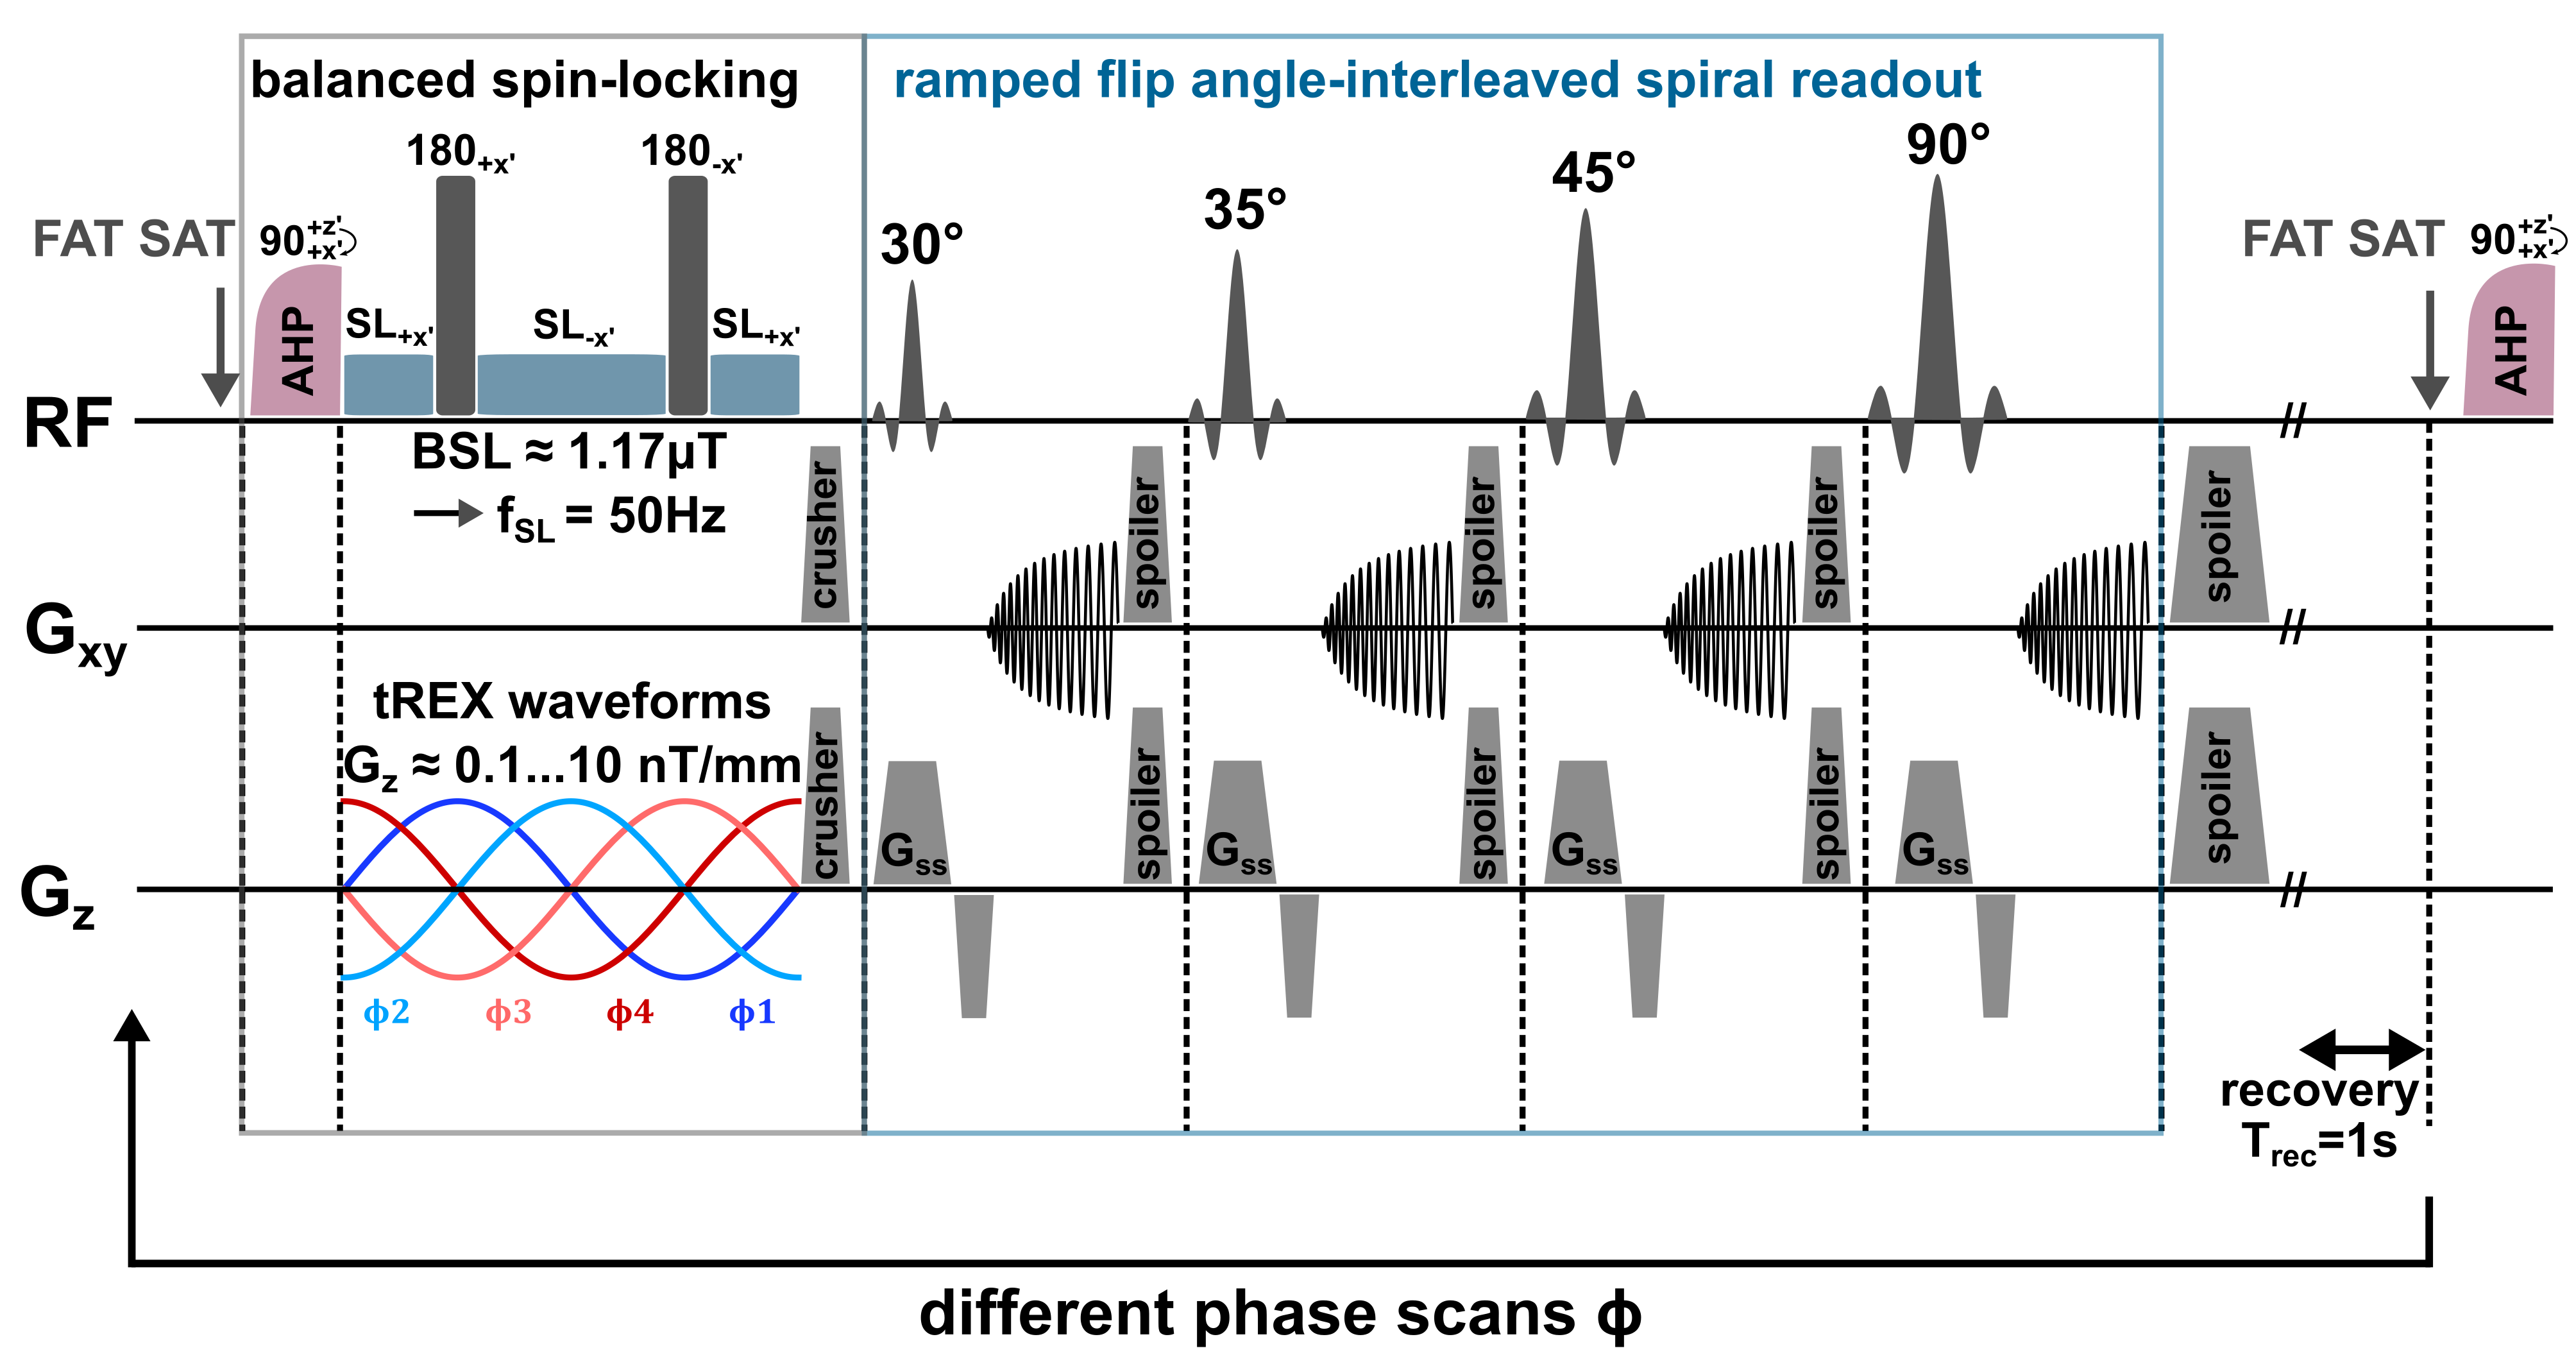
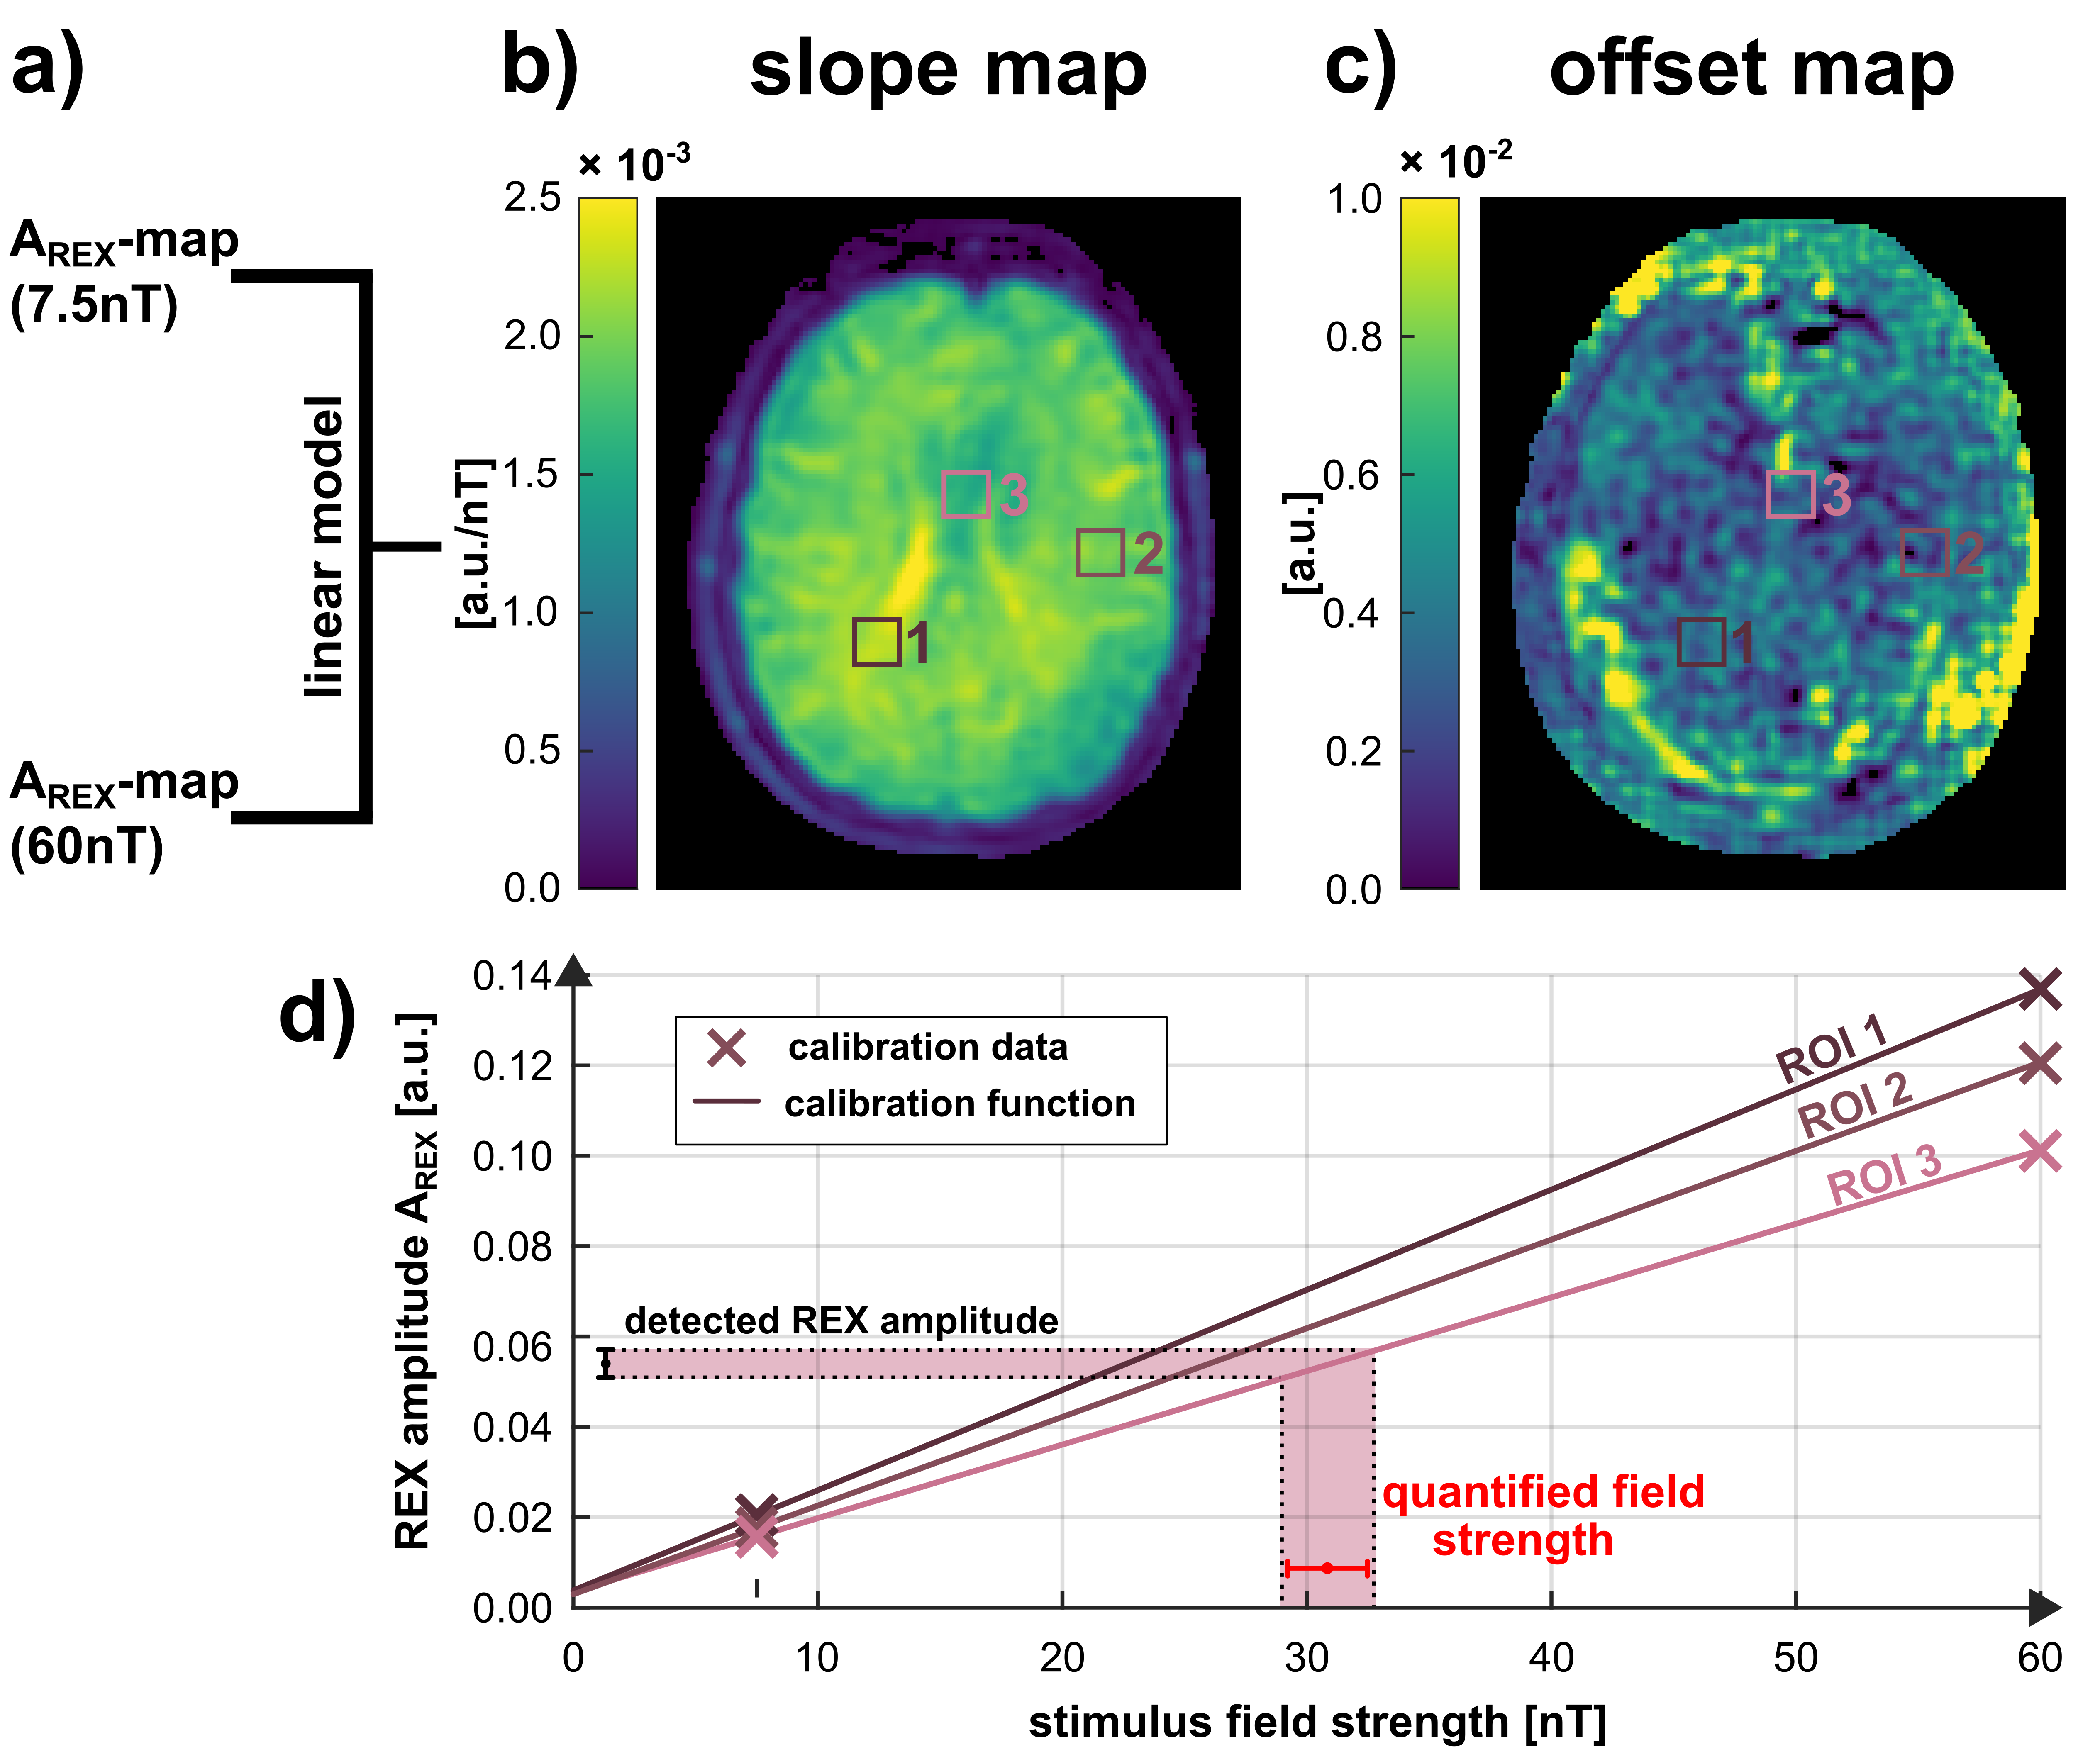
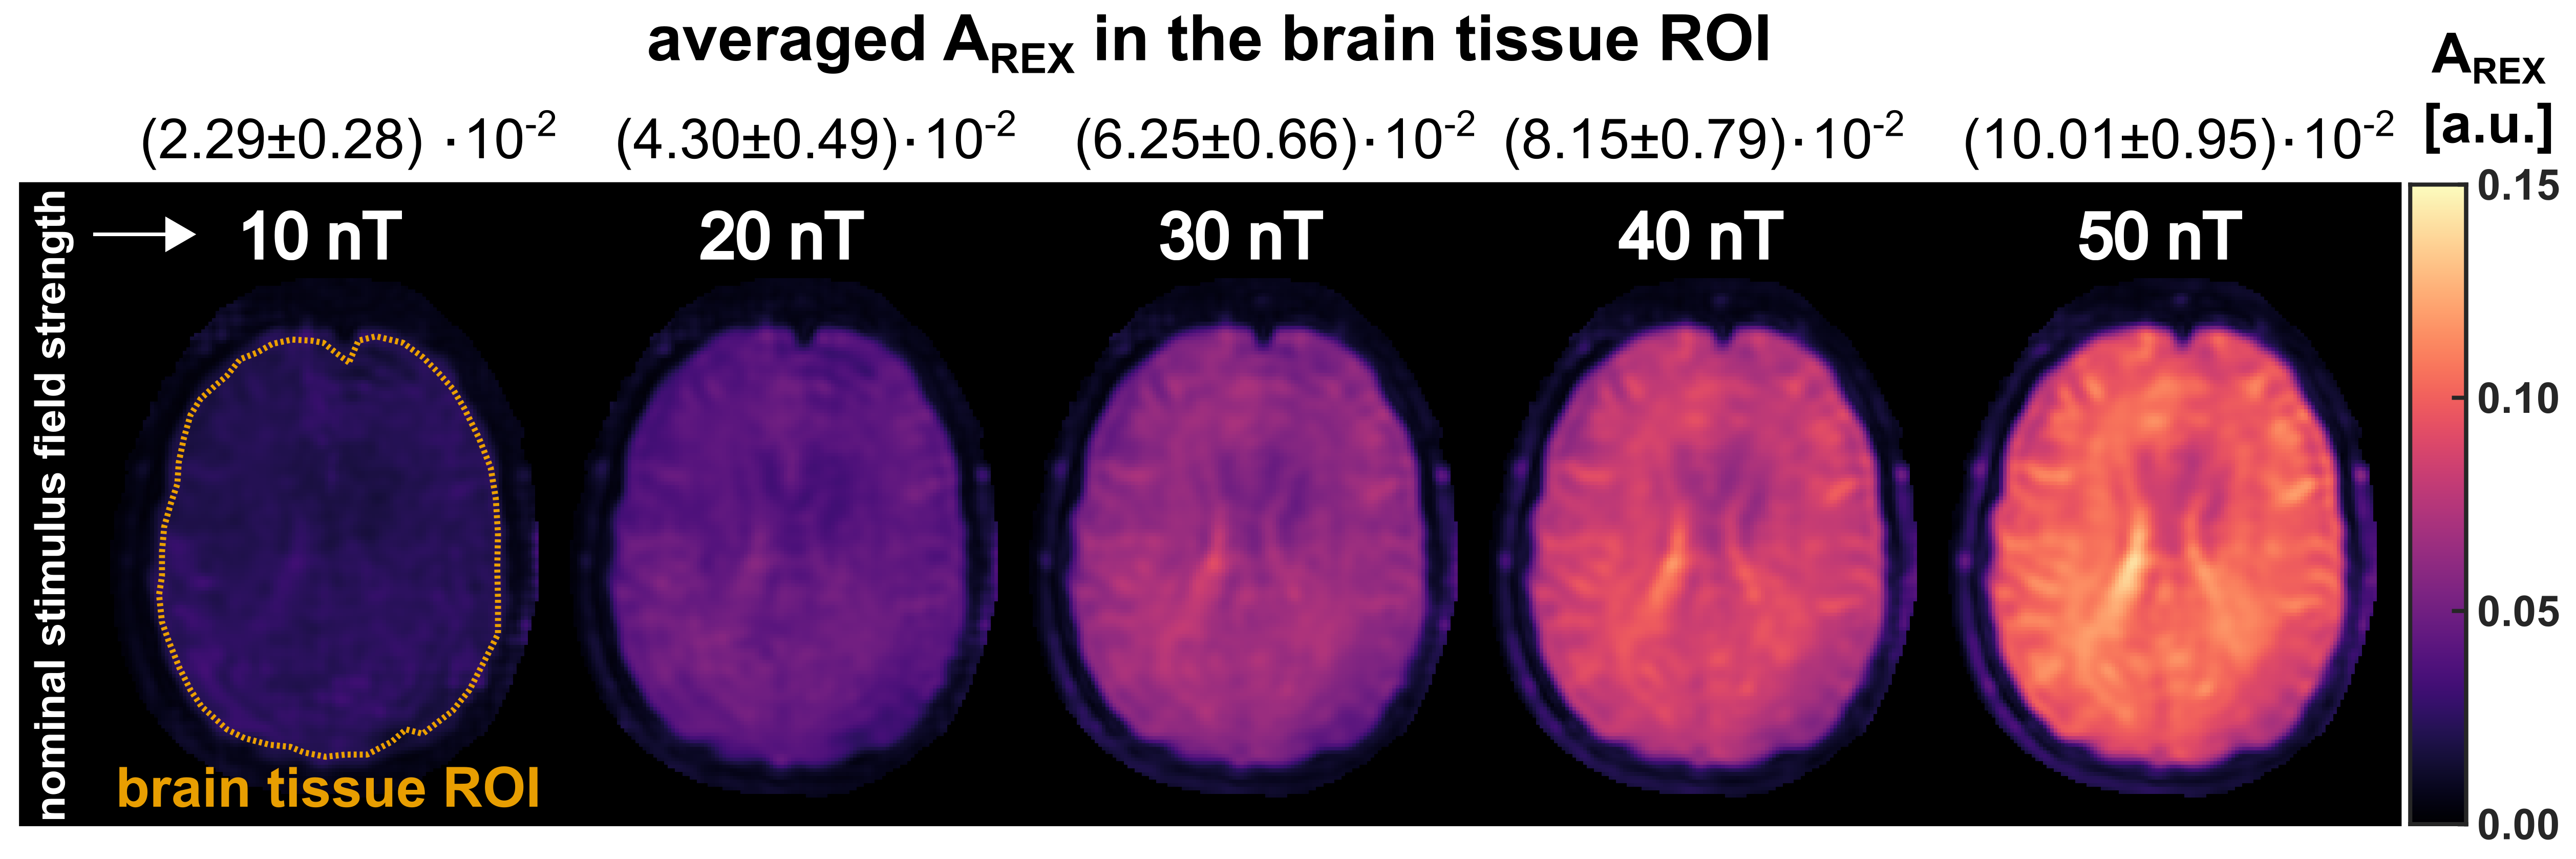
All experiments were carried out on a clinical 3.0T scanner (MAGNETOM Skyra, Siemens, Erlangen, Germany) using a 20-channel head coil. The tREX sequence (Fig. 1) was implemented within the open-source Pulseq framework [5] and employs a balanced-SL preparation for robust field detection [4,6] with ramped flip angle acquisitions for fast spiral imaging. For the reproducible generation of magnetic field oscillations (stimuli), the built-in gradient system was utilized. As can be seen in Fig. 2, the REX contrast depends on the relative phase between the SL-preparation and the stimulus. Since the signal magnitude of a single image is not conclusive, the amplitude AREX, which is calculated by the standard deviation over images of different phases, serves as the indicator for field detection. For AREX determination, 20 phase scans were performed (total measurement duration ≈20s). However, AREX is solely scaled in arbitrary units (a.u.) and does not allow direct reconstruction of the detected stimulus strength. Therefore, for AREX quantification, two additional calibration experiments were conducted using tREX at well-known stimulus field strengths of 7.5nT and 60nT. Since tissue and field properties critically affect AREX, a site-dependent calibration function was calculated based on a linear model by determining an AREX slope along with an offset that accounts for noise in the REX signal. After calibration, further detections were performed with magnetic stimuli in the 10…50nT range to demonstrate spatially resolved field quantification under in vivo conditions.Results
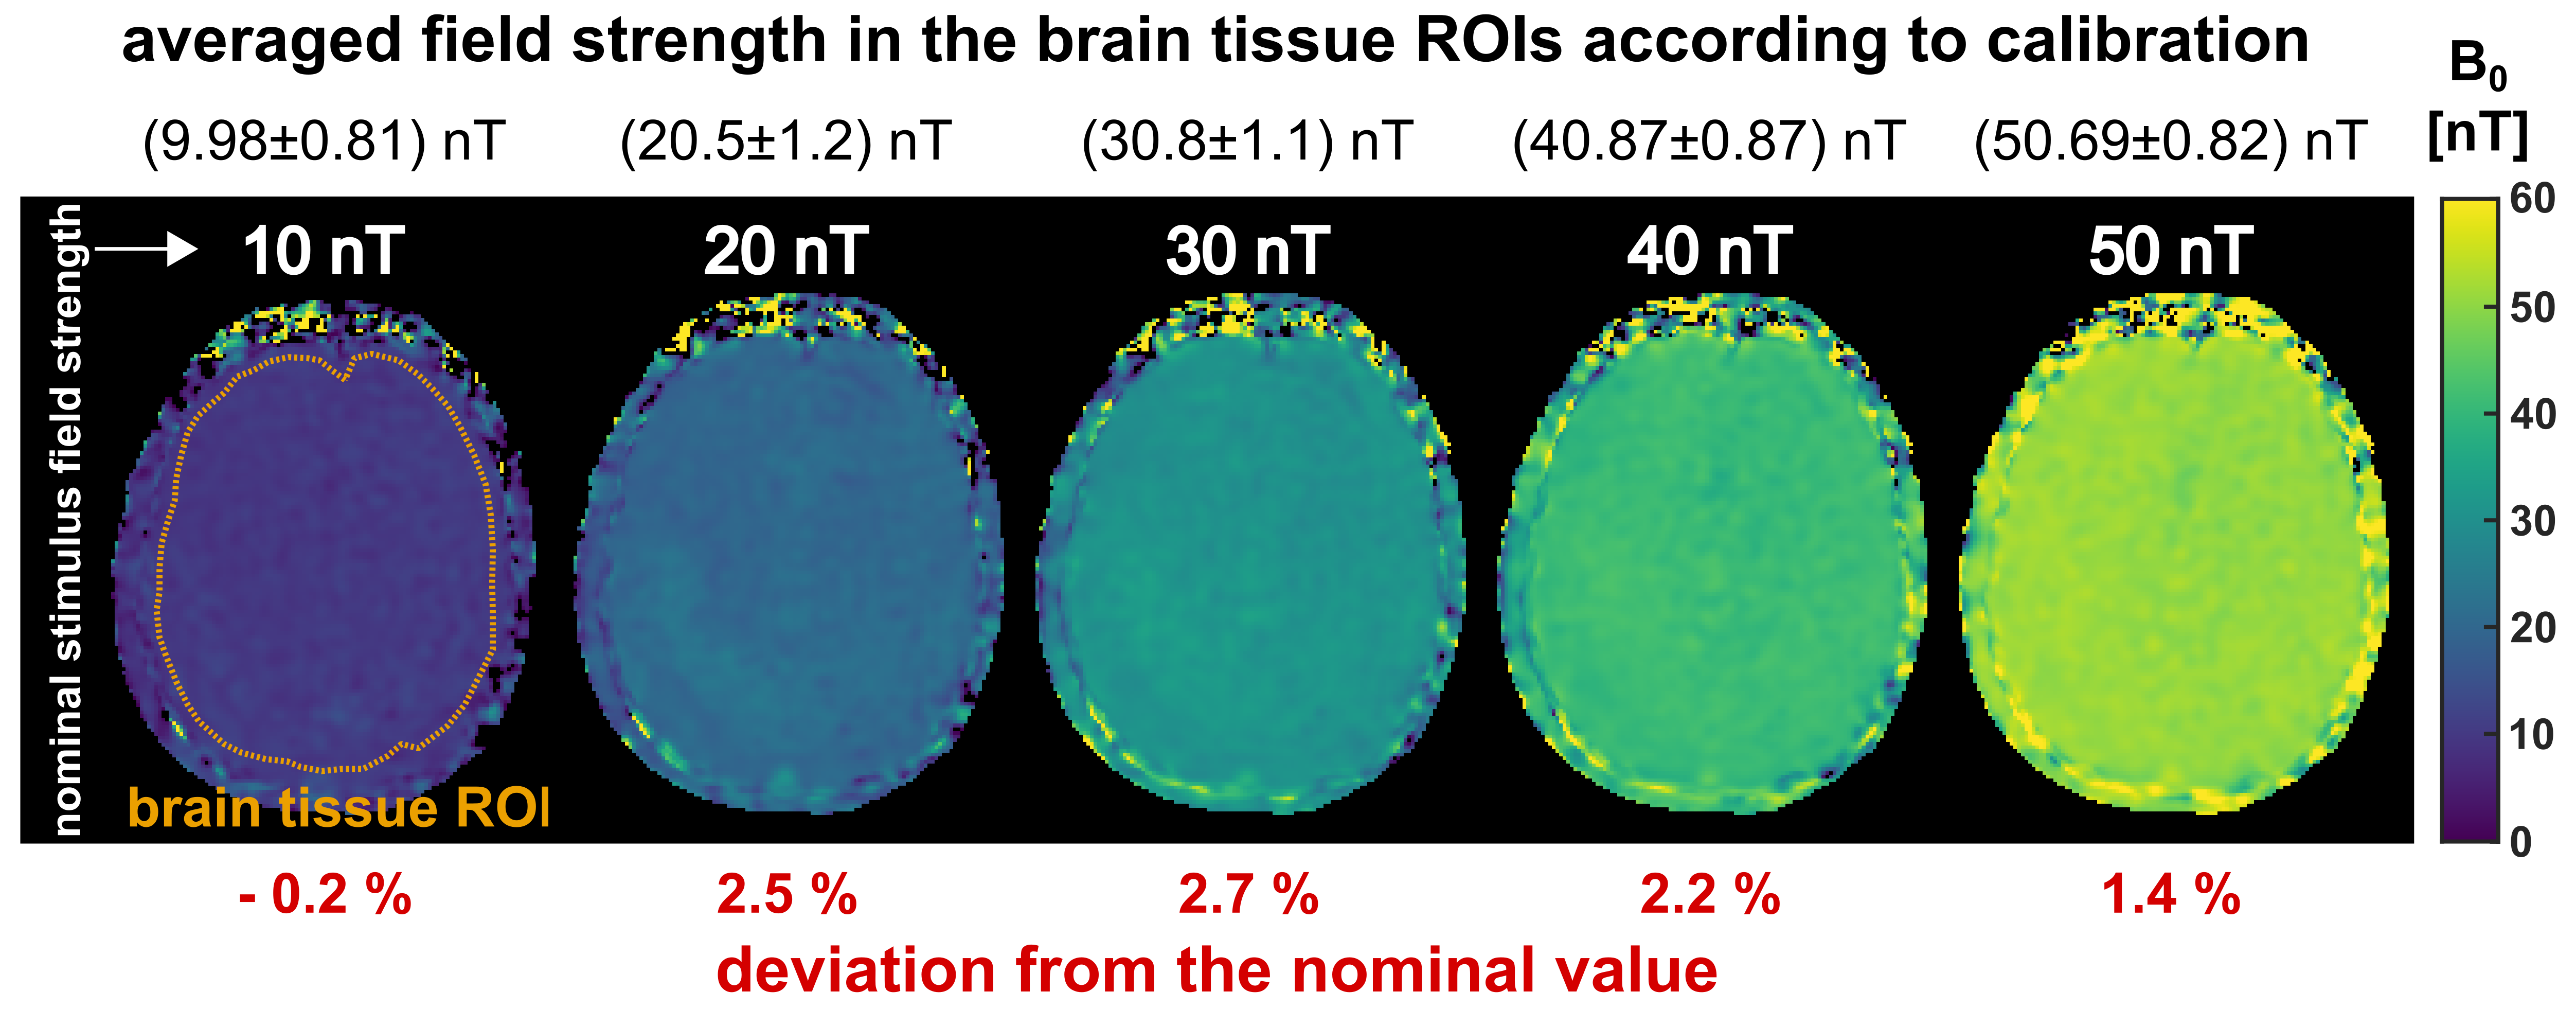
Fig. 3 illustrates the concept of setting up the linear calibration function by calculating a REX slope and a corresponding offset map. The slope of the REX amplitude clearly indicates anatomic structures. Fig. 4 displays the AREX detection for field strengths in the range 10…50nT. The amplitude increases with stimulus field strength, however, AREX is not homogeneous and reveals tissue properties. This is also reflected by the values averaged over an entire brain tissue ROI. The mean value increases with field strength. The variation over the ROI also increases and amounts to on average ±10.7%. In Fig. 5, the detected AREX maps were converted to quantitative field maps using the calibration model. The field maps are homogeneous within the subject and deviate from the nominal field strength values only in the low percentage range. The variation over the brain tissue ROI amounts to ±4.3% and remains approximately constant at ±0.96nT. The quantitative field maps reveal no significant site dependence and no apparent influence of tissue properties.Discussion
With a linear tREX calibration, the highly sensitive REX method for detection of magnetic field oscillations can be extended, enabling the quantification of nT-fields. The calibration function can be determined by only two tREX experiments and was generated in less than 1min in this case. The calibration places low demands on the experimental setup, since no additional hardware is required and measurements can be carried out in vivo. Due to the limitations of our gradient system, only the range above 2.5nT was accessible for calibration [4]. Accordingly, REX quantification of sub-nT-fields can currently only be accomplished by extrapolating the calibration function. This procedure needs to be further validated in future studies.Conclusion
Calibration of the Rotary Excitation effect by means of tREX can be applied to quantify ultra-weak field oscillations with accuracy better than 1nT. The proposed concept thus paves the way for spatially resolved and quantitative sensing of neuronal activity via MRI.Acknowledgements
This work was supported by the Federal Ministry for Education and Research of the Federal Republic of Germany (BMBF 01EO1504, MO6).References
[1] Truong TK, et al. Toward direct MRI of neuro-electro-magnetic oscillations in the human brain. Magn Reson Med. 2019 Jun;81(6):3462-3475. doi: 10.1002/mrm.27654
[2] Capiglioni M, et al. Analysis of the robustness and dynamics of spin-locking preparations for the detection of oscillatory magnetic fields. Sci Rep. 2022 Oct 10;12(1):16965. doi: 10.1038/s41598-022-21232-1
[3] Jiang X, et al. Detection of subnanotesla oscillatory magnetic fields using MRI. Magn Reson Med. 2016 Feb;75(2):519-26. doi: 10.1002/mrm.25553
[4] Gram M, et al. Towards robust in vivo quantification of oscillating biomagnetic fields using Rotary Excitation based MRI. Sci Rep. 2022 Sep 13;12(1):15375. doi: 10.1038/s41598-022-19275-5
[5] Layton KJ, et al. Pulseq: A rapid and hardware-independent pulse sequence prototyping framework. Magn Reson Med. 2017 Apr;77(4):1544-1552. doi: 10.1002/mrm.26235
[6] Gram M, et al. Balanced spin-lock preparation for B1 -insensitive and B0 -insensitive quantification of the rotating frame relaxation time T1ρ. Magn Reson Med. 2021 May;85(5):2771-2780. doi: 10.1002/mrm.28585
Figures