0748
Creating in vivo conformal thermal treatments using a multisource LITT device combined with real time multi-slice MR-thermometry1University of Bordeaux, CNRS, CRMSB, UMR 5536, IHU Liryc, Bordeaux, France, Metropolitan, 2Certis Therapeutics, Pessac, France, 3ALPhANOV, Talence, France
Synopsis
Keywords: Interventional Devices, MR-Guided Interventions, Laser
Percutaneous clinical ablation devices usually create a heating pattern with an ellipsoid shape. Output power and duration of application are the only degrees of freedom, which does not allow creating conformal ablation. To overcome this limitation, we designed a Laser Interstitial Thermal Therapy (LITT) device allowing creating various heating patterns. We present here in vivo results in pig muscle monitored by real-time 2D multi-slice MR-thermometry.Introduction
Laser Interstitial Thermal Therapy (LITT) is a minimally invasive surgery exploiting light absorption by tissue to create focal irreversible necrosis to treat various diseases1,2. Current clinical LITT ablation devices generate ellipsoid (using diffusing tips) or unidirectional (radial emission) heating. Such devices do not allow creating heating shapes conformal to targeted region. Therefore, precise placement3 of the LITT probe within the targeted region is mandatory. In addition, its repositioning(s) is often required to sequentially ablate different parts of the pathological tissue, which complicates the procedure. To overcome these limitations, we present here the first in vivo results obtained in the leg of a pig under rapid, multi-slice MR-thermometry guidance using a prototype LITT device integrating multiple emitters that can be controlled independently.Material & Methods
Laser device: The laser device (Alphanov, France) consists of a 6-multimode-fiber bundle (200 µm core diameter per fiber) each connected to a 976 nm laser diode. Each diode (maximum average power of 9 W) is empowered by its own electronic board, allowing different power and emission duration at the same time for the different diodes. The probe tip has been shaped to create a radial propagation of each laser beam over 60° and distributed over 360° and has a total diameter of 2 mm over a length of a few centimeters4.Real-time MRI thermometry pipeline: The laser probe was inserted into the leg muscle of and anesthetized swine (N=2, 33 kg body mass, protocol approved by ethic committee). A 3D MPRAGE sequence (TI=1000 ms, TE=3 ms, TR=2000 ms, FA=15°, FOV=220 mmx186 mmx240 mm, 0.86 mmx0.86 mmx0.9 mm voxel resolution) served to locate the probe and position the MR-thermometry stack of slices perpendicularly to it. Six slices of a multi-slice single shot echo planar imaging sequence5 were acquired every second on a 1.5 T clinical scanner (Avanto, Siemens Healthineers): TE=21 ms, TR=1000 ms, FA=60°, FOV=180 mmx180 mm, 1.4 mmx1.4 mmx3 mm voxel resolution, GRAPPA acceleration=2, partial Fourier=6/8, bandwidth/pixel = 1445 Hz. Images were processed online to visualize temperature and thermal dose images (Certis Therapeutics, France) in 3D.
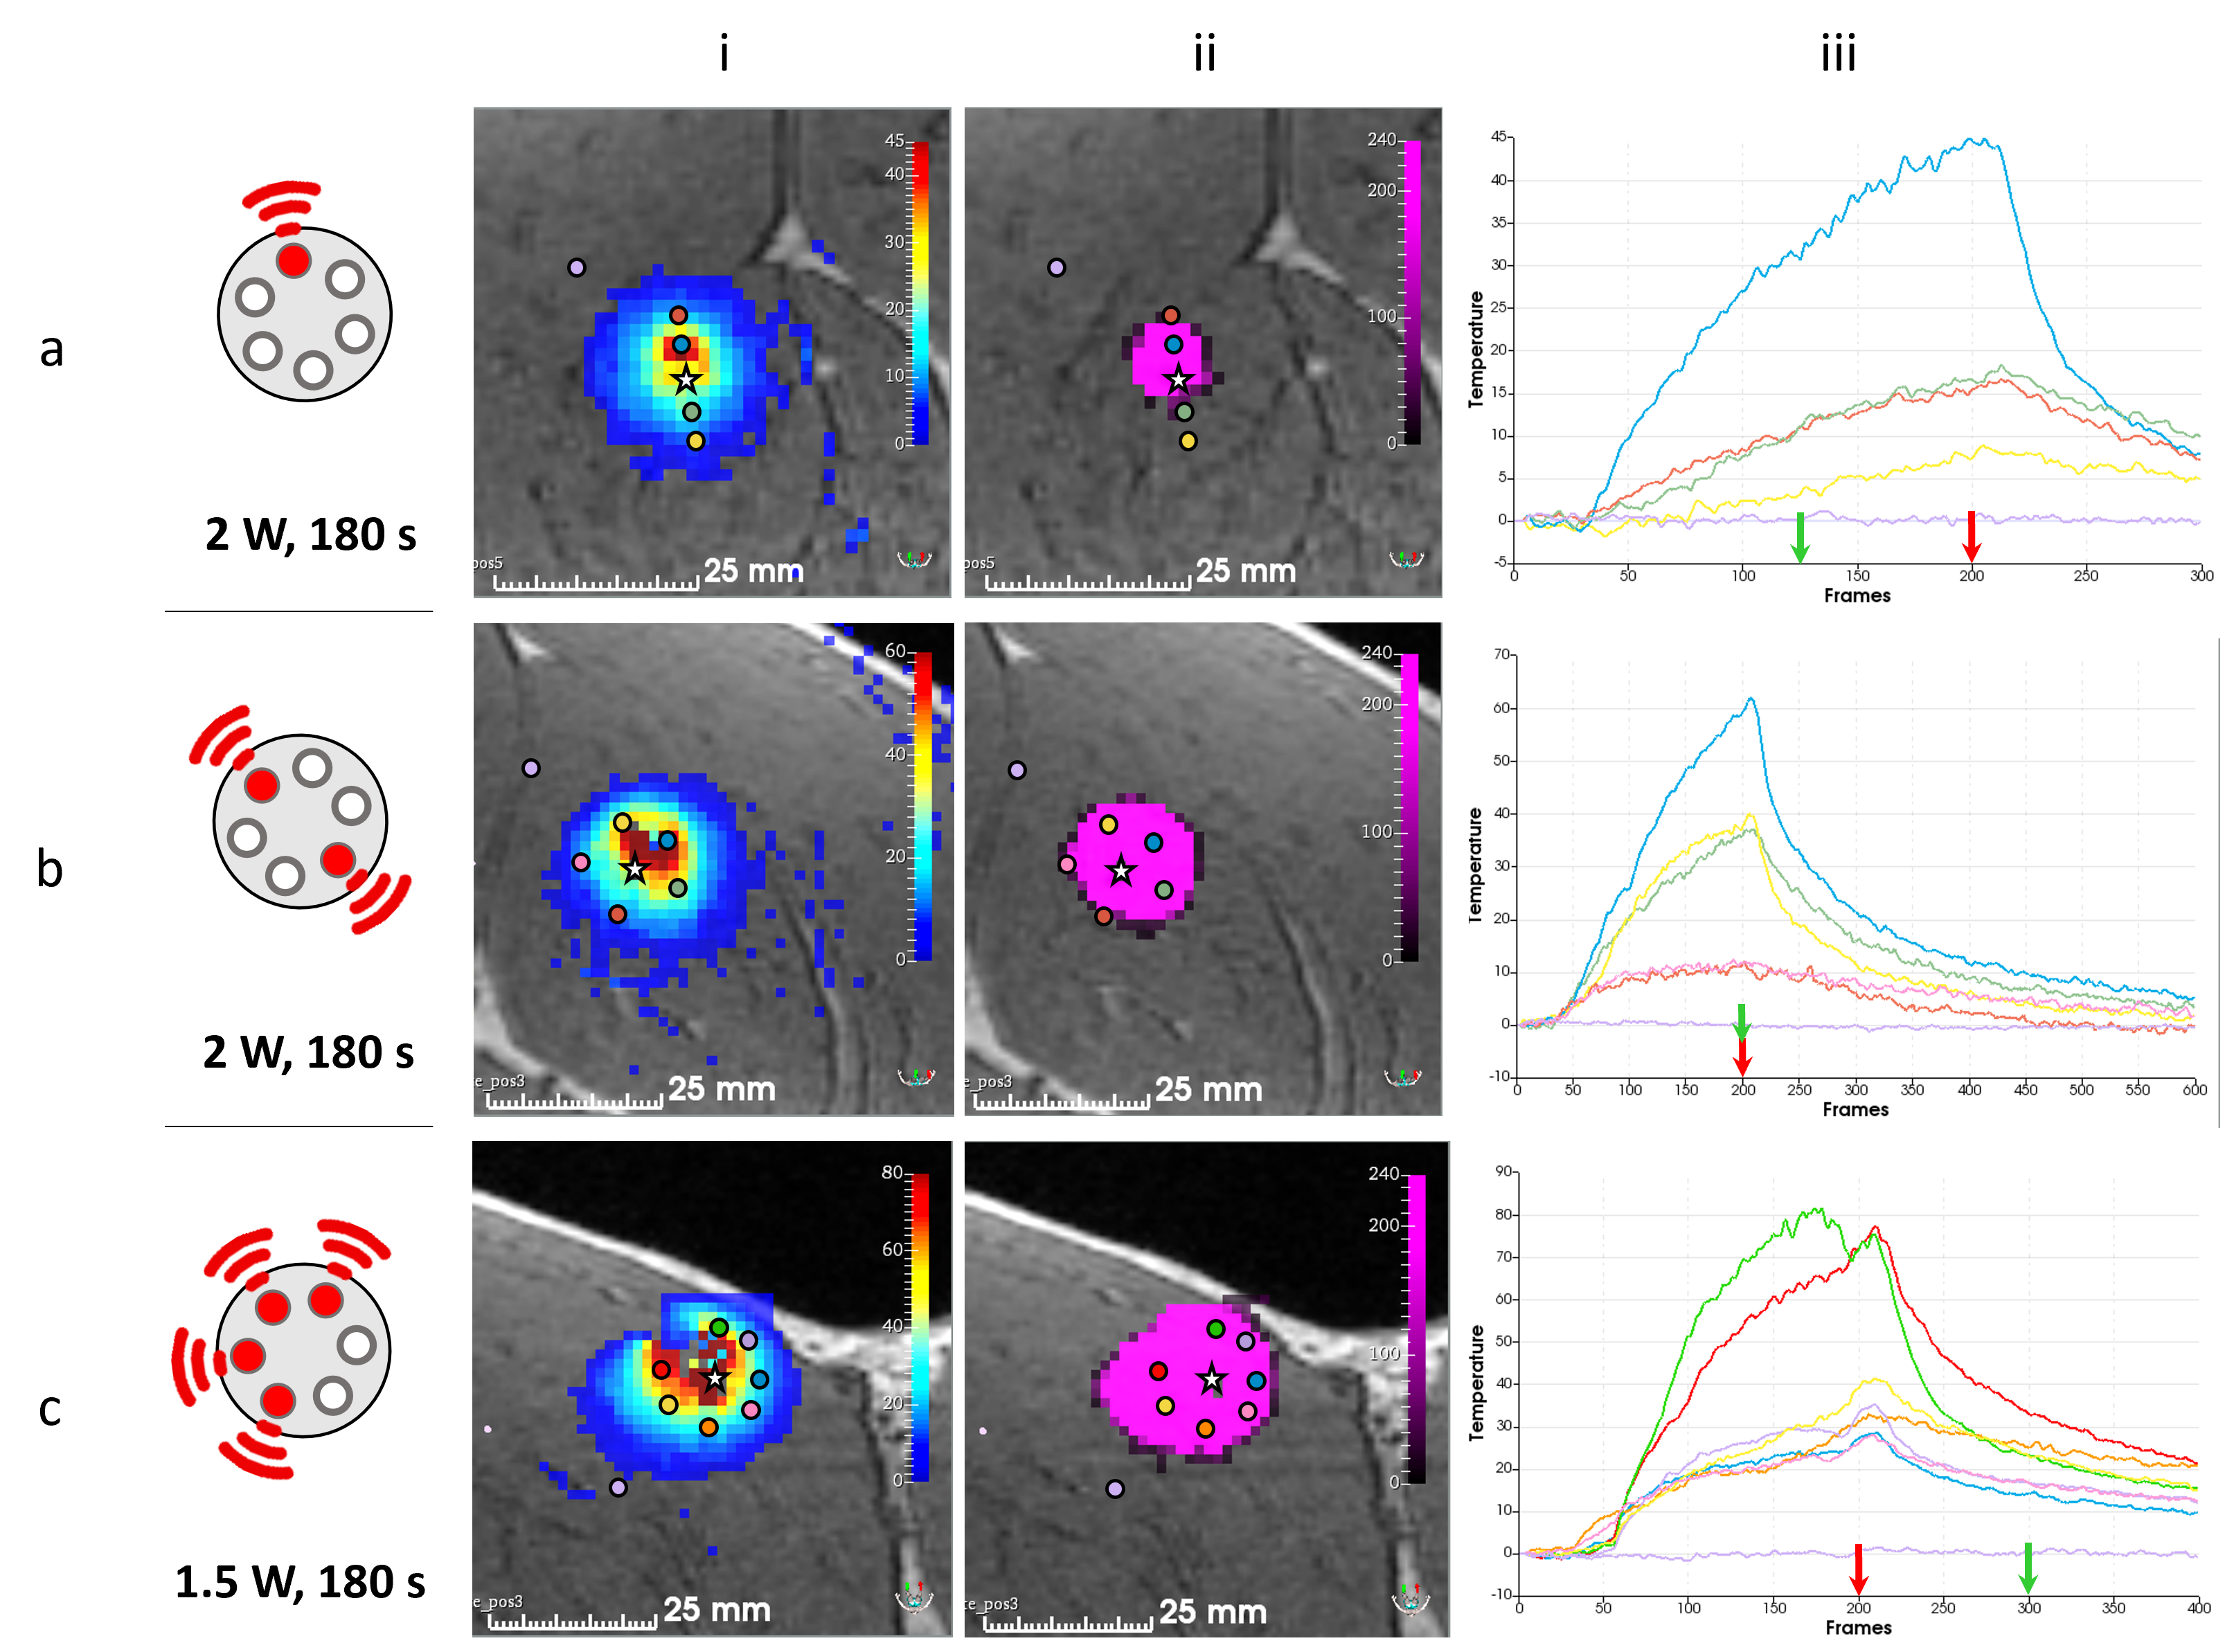
Test of different heating patterns: Before testing each illumination pattern, a low power short duration (1 W, 10 s) iterative activation of 3 diodes (one over two) with a cooling period of 60 s between each was done to match the heating zone to its corresponding diode, thus making it possible to select the diode(s) to activate to achieve different heating patterns. Several illumination patterns were then tested: 1 fiber only (2 W during 180 s), 2 fibers in opposite directions (2 W during 180 s on each) and 4 contiguous fibers (1.5 W during 180 s on each).
Results
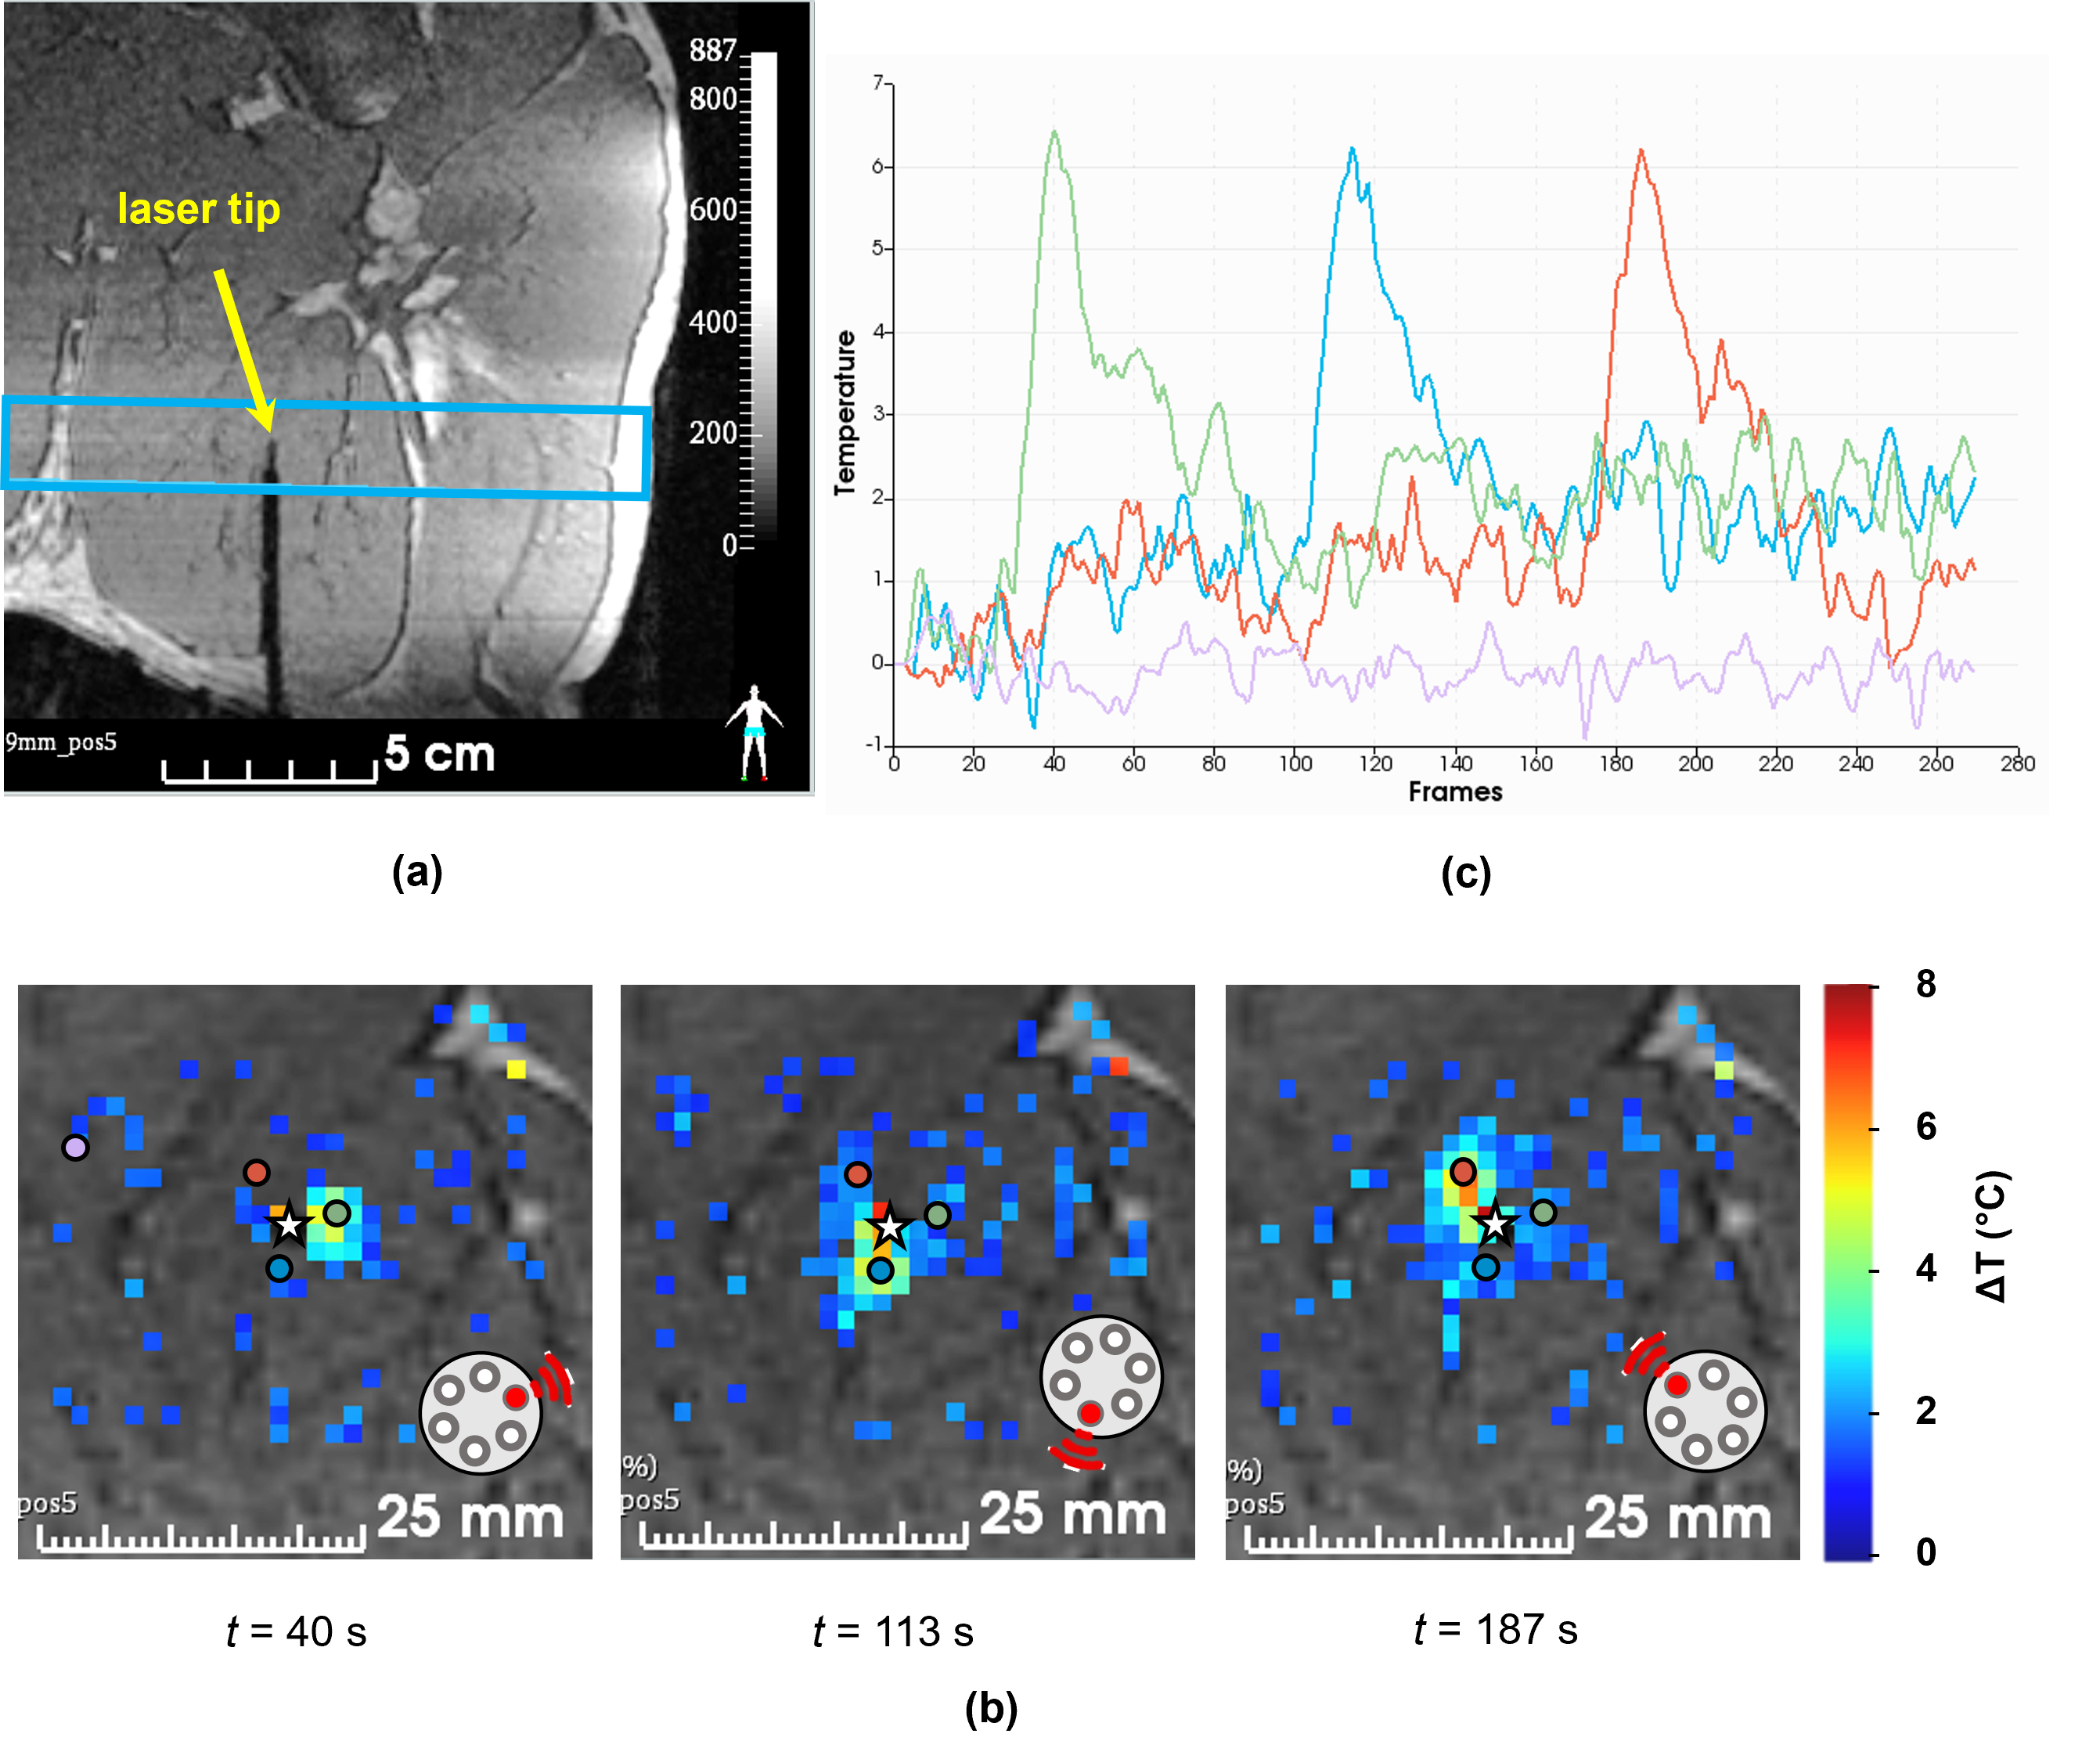
Figure 1a shows one slice (coronal view) of the 3D MPRAGE sequence acquired on the leg of a pig in vivo, with a laser probe inserted into the muscle. Figure 1b shows the resulting temperature maps obtained at different times, corresponding to the sequential activation of each fiber. The temporal evolution of the temperature in 3 single voxels located in front of each activated fiber is plotted on the graph of Figure 1c. Note that temperature increase remains around 6°C, which is unlikely to create irreversible damages in tissue. The mean standard deviation of the temperature measured in a single pixel located outside the heated region is 0.4°C and shows a great stability (see purple trace in Figure 1c) even for long duration acquisitions (> 5 min).Figure 2 presents the results of the 3 tested illumination patterns. The resulting temperature and thermal dose images show that a triangle, an ellipse, and a half sphere can be created with the same device. The maximal lesion size was obtained for the half sphere pattern and reached 2.5 cm.
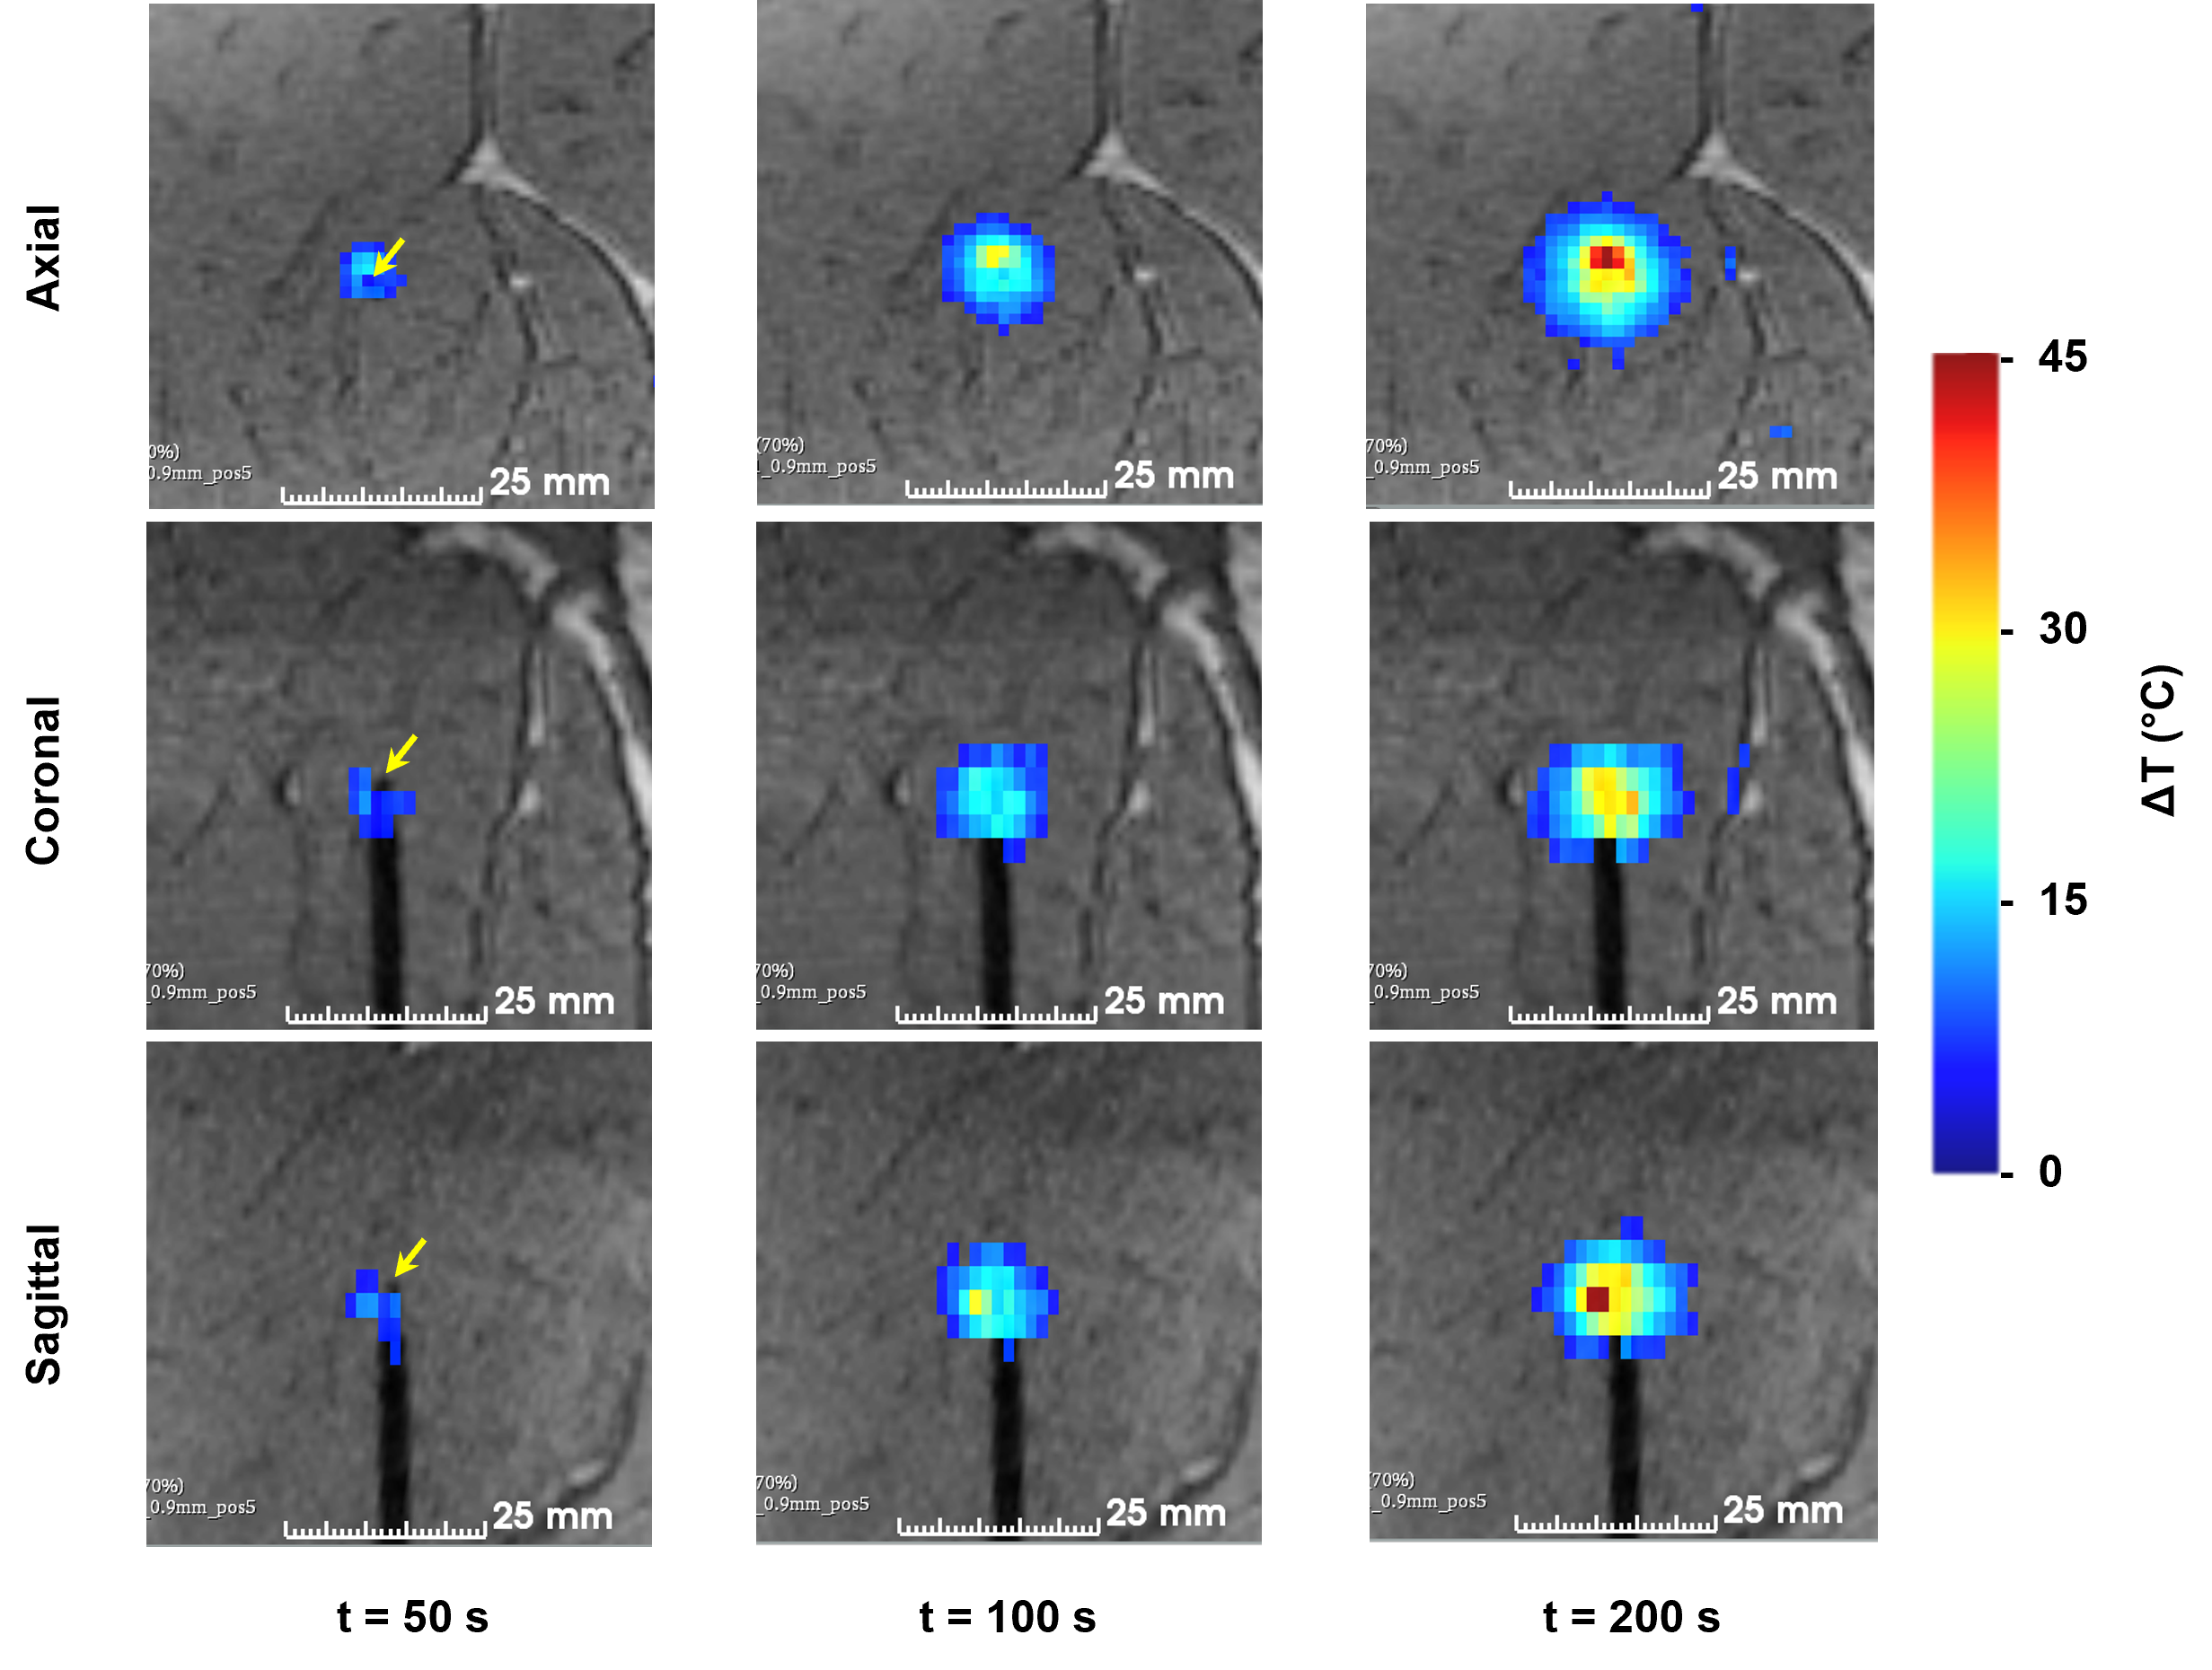
Figure 3 displays temperature maps reformatted in different orientations from the rapid volumetric thermometry pipeline, allowing online visualization of temperature evolution in 3D at an update rate of 1s for illuminating pattern #1 (only 1 fiber is activated).
Conclusion
The proposed LITT device is MR-compatible and allows creating various heating shapes that can be visualized in real-time by rapid volumetric MR-temperature/thermal dose imaging, at an update rate of 1Hz and a spatial resolution of 1.4 mmx1.4 mmx3 mm. Although light scattering and thermal diffusivity are anticipated to reduce spatial selectivity of the LITT, we demonstrate that this device allows the shape of thermal lesions to be modulated in vivo in muscle. This study illustrates the potential of such a technology for conformational tumor treatment.Acknowledgements
Stéphane Bloquet, Emilie Escurier and Virgine Loyer are gratefully acknowledged for their assistance during animal experiment. This study was conducted in the framework of the University of Bordeaux's IdEx "Investments for the Future" program RRI "IMPACT" that received financial support from the French government. This work was partly funded by research grants from Agence Nationale de la Recherche (projects CARCOI (ANR-19-CE19-0008-02) and IHU-LIRYC (ANR-10-IAHU04-LIRYC)).References
1. Bastos, D. C. de A. et al. The use of laser interstitial thermal therapy in the treatment of brain metastases: a literature review. International Journal of Hyperthermia 37, 53–60 (2020).
2. van Luijtelaar, A., Fütterer, J. J. & Bomers, J. G. Minimally invasive magnetic resonance image-guided prostate interventions. BJR (2021) doi:10.1259/bjr.20210698.
3. Patel, N. V. et al. Laser Interstitial Thermal Therapy Technology, Physics of Magnetic Resonance Imaging Thermometry, and Technical Considerations for Proper Catheter Placement During Magnetic Resonance Imaging–Guided Laser Interstitial Thermal Therapy. Neurosurgery 79, S8–S16 (2016).
4. Desclides, M. A
multi-directional laser ablation device for 3D conformational ablation guided
by real-time volumetric MR-thermometry. Int. Soc. Mag. Reson. Med. (2022).
5. Ozenne, V. et al. Improved cardiac magnetic resonance thermometry and dosimetry for monitoring lesion formation during catheter ablation. Magn. Reson. Med. 77, 673–683 (2017).
Figures