0742
Magnetization transfer ratio for characterizing extra-ocular muscles changes in myasthenia gravis: a pilot feasibility study
Qin Zhou1, Pei Chen1, Xiaoxiao Zhao1, Jing Zhao1, Mengzhu Wang2, and Zhiyun Yang1
1The first affiliated hospital of sun yat-sen university, Guangzhou, China, 2MR Scientific Marketing, Siemens Healthineers Ltd, Guangzhou, China
1The first affiliated hospital of sun yat-sen university, Guangzhou, China, 2MR Scientific Marketing, Siemens Healthineers Ltd, Guangzhou, China
Synopsis
Keywords: Muscle, CEST & MT, Myasthenia Gravis,MTR
This study looked into the feasibility of using MTI to assess the EOM morphological and pathological changes in MG. The MTR can effectively quantify fibrosis and atrophy of EOM in MG patients, which is significantly related to the poor response to medication and the long duration of the disease, implying that it can be used as a non-invasive auxiliary diagnostic tool for MG patients' prognosis evaluation.Introduction/Purpose
There is histological evidence for fat replacement, fibrosis, and atrophy of the extraocular muscle (EOM) in myasthenia gravis (MG) patients with Treatment-Resistant ophthalmoplegia1,2. In recent years, magnetization transfer (MT) magnetic resonance (MR) imaging has been used to evaluate the course of pancreatic fibrosis before surgery, identify Crohn’s fibrous and inflammatory stenosis, and evaluate the efficacy of radiotherapy and chemotherapy for rectal cancer3,4,5. These findings suggest the potential relationship between MTI and tissue fibrosis. The aim of this study is to evaluate the value of MTI for the characterization of EOM changes and the prediction of fibrosis situations in MG.Methods
We enrolled 36 MG patients with ophthalmoplegia and 26 sex- and age-matched healthy controls between September 2021 and November 2022. Patients with MG were divided into three groups according to the disease course: Group A:<1 year, Group B:1-5 years, Group C:>5 years. Patients with concurrent Graves disease or other diseases that cause EOM involvement was excluded. All subjects underwent MR examinations in a 3 Tesla MRI scanner (Magnetom PRISMA; Siemens Healthineers, Erlangen, Germany) with a 64-channel transmit-receive head-coil(INVIVO, Gainesville, FL, USA). The MTI was performed using two coronal three-dimensional gradient echo sequences with and without an off-resonance pre-pulse. The scanning parameters were: TR/TE =34 ms/6 ms, field of view=220×165 mm2, matrix= 256 × 256, bandwidth=160 Hz/Px, 16 slices, slice thickness =3 mm, voxel-size = 0.9×0.9×3.0 mm3, flip angle = 10°, and acquisition time =1:43 min. The magnetization transfer ratio (MTR) images were generated using Matlab code (R2021a Mathworks, USA). A neuroradiologist with more than 7 years of experience, blinded to the clinical data, manually measured the MTR values of the muscle belly of inferior, lateral, superior, and medial rectus muscles bilaterally in all individuals. The maximum diameters perpendicular to the long axis of these structures were measured from coronal MTI images without an off-resonance pre-pulse to obtain the four rectus muscle thicknesses. Finally, the mean values of MTR and thickness of the four rectus muscles were used for statistical analysis. The student t-test was used to explore the differences between MG and control groups, the Mann–Whitney was used to evaluate the differences between the MG subgroup, and the correlation between the MTR and thickness, as well as duration, was performed using linear regression. A p-value < 0.05 indicates a significant difference between the two groups in the statistical test.Results
The patient’s demographic and clinical characteristics are shown in Table 1. There were no statistically significant differences in age and gender between the patient and control groups. Two representative cases are shown in Figure 1. The mean MTR of EOM was higher in MG patients than in healthy controls (0.33 ± 0.28, 0.32 ± 0.27; P=0.020). (Figure 2a) The MTR of EOM in Group C (0.37±0.17)was higher than in other groups(0.32±0.13,0.34±0.08) (Figure 2b). The mean thickness of the EOM was lower in MG patients (3.81 ± 0.58 mm) than in healthy controls (4.11 ± 0.35 mm; P =0.023). (Figure 2c) The EOM thickness of MG patients with EOM palsy was negatively correlated with their disease duration (r=0.55, p=0.01). (figure 2d).Discussion
The EOM is the most easily and frequently affected site of MG, which is clinically characterized as ptosis eye movement limitation, or even treatment-resistant ophthalmoplegia caused by EOM atrophy and fibrosis6. Prognostic markers are the gold standard for predicting disease progression of ocular MG and refractory MG. However, as an invasive examination, an ocular muscle biopsy is unsuitable for monitoring the disease course. MTI, which indirectly reflects the concentration of macromolecules in tissues through MTR and other derived parameters, can evaluate the fibrosis process of various organs or diseases7. MTI was used in this study to assess the changes of MTR values in the EOM of MG patients at different disease stages and to predict the fibrosis situation. We found that the MTR values of the ocular muscle in myasthenia gravis patients were higher than that in healthy controls, indicating that there were macromolecular changes in the visual muscle in MG patients due to inflammation. We also found the EOM thickness of MG was lower than healthy controls, meaning that the EOM is atrophied. The long duration of the disease will lead to significant atrophy of the EOM in MG patients, which may result from limited eye movement. In addition, MG patients with more than five years of ophthalmoplegia have the highest MTR values of the EOM, suggesting that the fibrosis process is more common in patients with a long duration. But no significant correlation was found between the MTR values and the disease duration. The fat composition may affect the MTR values due to the simultaneous occurrence of fat and fiber replacement in EOM. In the future, it may be necessary to include fat in the study at the same timeConclusion
MTI is an effective means to monitor the morphological and pathological changes of MG extraocular muscles, which may be helpful for clinical decision-making, especially for causal pharmacotherapies, because it can directly display the integrity of muscle tissue in vivo.Acknowledgements
We thank all patients and healthy controls for their willingness to participate in the present study.References
1. Hoogenraad TU , Jennekens FGI , Tan KEWP . Ophthalmoplegia due to myasthenia gravis Histological and histochemical observations in the inferior oblique muscle. Neurogenetics and Neuro-Ophthalmology, 5th International Congress, Nijmegen. The Netherlands: Springer; 1979. p. 27–34. 2. Europa TA, Nel M, Heckmann JM. A review of the histopathological findings in myasthenia gravis: Clues to the pathogenesis of treatment-resistance in extraocular muscles. Neuromuscul Disord. 2019 May;29(5):381-387. 3.Schawkat K, Eshmuminov D, Lenggenhager D, et al.Preoperative evaluation of pancreatic fibrosis and lipomatosis: correlation of magnetic resonance findings with histology using magnetization transfer imaging and multigradient echo magnetic resonance imaging[J]. Invest Radiol, 2018, 53(12): 720‑727. 4. Li XH, Mao R, Huang SY, et al. Characterization of degree of intestinal fibrosis in patients with Crohn disease by using magnetization transfer MR imaging[J]. Radiology,2018, 287(2): 494‑503. 5. Martens MH, Lambregts DM, Papanikolaou N, et al.Magnetization transfer ratio: a potential biomarker for the assessment of postradiation fibrosis in patients with rectal cancer[J]. Invest Radiol, 2014, 49(1): 29‑34. 6. Rautenbach RM, Pillay K, Murray ADN, Heckmann JM. Extraocular muscle findings in myasthenia gravis associated treatment-resistant ophthalmoplegia: a case report. J Neuro-ophthalmol 2017;37:414–17. 7. Henkelman RM, Stanisz GJ, Graham SJ. Magnetization transfer in MRI: a review[J]. NMR Biomed, 2001, 14(2):57‑64. DOI: 10.1002/nbm.683.Figures
Table
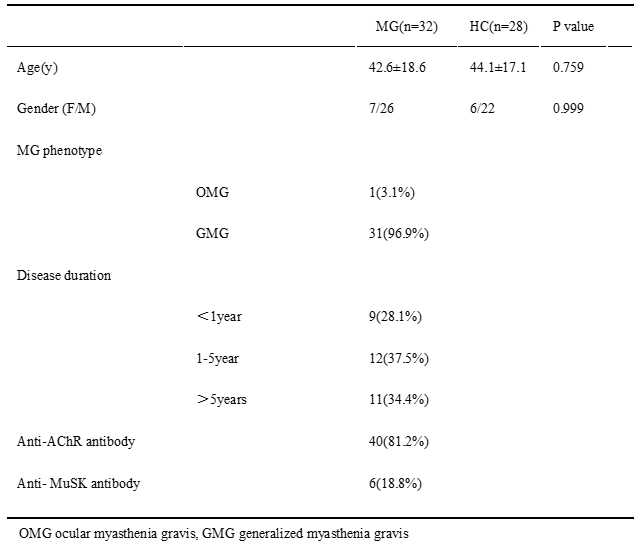
1 The demographic and clinical characteristics of MG patients (MG) and health controls
(HC)
Figure
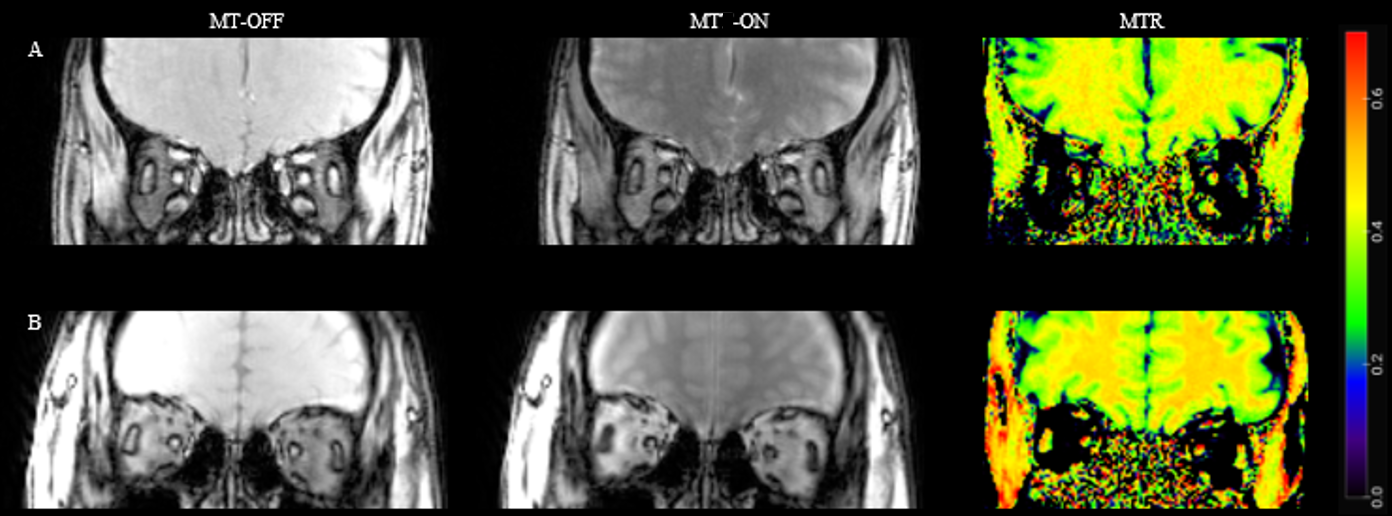
1 Magnetization transfer ratio (MTR) maps of (A) a 27-year-old female MG
patient, the ptosis and ophthalmoparesis onset for 10 years, and (B) a healthy
control. Take note of the significant increase in EOM MTR as well as the
obvious atrophy of EOM in the MG patient.
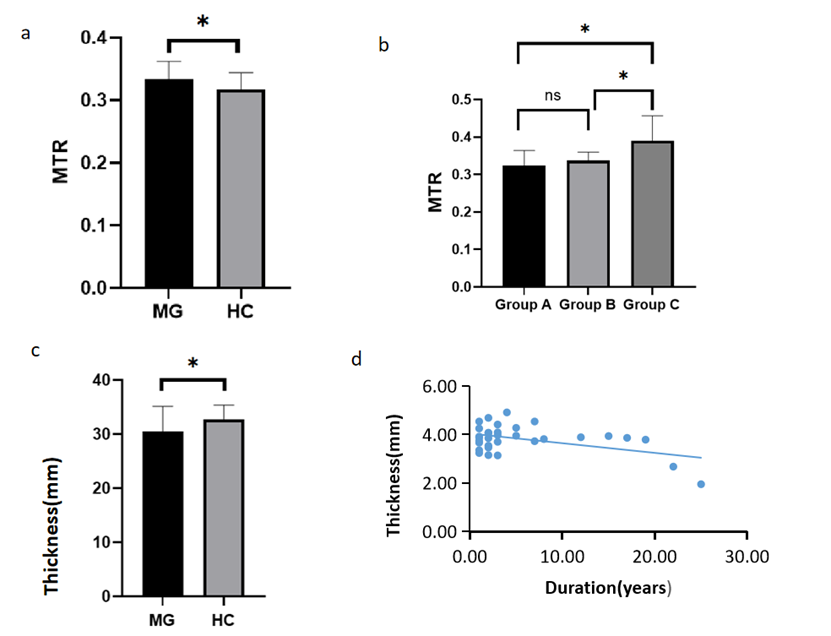
Figure2
a Comparison of the mean MTR of EOMs between the MG and control groups. MTR is higher in MG patients.
b Comparison of the mean MTR of EOMs among the subgroups of MG. EOM MTR was markedly increased in group C.
C Comparison of the mean thickness of EOM between MG and the control groups. There were statistically significant differences in the mean thickness between the two groups.
d Scatter plot shows a positive correlation between the disease duration and mean muscle thickness of MG patients (r = -0.55, p=0.01). (For p values: *p < 0.05, ns non-significant.)
DOI: https://doi.org/10.58530/2023/0742