0741
Interleaved BOLD and 31P-MRS examination of working human upper arm muscles1Radiology and Nuclear Medicine, University of Amsterdam, Amsterdam Movement Sciences, Amsterdam UMC, Amsterdam, Netherlands, 2Center for Child Development, Exercise and Physical Literacy, Wilhelmina Children’s Hospital/Division of Child Health, University Medical Center Utrecht, Utrecht, Netherlands, 3Biomedical Engineering and Physics, University of Amsterdam, Amsterdam Movement Sciences, Amsterdam UMC, Amsterdam, Netherlands
Synopsis
Keywords: Muscle, Metabolism, capillary function
Phosphorous (31P) MRS is frequently used to study alterations in muscle mitochondrial function but works under the assumption that exercise triggers sufficient changes in perfusion to allow for delivery oxygen and energy substrates to the tissue. Here, we used interleaved scanning of 31PMRS and BOLD imaging to obtain an in-debt evaluation of muscle oxidative capacity in the upper arm muscles during arm-cycling exercise. We demonstrated that similar levels of PCr depletion and PCr recovery times resulted in variable Time-To-Peaks (TTPs) and max %BOLD response while a tendency was observed between a lower end-exercise pH and longer TTP.Introduction
Phosphorous (31P) MRS is frequently used to non-invasively study alterations in mitochondrial function of healthy and diseased skeletal muscle [1-3]. A limitation of this measurement technique is that it works under the assumption that exercise triggers sufficient changes in perfusion to allow for delivery of the required amount of oxygen and energy substrates to the muscle tissue [4], which may not always be the case in diseased tissue. To overcome this, some groups introduced simultaneous assessment of both capillary and mitochondrial function, using interleaved scanning, which allows for an in-debt evaluation of muscle oxidative capacity. So far, these technologies have been used at rest and during, mostly single-leg, exercise-rest paradigms [4-7]. However, these protocols may not relate to realistic exercise paradigms or challenge vascular supply sufficiently to assess muscle oxidative capacity [8-9]. A dynamic exercise plat-form that challenges the cardiovascular system, preferably in a functionally relevant setting, is required. In this study, we report on the implementation of a novel MR platform for in-debt in-vivo examination of oxidative capacity of working human upper arm muscles in response to arm-cycling exercise.Methods
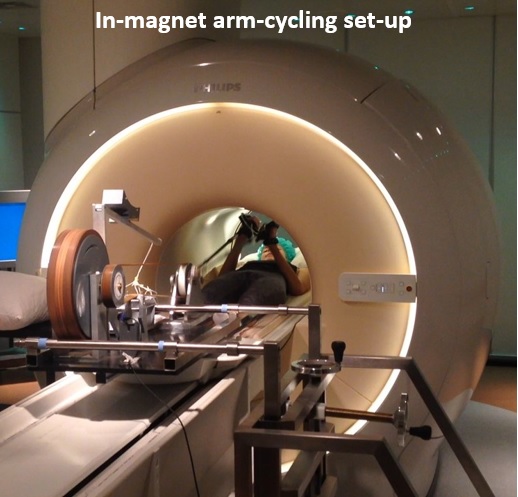
MR datasets were acquired in the right upper arm of 6 healthy participants (age range: 23-50 yrs. 3 male) on a 3T MR system (Ingenia, Philips Best, The Netherlands) using a previous described MR-compatible ergometer [10] and a 6-cm diameter single loop 31P surface coil (Rapid) fastened under the Triceps Brachii muscle. The MR examination consisted of a scout image to localize the arm and guide shimming and a time-resolved interleaved pulse acquire 31P MRS sequence (Adiabatic pulse; TR/TE: 1000/0.1ms; 2nd order shimming) and multi-echo T2* acquisition (Axial slice 10mm; FOV 480x276; Acq matrix 160*92, 15 echoes; TR 27ms; TE/ΔTE 1.1/1.78ms; Flip Angle 15°) to simultaneous measure capillary and mitochondrial function in rest, during in-magnet arm cycling and during subsequent recovery at a temporal resolution of 3.8 seconds. Subjects were positioned supine head-first on the patient bed, the upper arm fixed to the bed, supported with sandbags and the elbow positioned in a 90° angle. After 30 seconds of rest, subjects were instructed to perform arm-cycling until exhaustion at 15W; thereafter recovery was mapped.Data-processing and analysis
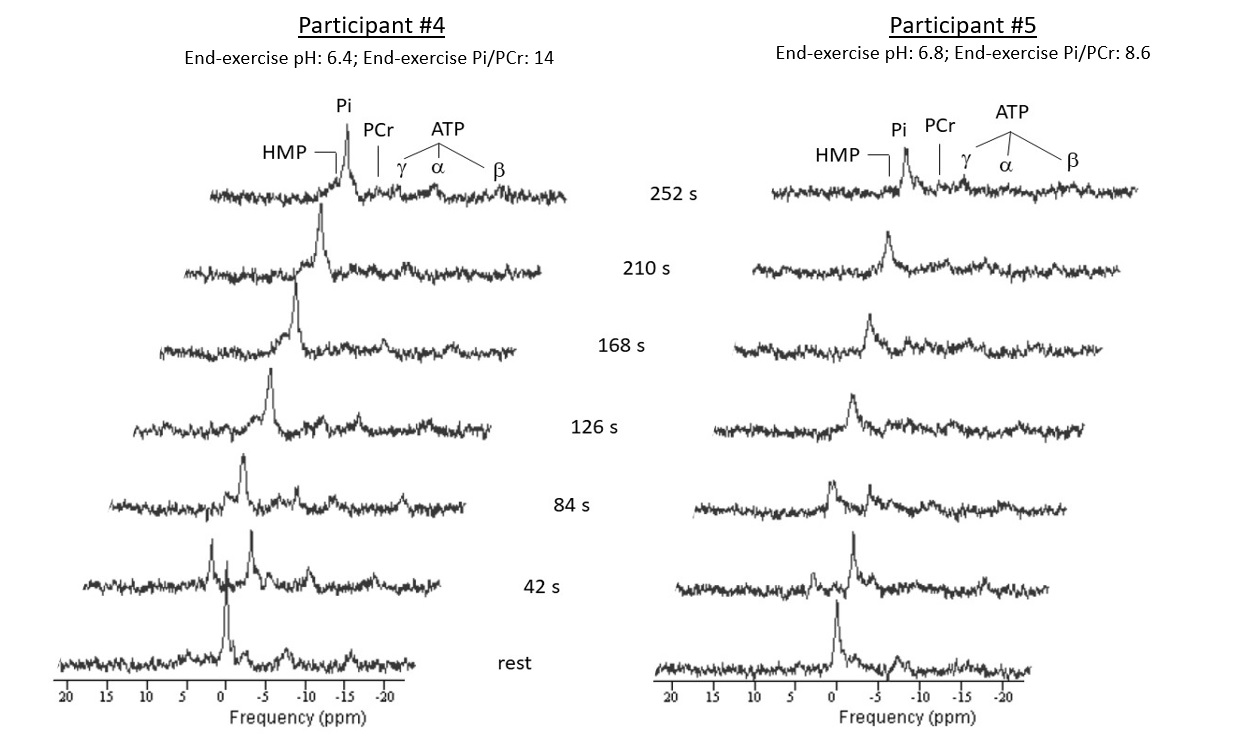
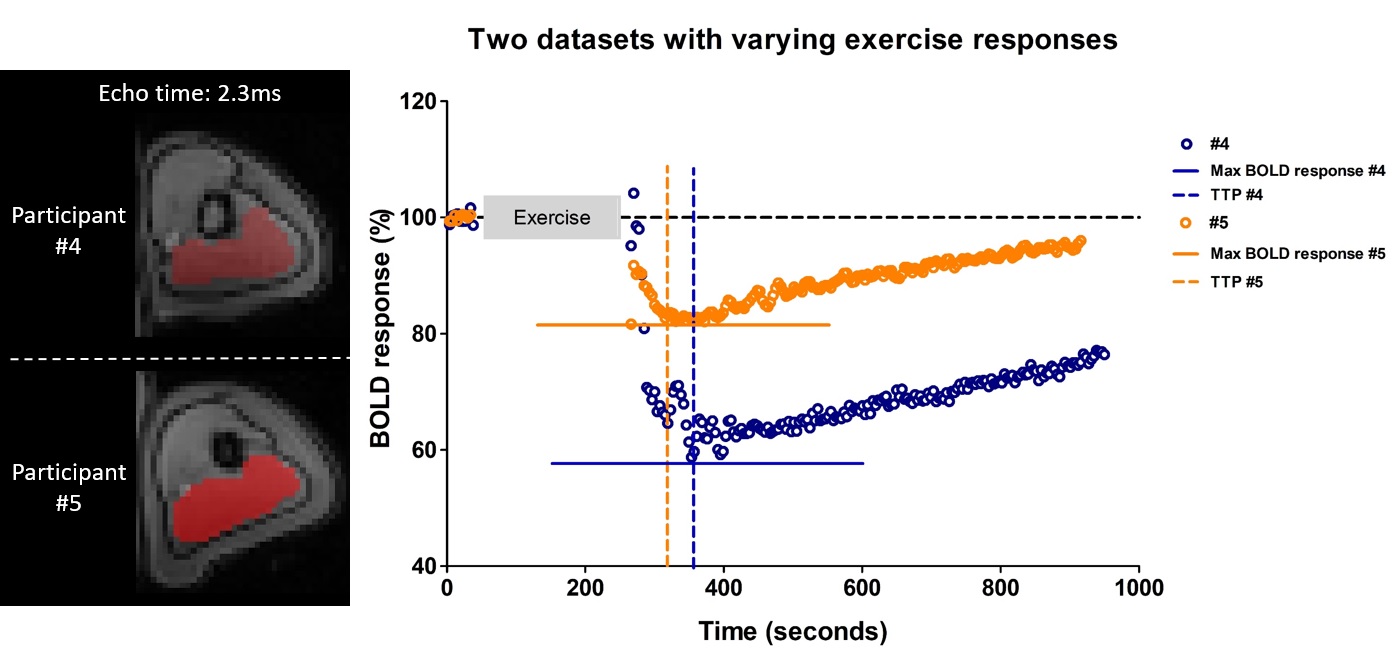
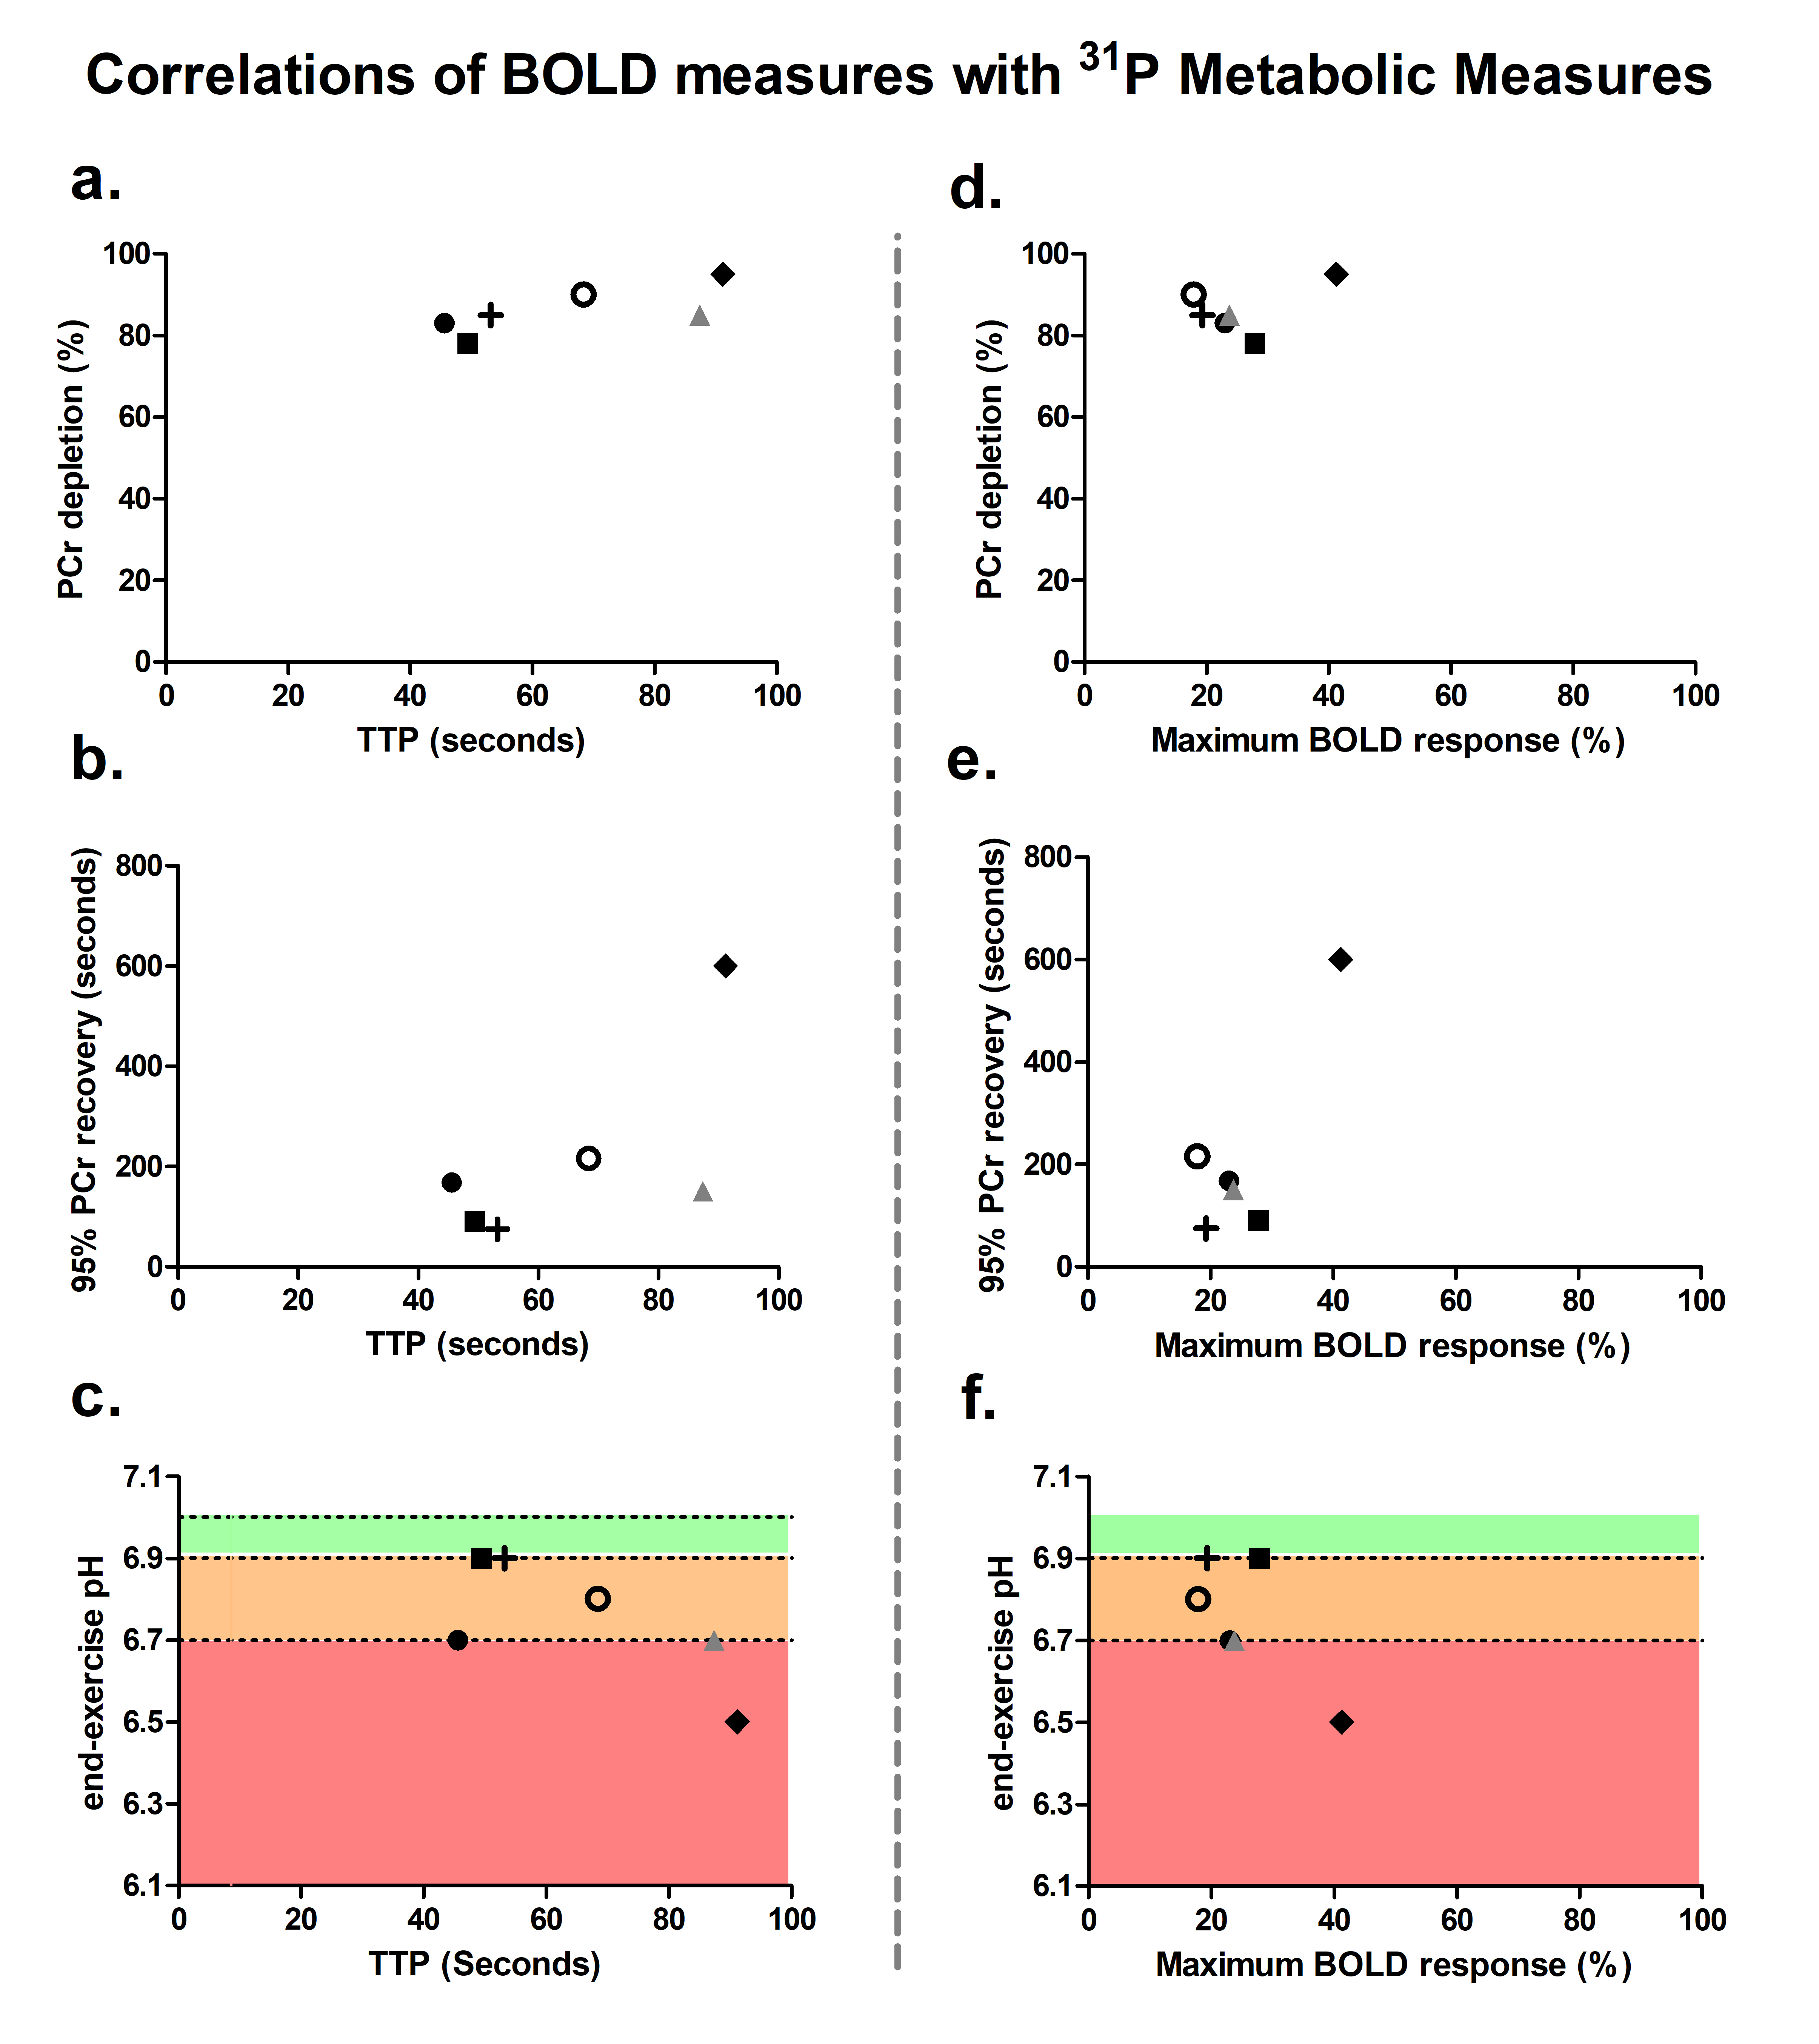
High-energy phosphate metabolism was assessed by quantitative evaluation of 31P-MRS data. FIDs were analyzed using AMARES time domain fitting in jMRUI [11] using customized prior knowledge files [1]. Level of PCr depletion, end-exercise pH, end-exercise Pi/PCr and 95% RT of PCr were calculated and used as 31P metabolic measures [1]. Tissue oxygenation dynamics were evaluated through characterization of the BOLD-response in R2* maps of the upper arm muscles. R2* maps were calculated from the multi-echo images using vendor specific mono-exponential fitting routine. Regions of interest were manually drawn on the first echo of the multi-echo gradient echo acquisition for the Triceps Brachii muscle using ITK-SNAP [12]. The R2* values were normalized per ROI and time point to baseline (average R2* over first 10 time points) and a moving filter with the span of 3 time points was applied. The R2* values during rest, exercise and recovery are visualized by plotting against time. From the time-curves the maximal level of BOLD response (%) and the time-to-peak (TTP) in seconds was determined. Spearman correlation was used to determine the relation between TTP and maximum level of BOLD response with 31P metabolic measures (p≤0.05).Results
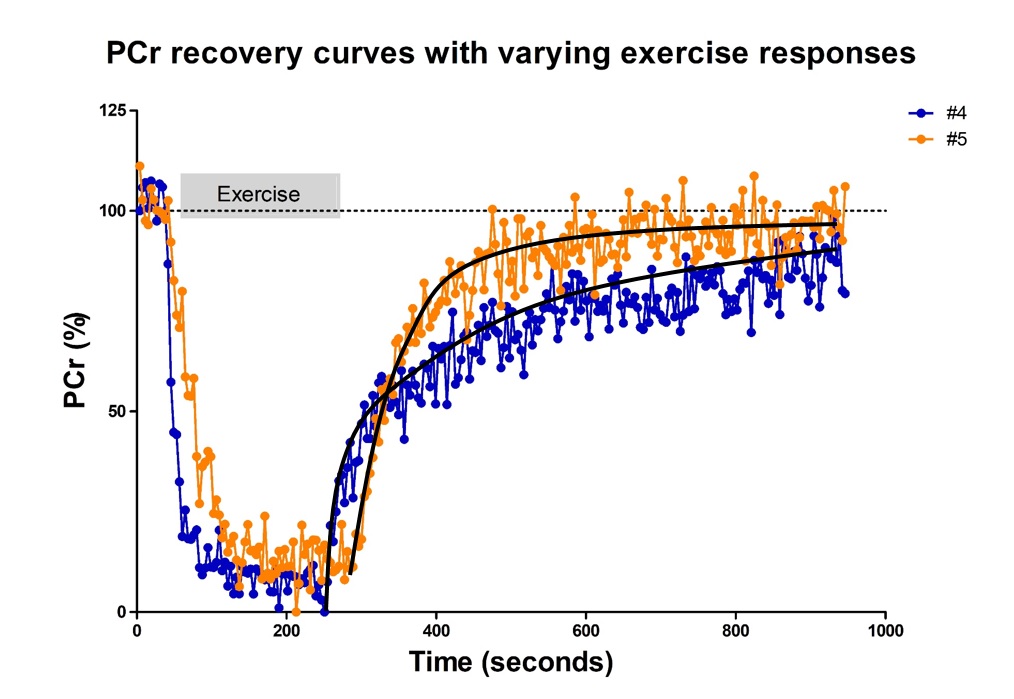
All interleaved MR datasets were successfully acquired using this unique MR platform (Figure 1), resulting in good-quality energetics (Figure 2), PCr recovery (Figure 3) and BOLD response datasets (Figure 4). Analysis of the pre and post-exercise PCr and BOLD response time-curves demonstrated high variability between the participants; visualized by two examples (Figure 2-4). For all participants, the average TTP ranged between 46 and 91.2s, maximum level of BOLD response ranged between 17.8 and 41.3%, PCr depletion ranged between 80 and 95%, RT95% ranged between 76 - 600 seconds; end-exercise Pi/PCr ranged between 1.4 and 14 and end-exercise pH ranged between 6.5 and 6.9. No significant correlations were found between TTP or max BOLD response with the 31P metabolic measures (Figure 5) A tendency was observed between end-exercise pH and TTP (Figure 5c).Discussion and conclusion
This study tested and demonstrates feasibility of simultaneous collection of comprehensive datasets on muscle energetics and oxygenation during and after dynamic arm-cycling exercise with high temporal resolution (3.8 seconds) for integral evaluation of muscular oxidative metabolic performance. Our results for both 31P MRS and BOLD state variables are in good agreement with previously reported work in healthy individuals [7,14-15]. In all subjects with >80% PCr depletion during exercise, indicative of near-complete motor-unit recruitment, post-exercise TTP varied substantially while small variations maximal were seen in BOLD response. Post-exercise PCr recovery kinetics did not appear to be predictive of the magnitude of the BOLD response in agreement with previous work [4] (but see [14]). Some correlative tendency was observed for parameters end-exercise pH and post-exercise TTP suggesting that the BOLD response may in part be driven by changes in concentrations and osmolality [16].Acknowledgements
This work was supported by grant from NWO-AES.References
[1] Habets LE, Bartels B Asselman F et al. Magnetic resonance reveals mitochondrial dysfunction and muscle remodeling in spinal muscular atrophy. Brain. 2022 May 24;(145(4):1422-1435. Doi: 10.1093/brain/awab411.
[2] Fleischman A, Makimura H, Stanley TL, et al. Skeletal muscle phosphocreatine recovery after submaximal exercise in children and young and middle-aged adults. J Clin Endocrinol Metab. 2010, 95;E69-74
[3] Phielix E, Schrauwen-hinderling VB, Mensink M, et al. Lower intrinsic ADP-stimulated mitochondrial respiration in human calf muscles during ischaemic recovery. Biochem J. 2008. 291;681-686
[4] Wary C, Nadaj-Pakleza A, Laforêt P, et al. Investigating glycogenosis type III patients with multi-parametric functional NMR imaging and spectroscopy. Neuromuscul Disord. 2010 Aug;20(8):548-58.
[5] Wray DW, Nishiyama SK, Monnet A, et al. Multiparametric NMR-based assessment of skeletal muscle perfusion and metabolism during exercise in elderly persons: preliminary findings. J Gerontol A Biol Sci Med Sci. 2009 Sep;64(9):968-74.
[6] Schewzow K, Fiedler GB, Meyerspeer M, et al. Dynamic ASL and T2-weighted MRI in exercising calf muscle at 7 T: a feasibility study. Magn Reson Med. 2015 Mar;73(3):1190-5.
[7] Bakermans AJ, Bazil JN, Nederveen AJ, et al. Human Cardiac 31P-MR Spectroscopy at 3 Tesla Cannot Detect Failing Myocardial Energy Homeostasis during Exercise. Front Physiol. 2017 Nov 27;8:939.
[8] Lewis SF, Taylor WF, Graham RM, et al. Cardiovascular responses to exercise as functions of absolute and relative work load. J Appl Physiol Respir Environ Exerc Physiol. 1983 May;54(5):1314-23.
[9] Bezucha GR, Lenser MC, Hanson PG, Nagle FJ. Comparison of hemodynamic responses to static and dynamic exercise. J Appl Physiol Respir Environ Exerc Physiol. 1982 Dec;53(6):1589-93
[10] Vegter RJ, van den Brink S, Mouton IJ, et al MR-compatible arm-crank ergometry: a new platform linking whole body calimo, biomechanics and arm muscle metabolism. Front Physiology. 2021; 12:5995
[11] Stefan D, Cesare FDi, Andrasescu A, et al.Quantitation of magnetic resonance spectroscopy signals:the jMRUI software package. Meas Sci Technol; 2009; 20:1–9.
[12] Paul A. Yushkevich, Joseph Piven, Heather Cody Hazlett, et al. User-guided 3D active contour segmentation of anatomical structures: Significantly improved efficiency and reliability. Neuroimage 2006 Jul 1;31(3):1116-28.
[13] VandenBorne K, McCully K, Kakihira H et al. Metabolic heterogeneity in human calf muscle during maximal exercise. PNAS
[14] Schmid AI, Schewzow K, Fieler GB, et al. Exercising calf muscle T2* changes correlates with pH, PCr recovery and maximum oxidative phosphorylation.
[15] Boss A, Heskamp L, Breukels V, et al. Oxidative Capacity varies along the length of healthy Human tibialis anterior muscle. J physiol 2018.
[16] Prompers JJ, Jeneson JA, Drost MR. Dynamic MRS and MRI of skeletal muscle function and biomechanics. NMR in Biomed. 2006; 19: 927-953
Figures