0740
Fat fraction dependent decrease of muscle 1H2O T2 in Duchenne muscular dystrophy is steeper in patients with faster disease progression1Biomedical Engineering, Oregon Health & Science University, Portland, OR, United States, 2University of Florida, Gainesville, FL, United States, 3Oregon Health & Science University, Portland, OR, United States
Synopsis
Keywords: Muscle, Relaxometry
Fatty tissue replacement of muscle is characteristic of disease progression in Duchenne muscular dystrophy (DMD), and correlates with a decrease in muscle 1H2O T2. We report longitudinal analysis of MRS data from 86 subjects with DMD. We detect a significant effect of μ (age at 50% fat-fraction) on the slope of T2 by FF. The effect of μ on slope is a consequence of lower T2 at high FF in early progressing subjects, not an effect of T2 differences at low FF. The slope of muscle water T2 decline with FF may contain additional information related to pathology in DMD.Introduction
There is growing research interest in the relaxation behavior of water in muscle tissue, particularly in muscular dystrophies. The finding of decreasing 1H2O T2 with advancing fat fraction (FF) in Duchenne muscular dystrophy (DMD) by Forbes, et. al.1 has since been corroborated by other research teams and applied to other muscle diseases.2,3,4While cross-sectional analysis has readily detected this effect, there are important questions that are more accessible with longitudinal data. Here we report on a retrospective analysis of 86 participants with DMD, applying previously determined progression trajectories for each subject by Rooney, et. al.5 The trajectory model has two parameters for each subject, age at 50% FF (μ), and parameter σ which is inversely proportional to the rate of progression. Here we use μ as an index of progression: participants with smaller μ value accumulate fat in muscle at an earlier age, whereas subjects with larger μ have a slower course of FF progression.
The aims of this study were: (1) to determine the extent of 1H2O T2 decline with muscle FF in a large cohort of individuals with DMD, (2) to investigate the association between 1H2O T2 and disease progression in DMD.
Methods
Single-voxel MRS data were acquired from 172 male participants with DMD. Of those, 86 subjects had 3 or more timepoints and reached a FF > 30% by their latest timepoint, and were included in the present analysis. Data were collected on 3T MRI systems at three institutions. A STEAM pulse sequence with 16 TE values was used to generate spectroscopic relaxometry datasets (TE range: 11 - 243ms, TR = 9.0s, 4-averages). As part of a ImagingNMD processing pipeline at the University of Florida, 1H2O T2 was fit with spectral integration over a fixed frequency interval. Progression trajectories were calculated with non-linear mixed effects modeling as previously described5. Statistical analysis and visualization were conducted in Python, using statsmodels ordinary least squares regression. The individual slope for each subject (1H2O T2 versus FF) was calculated with ordinary-least-squares regression.Results and Discussion
In Figure 1 is plotted 1H2O T2 as a function of FF for 86 DMD individuals showing a linear decline of 1H2O T2 with increasing FF. The population average slope is -4.1 ms/FF with substantial variability between individuals (confidence interval between -20 ms/FF and +10 ms/FF at μ = 10). Keene and colleagues also observed a decline, albeit somewhat steeper, using a multi-spin echo MRI measurement with a two-component extended phase graph (EPG) algorithm2.To investigate the association between 1H2O T2 change and DMD progression rate, individual 1H2O T2 vs FF slopes are plotted against the age at which VL and Sol reaches its 50% change in FF (μ)5. We find a significant positive association indicating that individuals with higher rates of progression (smaller μ values) tend to have sharper declines in 1H2O T2 with FF (Figure 2). To investigate the influence of elevated 1H2O T2 prior to fat infiltrate (as a marker of inflammation) and 1H2O T2 at complete fat infiltration we performed regression of the extrapolated intercepts against m (Figure 3).
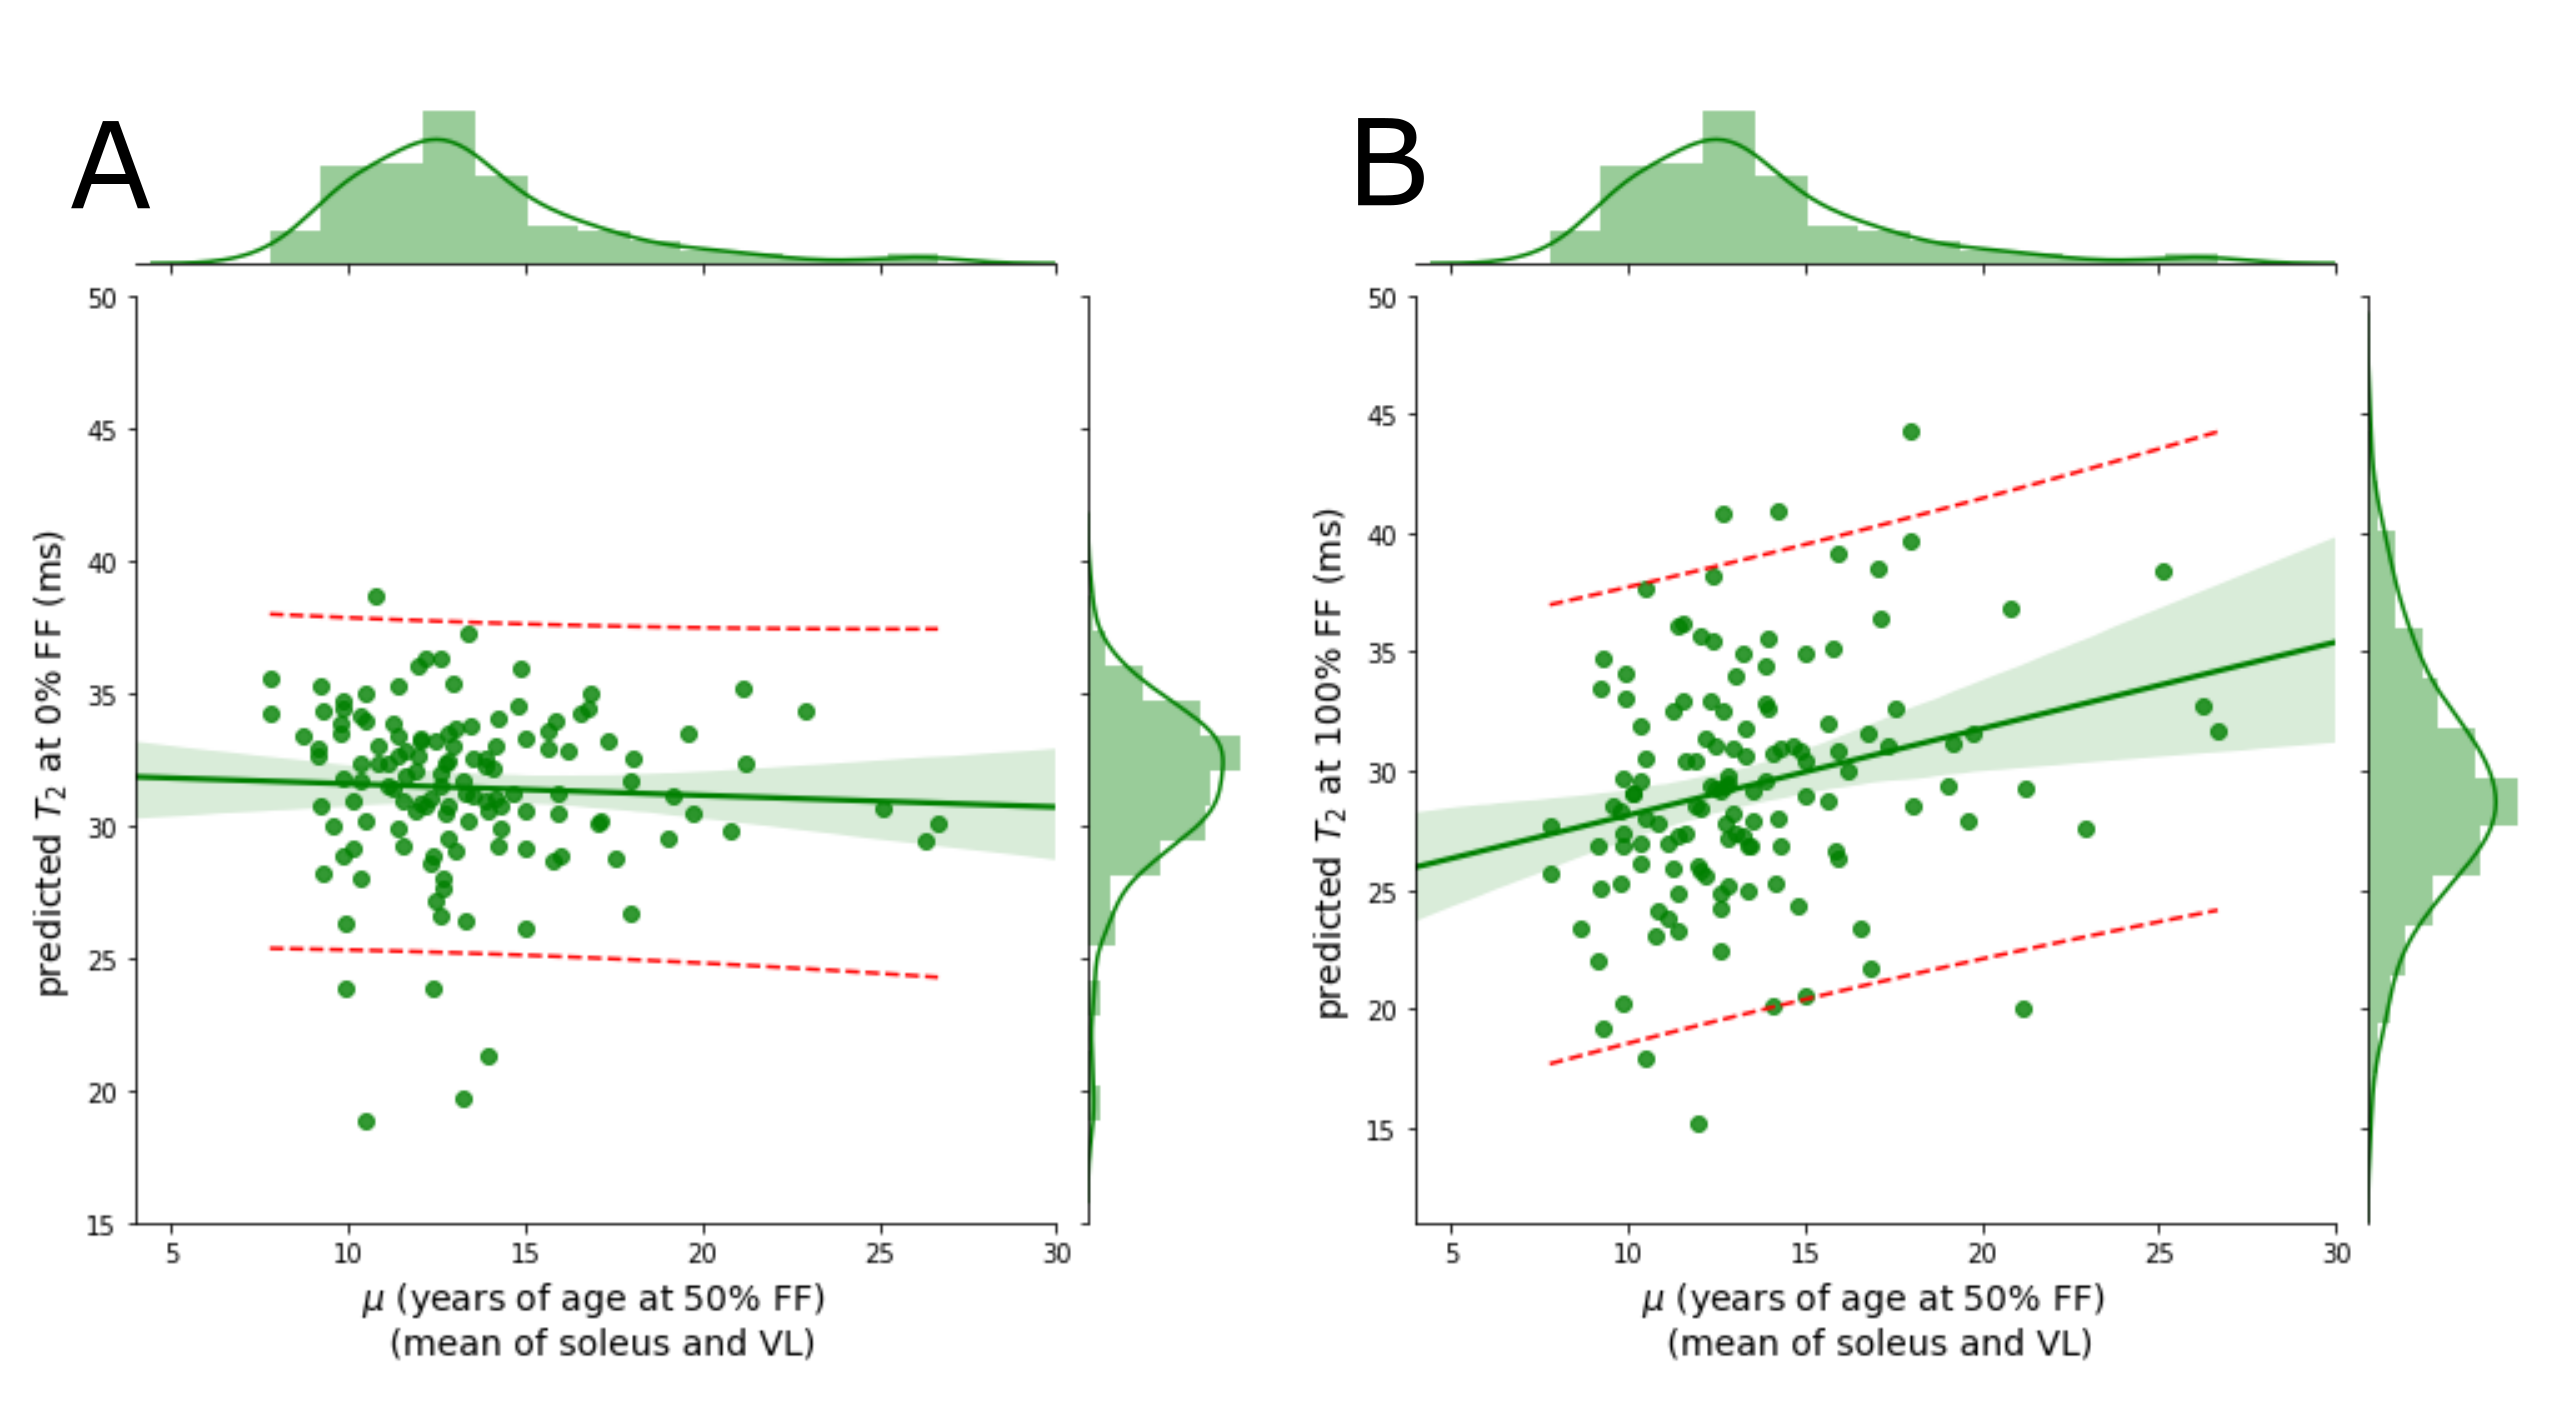
From this analysis we find that the value of 1H2O T2 at high FF rather than low FF better explains the steeper decline of 1H2O T2 with FF in DMD. If we interpret elevated 1H2O T2 prior to fat deposition as inflammation, this suggests that DMD fat deposition is independent of initial inflammation. If we interpret decreased 1H2O T2 as a marker of fibrosis, this suggests that faster DMD fat deposition is possibly associated with higher levels of fibrotic infiltrate.
Acknowledgements
Funding provided in part by:
NIH R01AR056973
References
1. Forbes, S. C. et al. Magnetic Resonance Imaging and Spectroscopy Assessment of Lower Extremity Skeletal Muscles in Boys with Duchenne Muscular Dystrophy: A Multicenter Cross Sectional Study. PLoS ONE 9, e106435 (2014).
2. Keene, K. R. et al. T 2 relaxation‐time mapping in healthy and diseased skeletal muscle using extended phase graph algorithms. Magn Reson Med 84, 2656–2670 (2020).
3. Schlaeger, S. et al. Water T 2 Mapping in Fatty Infiltrated Thigh Muscles of Patients With Neuromuscular Diseases Using a T 2 ‐Prepared 3D Turbo Spin Echo With SPAIR. J Magn Reson Imaging 51, 1727–1736 (2020).
4. Schlaeger, S. et al. Beyond mean value analysis – a voxel‐based analysis of the quantitative MR biomarker water T 2 in the presence of fatty infiltration in skeletal muscle tissue of patients with neuromuscular diseases. NMR in Biomedicine (2022) doi:10.1002/nbm.4805.
5. Rooney, W. D. et al. Modeling disease trajectory in Duchenne muscular dystrophy. Neurology 94, e1622–e1633 (2020).
Figures
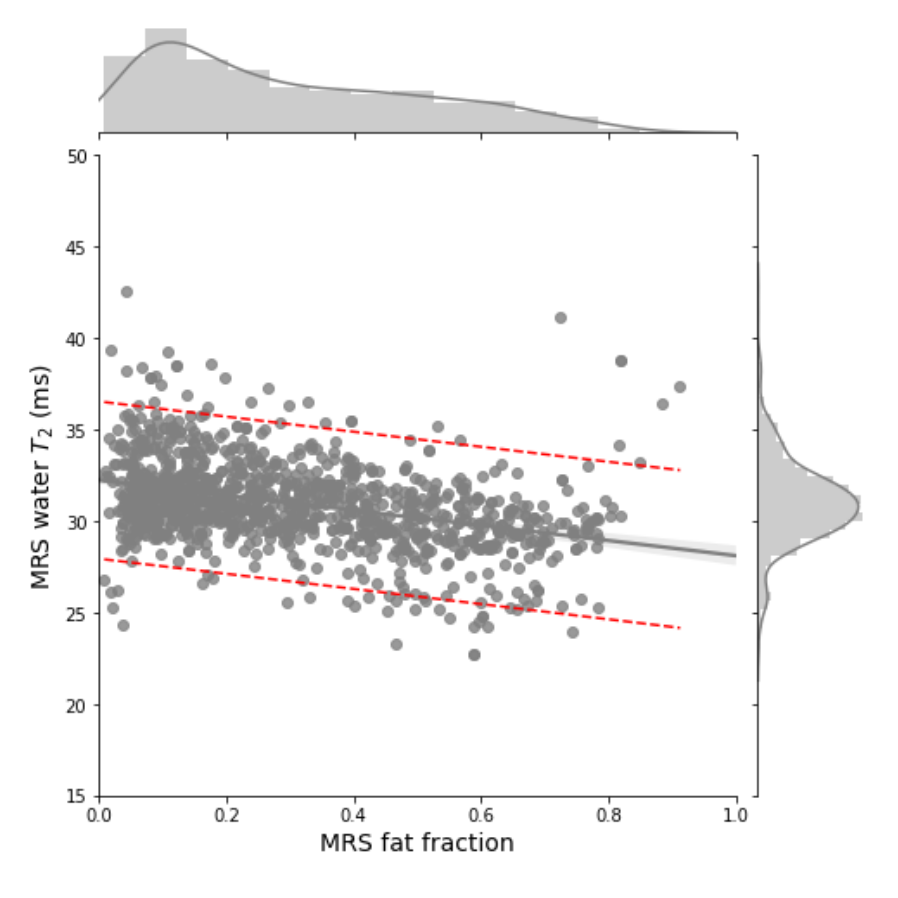
Soleus and VL MRS T2 values regressed against MRS fat fraction. All Soleus and VL observations for 86 participants with 3 or more timepoints. The plot displays the general trend of decreasing water T2 with increasing FF.
The 95% confidence interval of the gray regression line is shaded. The 95% confidence interval of the model prediction is denoted by the red dashed lines.
Number of observations: 1136, Adj. R2: 0.135, F-statistic: 178.7, P = 5.79e-38. Linear model: Water T2 = 32.2343 – 4.1280 ∙ (FF)
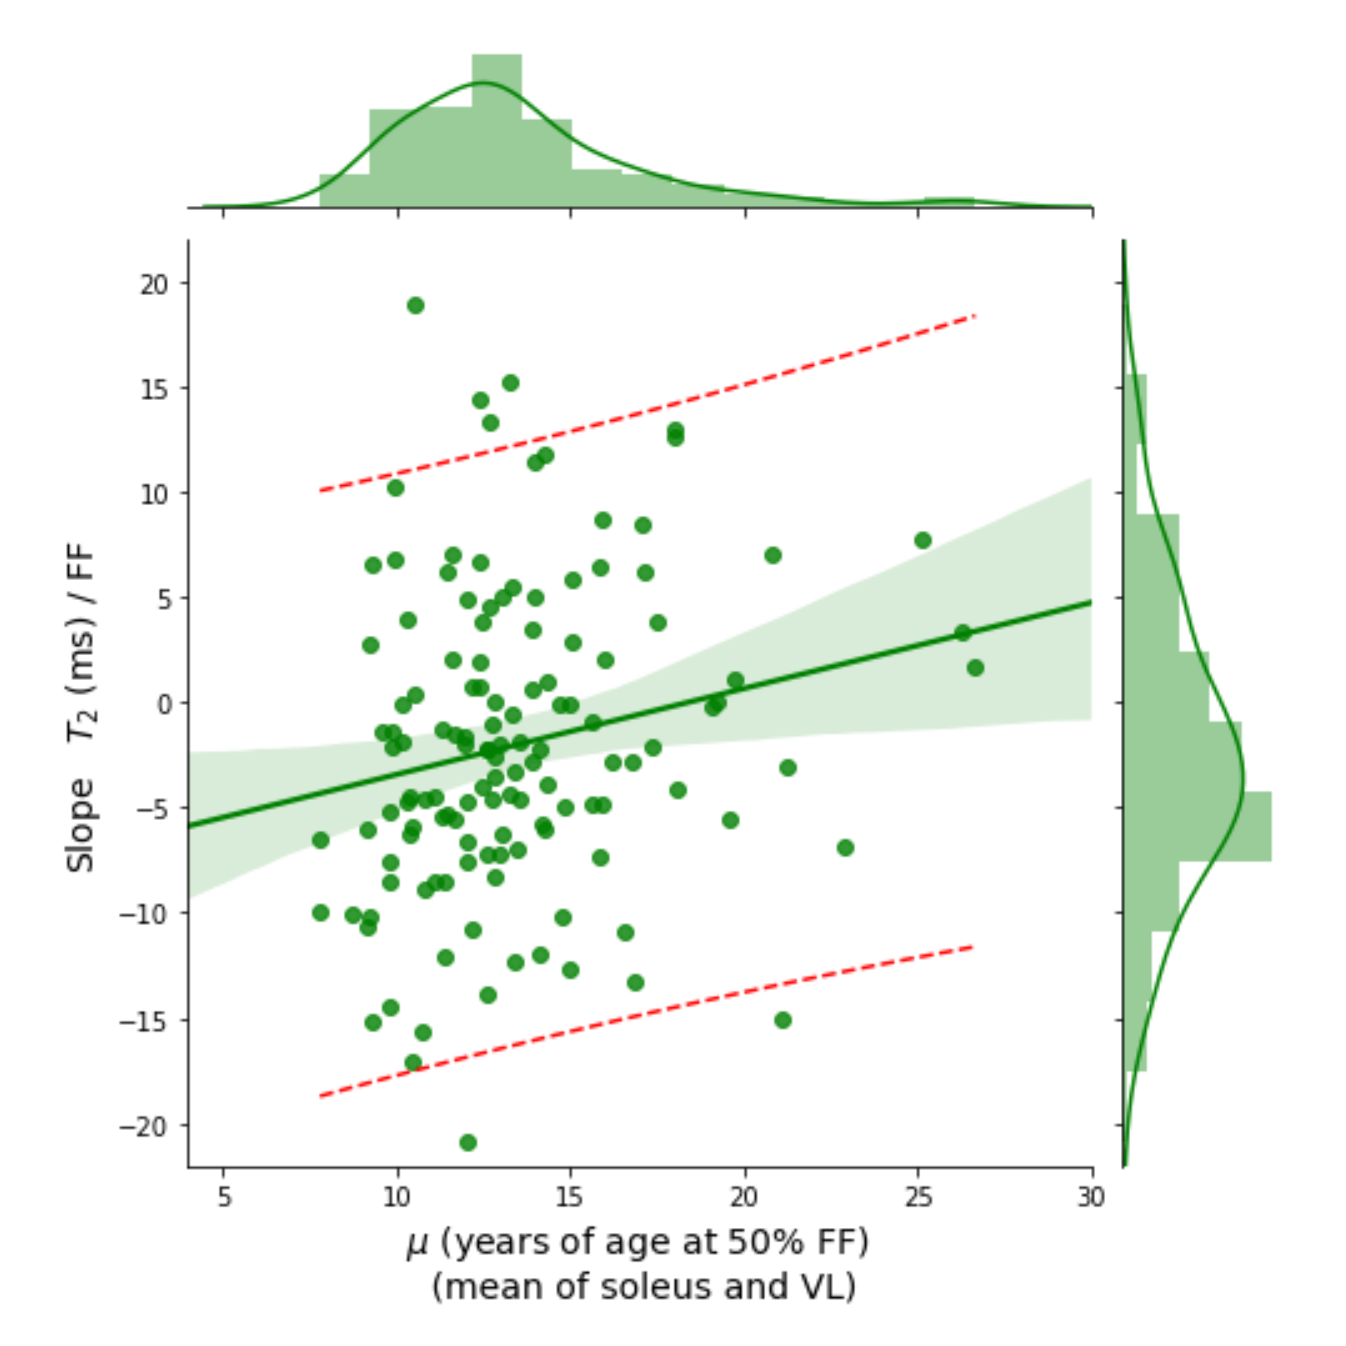
Within-subjects linear regression of water T2 by FF yielded an individual slope estimate for each subject. These slopes are plotted here on the vertical axis and regressed against μ, the age at which the mean FF in soleus and VL muscles is expected to reach 50%.
The positive slope of the regression model indicates steeper dependence of water T2 on FF for subjects that with faster disease progression measured by FF.
Number of observations: 131, Adj. R2: 0.031, F-statistic: 5.225, P = 0.0239. Linear model: Slope (T2 by FF) = -7.5193 + 0.4085 ∙ μ