0738
Multi-parametric ageing study on 51 subjects in the lower leg by 1H water T1 MR fingerprinting, multi-compartment water T2, fat fraction and 31P MRS1NMR Laboratory , Neuromuscular Investigation Center, Institute of Myology, Paris Cedex 13, France
Synopsis
Keywords: Muscle, Aging, Multi-contrast, Relaxometry, MR Fingerprinting
Aging is a multi-factorial process and studies in the lower leg are scarce. We performed a multi-contrast protocol in 51 volunteers from 20 to 81 y.o. We found an age-related increase of muscle water T1(water-fat separation,MR fingerprinting), fat fraction, water T2 and T2 heterogeneity in the anterior and posterior compartments. Phosphodiesters and mitochondrial stress biomarkers also increased with age. Through bi-compartment water T2 CPMG measures, age-related increases of the long water T2 relative fraction were observed relative to the short water T2 (T2-H2O-CPMG-short) fraction, but T2-H2O-CPMG-short values were unaltered with age, suggesting inflammation with preservation of the intracellular water compartment.Introduction
The progressive decline in muscle mass, strength and performance during ageing negatively affects the quality of life in the elderly and increases the risk of falls, disability and frailty. This decline is a multifactorial process whose mechanisms are incompletely understood. NMR allows evaluating anatomical, structural and physiological aspects of muscle tissue which could provide relevant biomarkers to evaluate muscle ageing non-invasively and early biomarkers for age-related muscle degeneration. Contrary to the quadriceps, ageing studies on muscle water T2 (T2-H2O-MRI), fat fraction (FF), intracellular acidity and phosphodiester (PDE) relative are scarce in the lower leg1-3. Multi-compartment T2 and water T1 (T1-H2O) measurements have demonstrated their interest in neuromuscular diseases4,5 but have not yet been evaluated in the context of ageing. Here, we evaluated the effect of aging on muscle T1-H2O, T2-H2O-MRI and T2 heterogeneity (ΔT2-H2O-MRI), FF and cross-sectional area (CSA) in the lower leg. Multi-compartment water T2 CPMG (T2-H2O-CPMG) measures in the gastrocnemius and 31P MRS in the calf were also performed.Methods
Experimental SetupExperiments were done at 3T (Siemens Prisma) on 51 healthy subjects (20 to 81 y.o.). The RF coil used (RAPID Biomedical) combined a 1H birdcage transmitter, a 1H 18Rx phased-array receiver and a 31P 1Tx/3Rx semi-cylindrical transceiver.
NMR measures
MRI
FF was measured using a 3-point Dixon method (3D GRE, TEs=2.75/3.95/7.55 ms, TR=10 ms, FA=3°, 48 slices, 1x1x5 mm3 resolution). T2-weighted images were measured using a multi-spin-echo sequence (17 echoes, TE1/ΔTE=9.5 ms, TR=3 s, 5 slices, 10 mm thickness, 1.3x1.3 mm² in-plane resolution) and T2-H2O-MRI maps were estimated with a tri-exponential fitting procedure6. A MRF T1-FF sequence was employed (radial encoding, 1400 spokes train, 5 slices, 10 mm thickness, 1.4x1.4 mm² in-plane resolution) to generate T1-H2O maps using a bi-component model7. Manual segmentation was done for individual muscles on 3 slices of the multi-spin-echo data.
Multi-compartment T2
An ISIS-CPMG sequence with fat suppression was used to measure the water T2 decay8 (150 echoes, 2.5 ms inter-echo spacing, 35x35x35 mm3 voxel size, TR=9 s). T2-H2O-CPMG times and their relative fractions were estimated using a non-negative least squares algorithm8 (480 ms upper limit). A short (<50 ms) and a long (>50 ms) T2-H2O-CPMG component are reported.
31P MRS
A pulse-acquire sequence was used (3 kHz bandwidth, 2048 complex points, TR=4 s, 64 averages). Spectral analysis was done using jMRUI (v5.2), AMARES and TopSpin (Bruker Medical) as described elsewhere9. Phosphocreatine (PCr), inorganic phosphate (Pi), PDE, phosphomonoesters (PME) and the gamma adenosine triphosphate (ATP) resonances were quantified. pH was estimated from the chemical shift between Pi and PCr10.
Statistical analysis
A linear model and ANOVA with gender and age as fixed factors were used for statistical analysis (R Studio), with p<0.05 considered significant.
Results
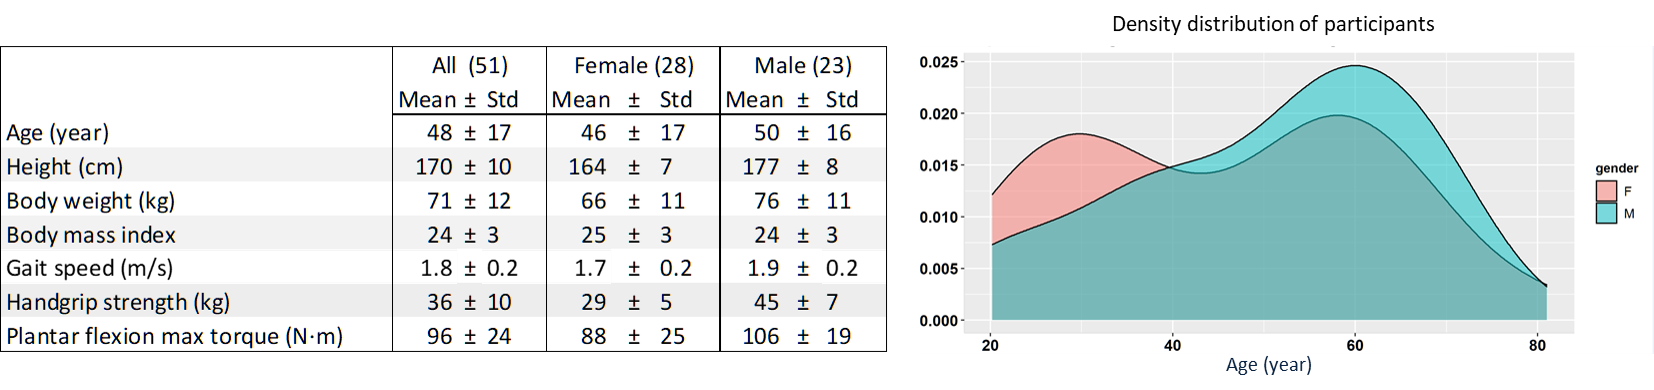
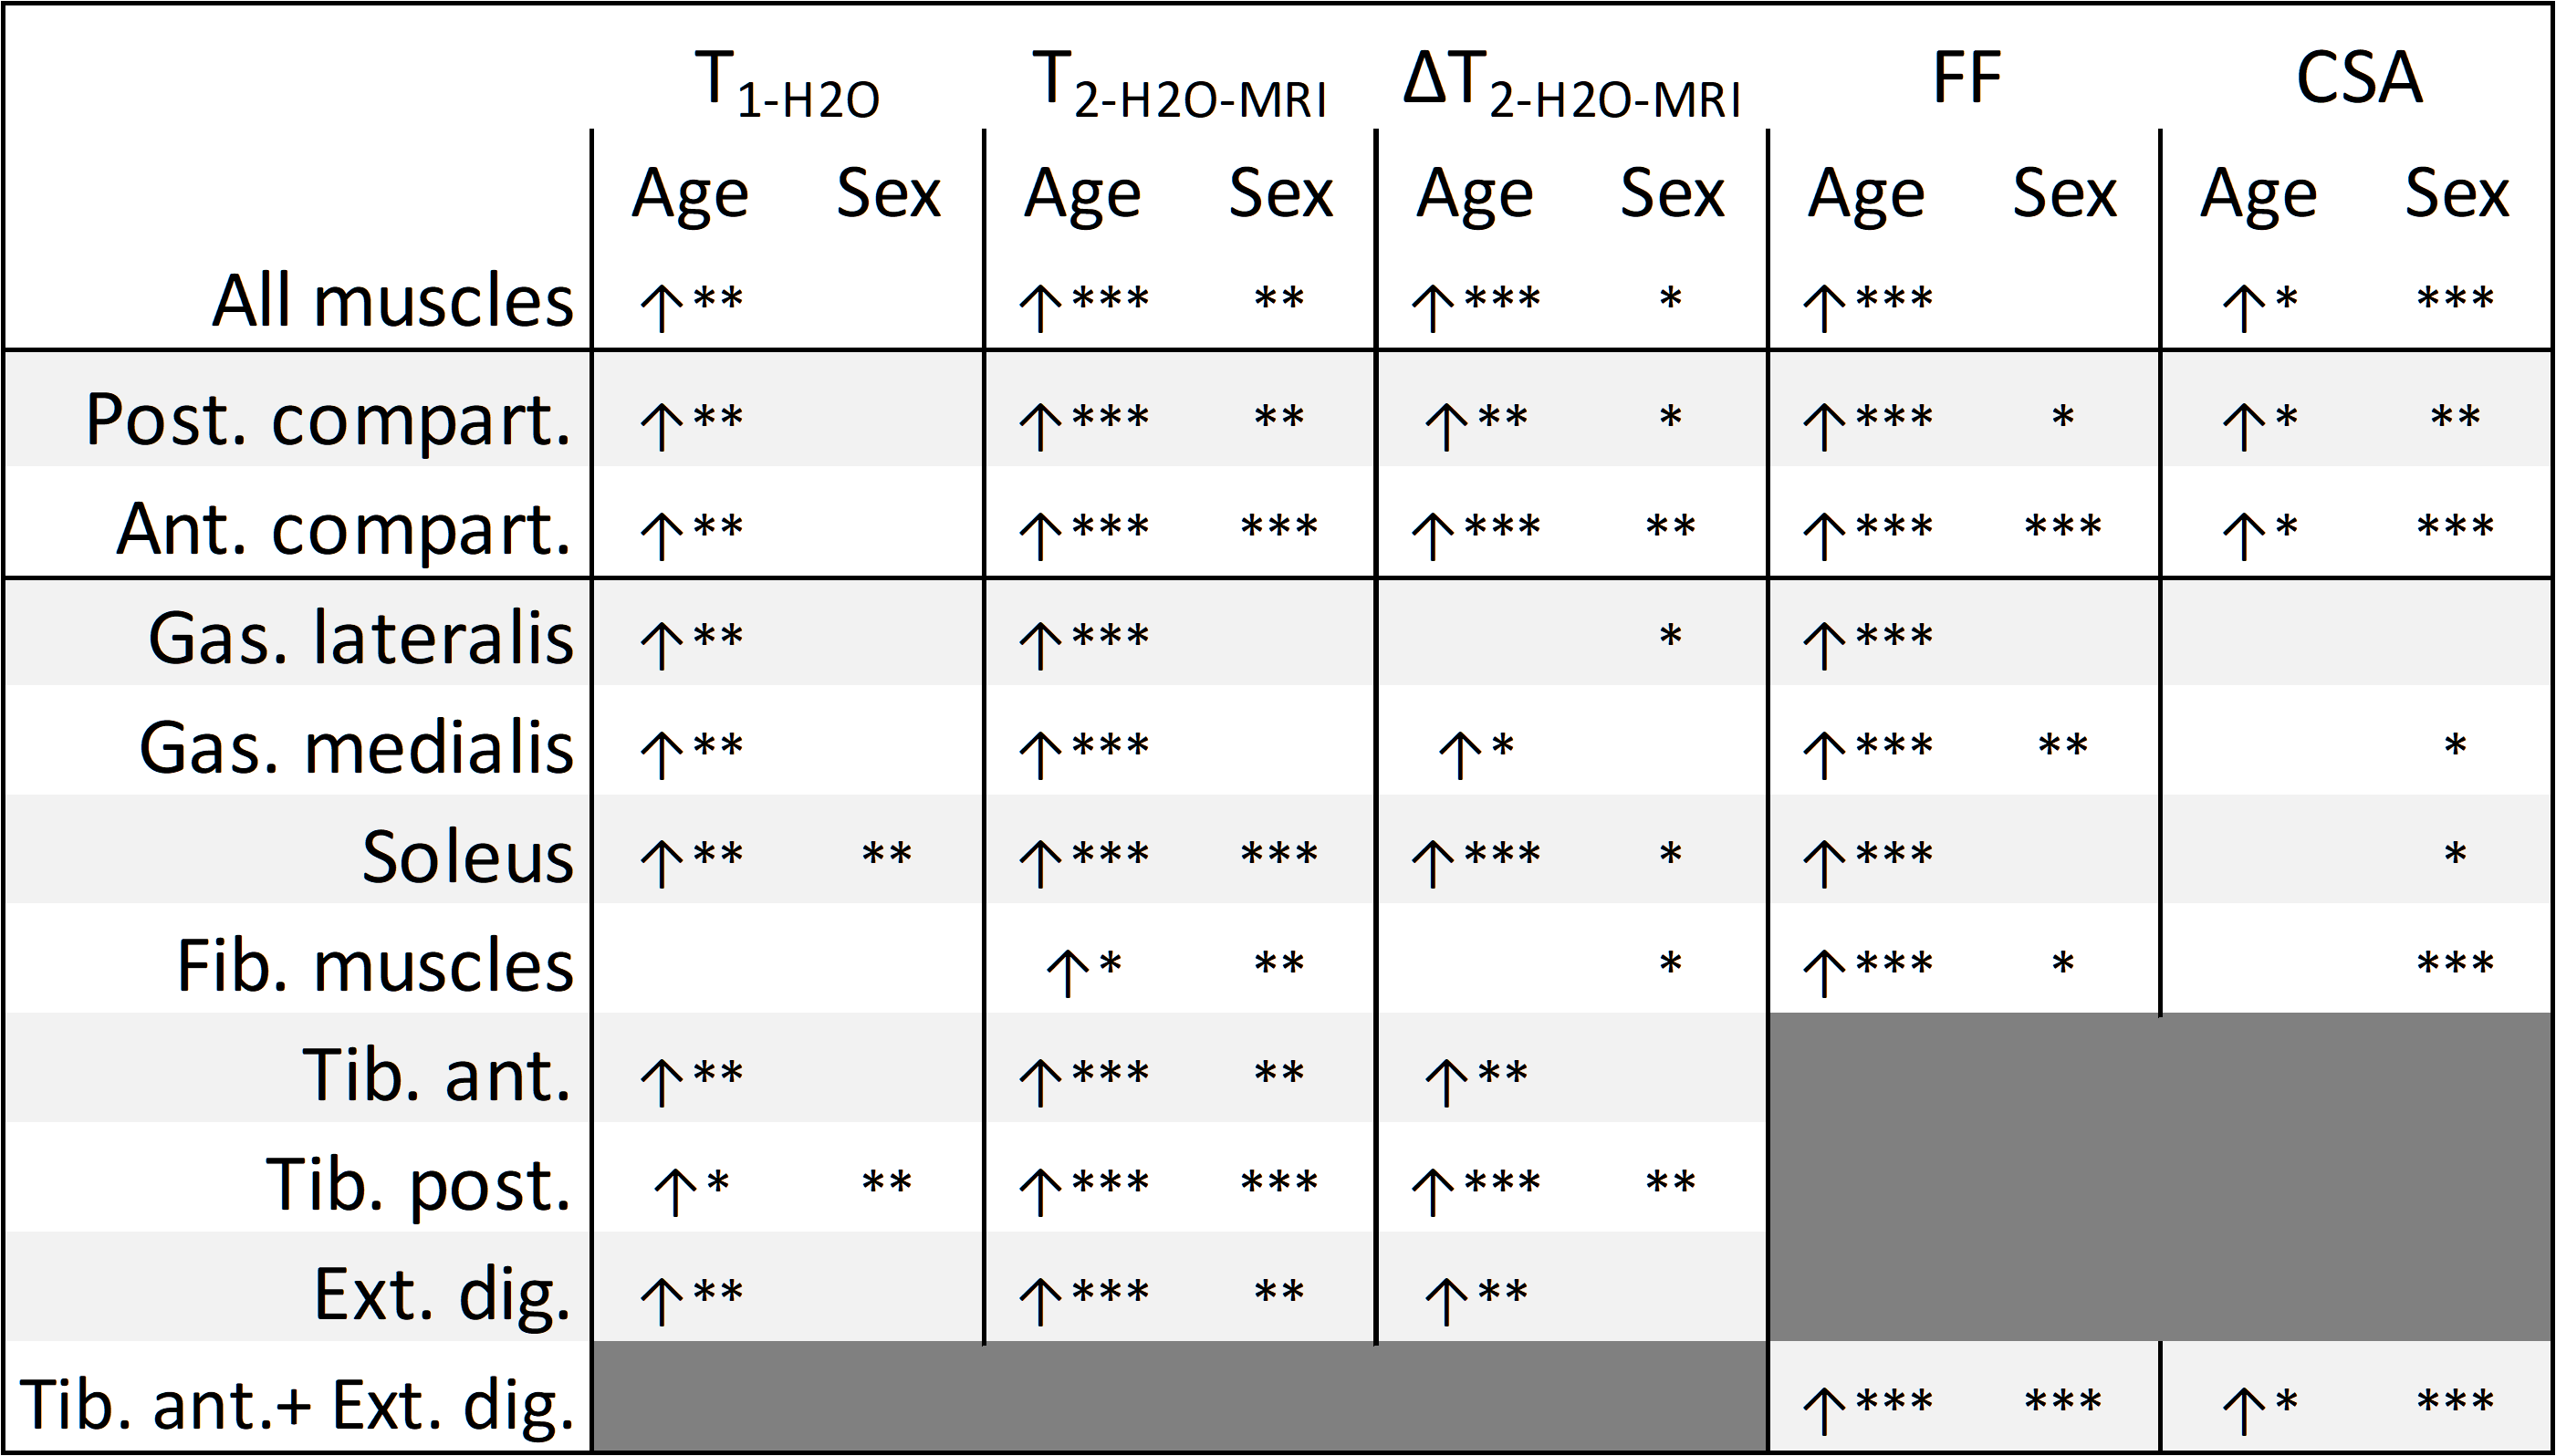
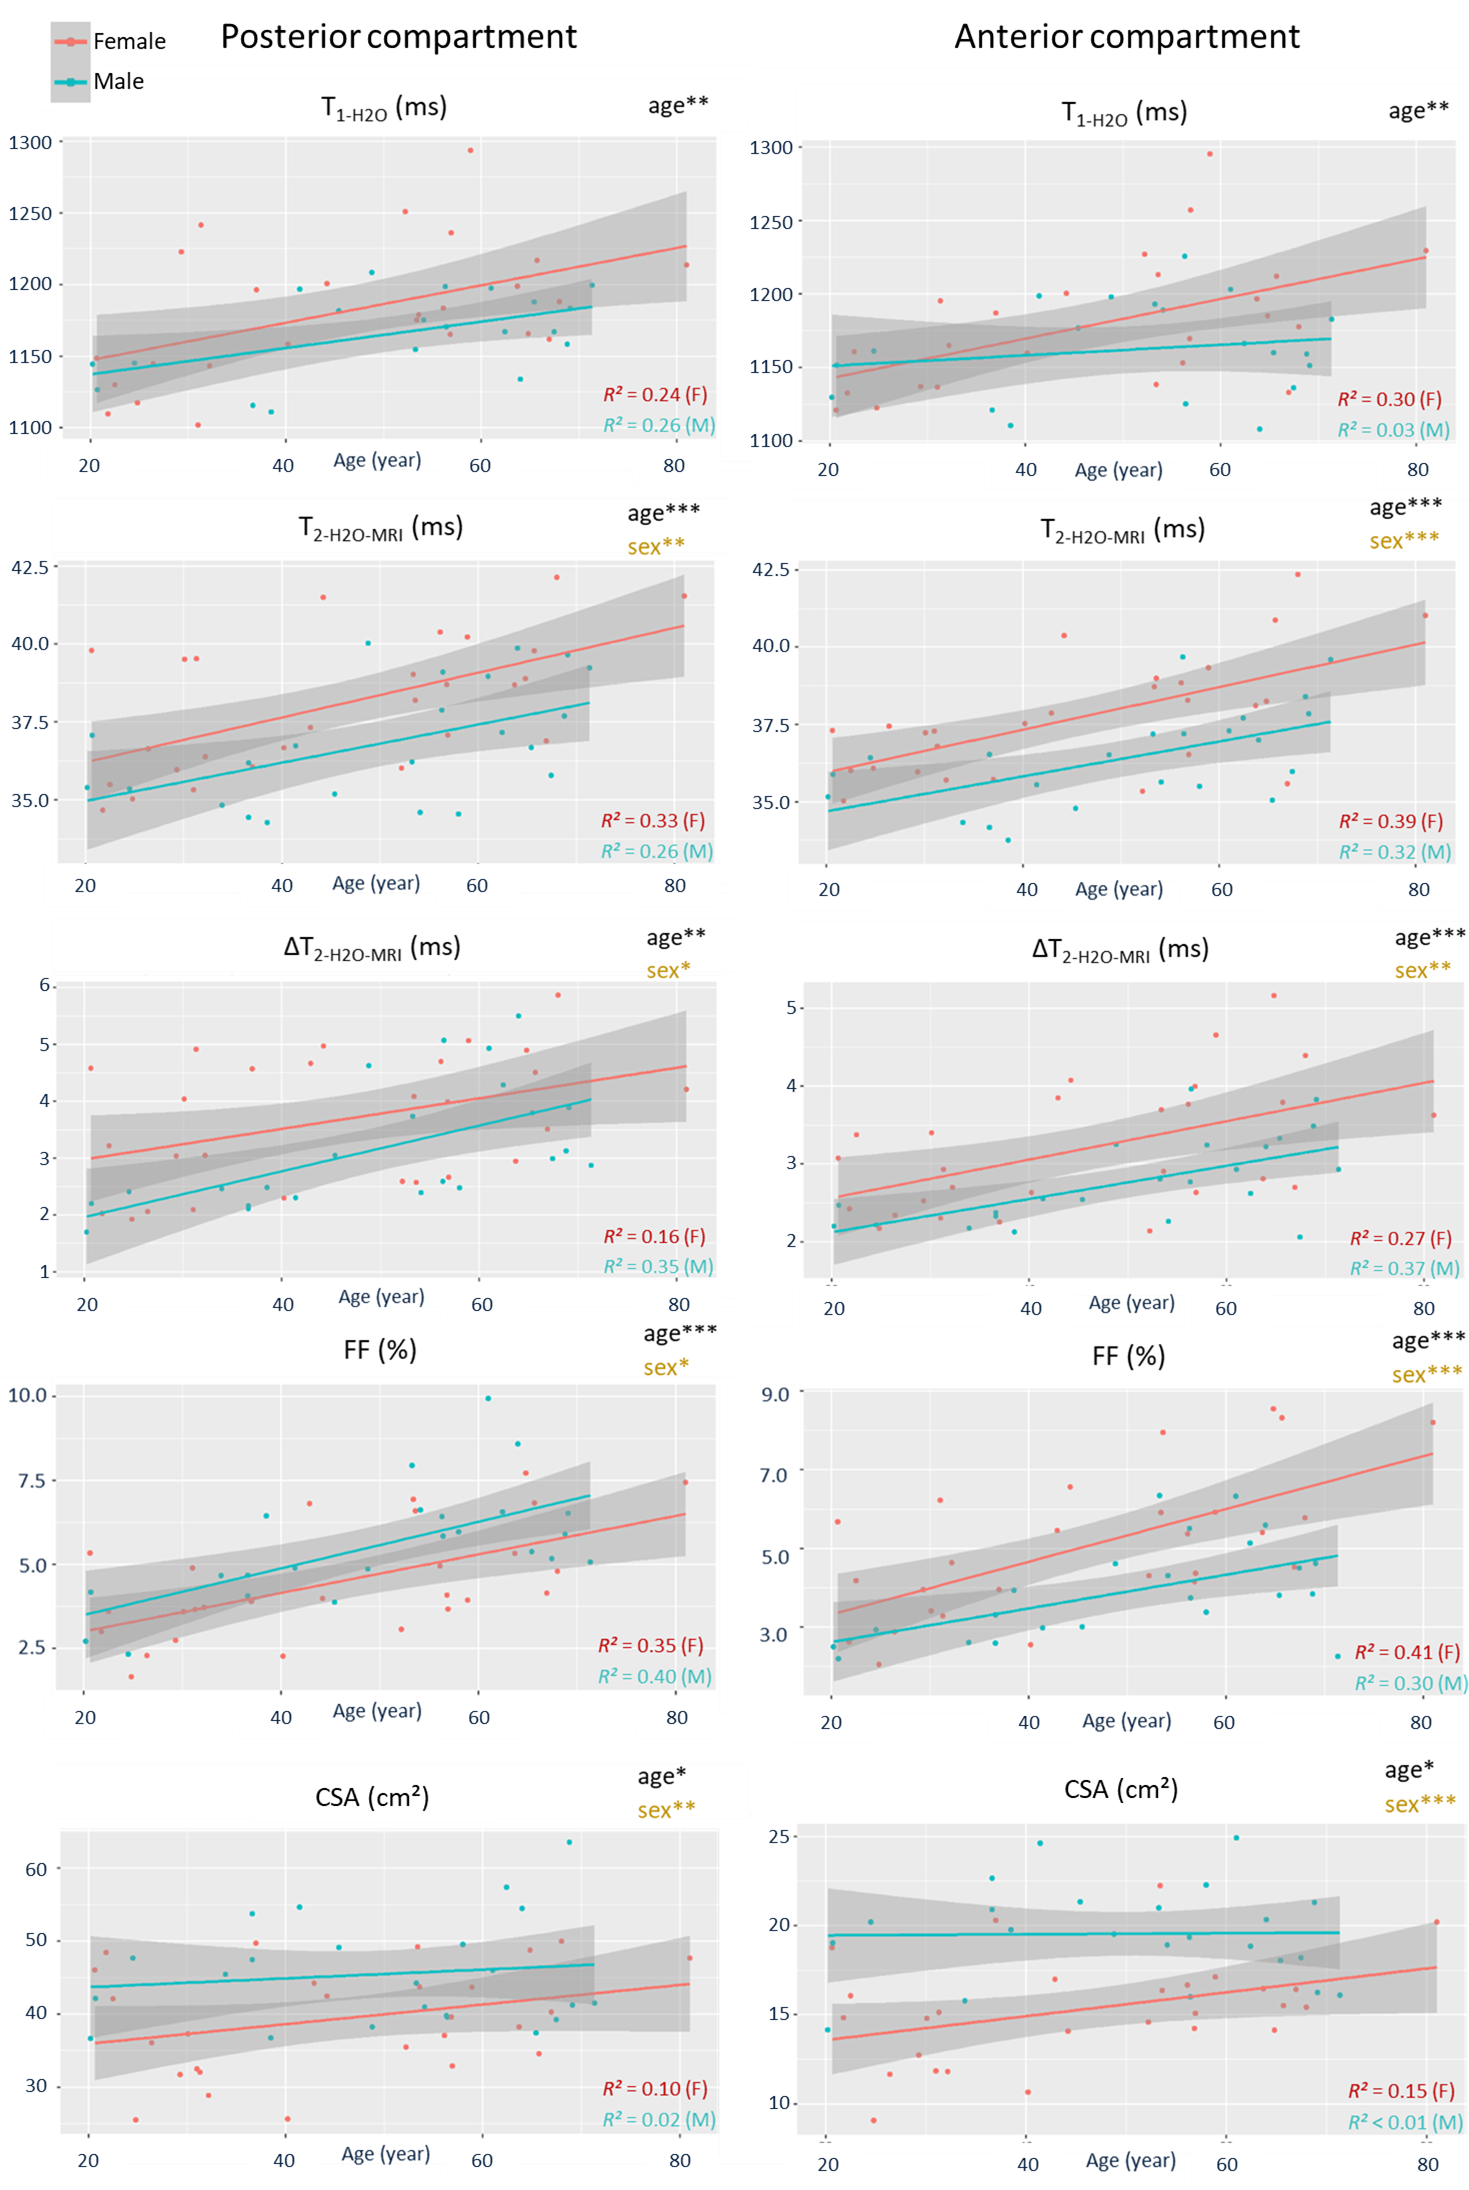
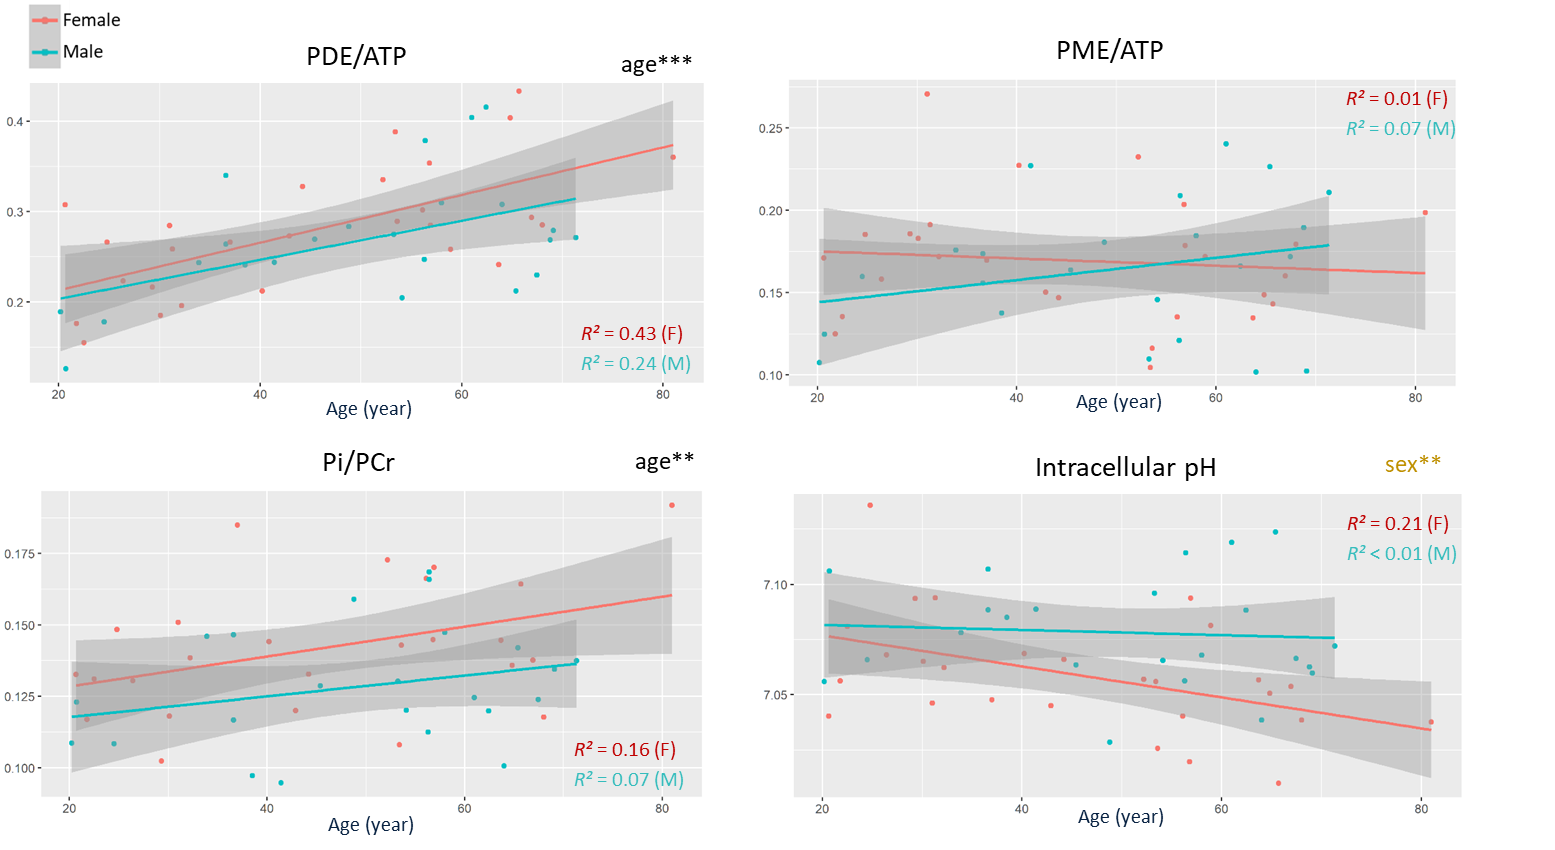
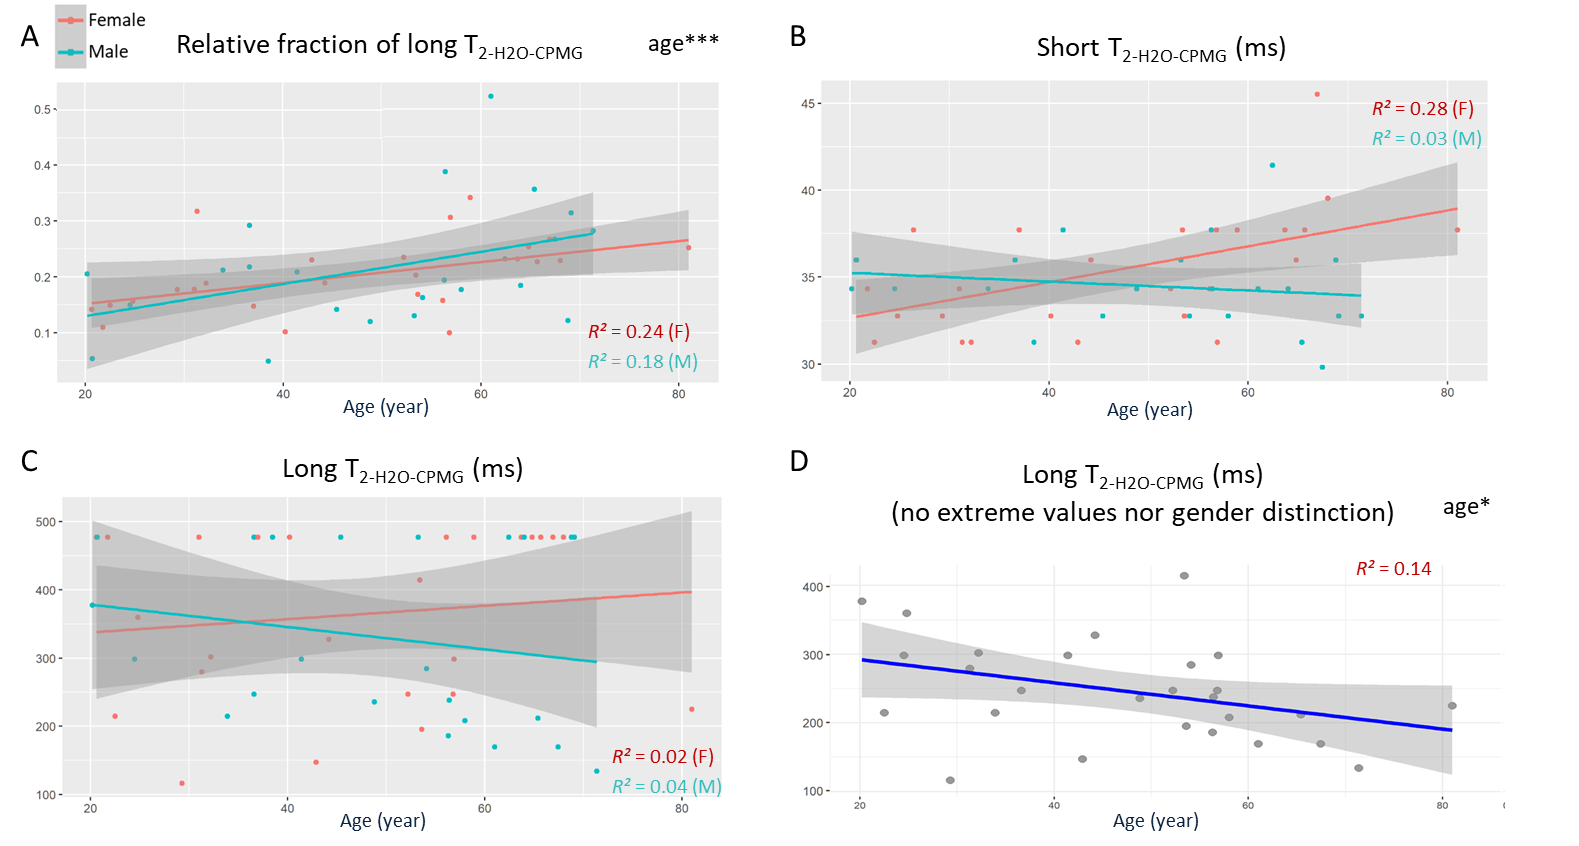
Figure 1 shows the participants’ demographics and clinical evaluation results. Figure 2 summarizes the changes related to age and gender in the MRI data. Overall, consistent age-related increases of FF, T1-H2O, T2-H2O-MRI and ΔT2-H2O-MRI were observed in individual muscles, as well as sex-related changes, notably for T2-H2O-MRI and CSA. Figure 3 shows the increase of these variables in the posterior and anterior compartments for each gender. As shown in figure 4, PDE/ATP and Pi/PCr increased with age but no changes were observed for PME/ATP and only sex-related differences were observed for pH. Interestingly, the relative fraction of long T2-H2O-CPMG increased with age (figure 5A) but the short and long T2-H2O-CPMG values did not (figure 5B,C). By ignoring the volunteers whose long T2-H2O-CPMG reached the upper limit of the fit, a significant age-related decrease of long T2-H2O-CPMG values was found (figure 5D).Discussion
The age-related increase of FF and T2-H2O-MRI in the lower leg agree with studies in the quadriceps1,11. An increase of T1-H2O-MRI with age was also found, similarly to another study where multiple T1-H2O-MRI measurements strategies were employed2. Unlike T2-H2O-MRI, T1-H2O-MRI was insensitive to gender but systematically presented lower R² values. The increase of T2-H2O-MRI heterogeneity, the stability of the short T2-H2O-CPMG component during ageing and the increase of the long T2-H2O-CPMG relative fraction, could indicate an increase of the vascular compartments8, possibly due to chronic inflammation processes, fiber type II atrophy and fluid retention. The high variability of our long T2-H2O-CPMG values preclude us to conclude on the impact of ageing (figure 5C-D) and requires further investigation. The age-related increase in PDE/ATP and Pi/PCr (and absence of PME/ATP change) are in agreement with previous studies in the thigh12 and calf3, and suggest an increased membrane turn-over, possibly related to a degeneration or change of fiber topology, as well as increased mitochondrial stress.Conclusion
Age-related structural and metabolic changes in the lower leg were observed, demonstrating the interest of a multi-parametric approach. Future studies could focus on the etiology of sarcopenia and, in animal studies, confront the NMR findings to histological data.Acknowledgements
No acknowledgement found.References
1. Codari M et al., JMRI. 2020; 51 :1117-1127
2. White JC et al., Diagnostics (Basel). 2022; 12(3) :584.
3. Krumpolec P et al., Front Physiol. 2020; 11 :644.
4. Araujo ECA et al., JMRI. 2021; 53(1) :181-189.
5. Marty B et al., Radiology. 2021; 300(3) :652-660
6. Azzabou N et al., JMRI. 2015; 41(3) :645-53.
7. Marty B & Carlier PC, MRM. 2019; 00 :1-14
8. Araujo ECA et al., Biophys J. 2014; 106 :2267–2274
9. Reyngoudt H et al., NMR Biomed. 2018; 31 :e3839.
10. Moon RB & Richards JH. J Biol Chem. 1973; 248 :7276-7278.
11. Azzabou N et al., Exp Gero. 2015; 70 :54-60
12. Reyngoudt H et al., 8th International Conference of the SCWD. Abstract 5-06. JCSM. 2015; 6(4): 398–509.
Figures