0736
Quantitative muscle MRI depicts microstructural abnormalities but no signs of inflammation or dystrophy in Post COVID-19 condition1Neurology, University Clinic Bergmannsheil Bochum gGmbH, Bochum, Germany, 2Heimer Institute for Muscle Research, University Clinic Bergmannsheil Bochum gGmbH, Bochum, Germany, 3Anaesthesiology, Intensive Care and Pain Management, University Clinic Bergmannsheil Bochum gGmbH, Bochum, Germany
Synopsis
Keywords: Muscle, COVID-19
Patients with post COVID-19 condition (PCC) often suffer from musculoskeletal pain with unknown pathophysiology. qMRI of the lower limbs was used to unravel the underlying mechanisms. 20 PCC were compared to 20 age and gender matched controls with regard to muscle fatfraction (revealed by Dixon imaging) water T2 time (using T2-mapping) and structural alterations (using DTI). Quantitative MRI did not depict any signs of ongoing inflammation or dystrophic process of the skeletal muscles in PCC patients. However, differences observed in muscle DTI depicts microstructural abnormalities, which may reflect potentially reversible fiber hypotrophy due to deconditioning.Introduction
Patients with post COVID-19 condition (PCC) often suffer from musculoskeletal pain and premature exhaustion but the exact underlying pathophysiology is still unknown 1,2. Furthermore, it is not clear, if post COVID-19 patients present structural muscular abnormality indicating oedema or dystrophy of the skeletal muscles of the lower limbs. Quantitative MRI (qMRI) techniques like Dixon fat fraction (FF), T2-imaging, and diffusion tensor imaging (DTI) are promising non-invasive tools in the evaluation of muscular pathology and inflammation3 and have been validated in several neuromusclular disorders, e.g. 4,5. The aim of the present study was to dissect the mechanisms of musculoskeletal complaints assessing muscular pathology of the lower limbs in patients with PCC using qMRI and to correlate these parameters with patient-reported outcomes and parameters of the clinical examination.Methods
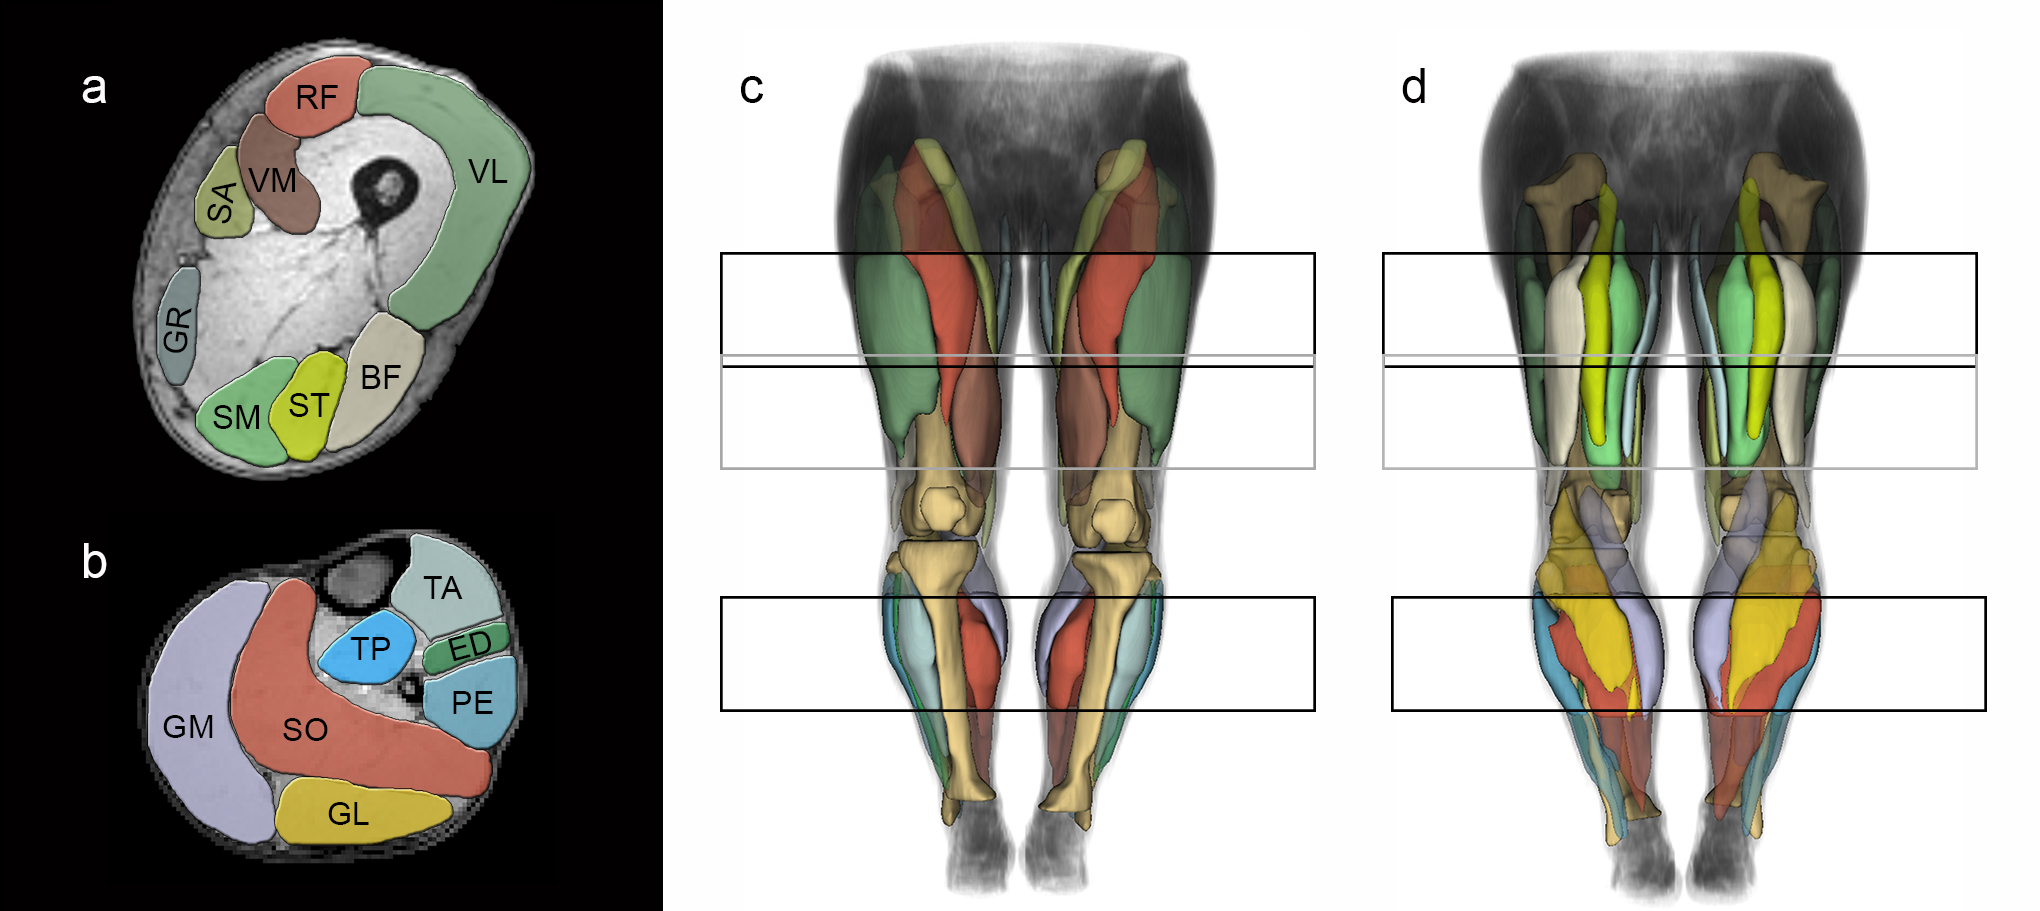
In total, 20 individuals with post COVID-19 condition (15 females, mean age 48.8±10.1 years) and 20 age and gender matched healthy controls (15 females, mean age 48.1±11.1 years) participated in this study. None of the controls reported a previous SARS-COV2 infection. All participants underwent a 3T MRI (Philips Achieva) of both whole legs using a 16CH Torso XL coil. The protocol included a Dixon sequence (voxel size 1.5 × 1.5 × 6.0 mm³; TR/TE 210/2.6, 3.36, 4.12, 4.88ms; flip angle 8°, SENSE: 2), a multi‐echo spin‐echo (MESE) sequence for quantitative water mapping including 17 echoes and Cartesian k‐space sampling (voxel size 3.0 × 3.0 × 6.0 mm³; TR/TE 4598/17x∆7.6; flip angle 90/180°, SENSE: 2), and a diffusion-weighted spin-echo EPI (voxel size 3.0×3.0×6.0 mm³; TR/TE 5000/57ms; SPAIR/SPIR fat suppression; SENSE: 1.9; 42 gradient directions with eight different b-values (0-600).6 Using the same imaging parameters as the DWI but without RF power and gradients, a noise scan was acquired. Data were pre-processed as previously described.6 In brief, using a PCA method, the diffusion data were denoised.7 To correct for subject motion and eddy currents both legs were registered separately. Then the tensors were calculated by taking IVIM into account and using an iWLLS algorithm.8,9 The IDEAL method was used for the Dixon data considering a singleT2* decay and resulting in a separated water and fat map.10 The derived water maps were used for the manual segmentation. The T2‐mapping data were processed using an extended phase graph (EPG) fitting approach considering different T2 relaxation times for the water and fat components11. Eight thigh muscles (vastus lateralis, vastus medialis, rectus femoris, semimembranosus, semitendinosus, biceps femoris, sartorius and gracilis) and seven calf muscles (extensor digitorum, gastrocnemius lateralis and medialis, peroneal group, soleus, tibialis anterior and tibialis posterior) were segmented within the acquired FOV using an automated segmentation tool and subsequently further refined by an experienced rater in both legs (See Figure 1).12 qMRI values of 15 muscles of both legs were calculated. Furthermore, an extensive clinical examination, nerve conduction studies, electromyography and six-minute-walk-test (6MWT) was performed. Within the PCC group qMRI data were correlated to the following patient-reported outcomes: European Quality of Life questionnaire (EQ-5D), Fatigue Scale for Motor and Cognitive Functions (FSMC), and Beck depression inventory (BDI).Results
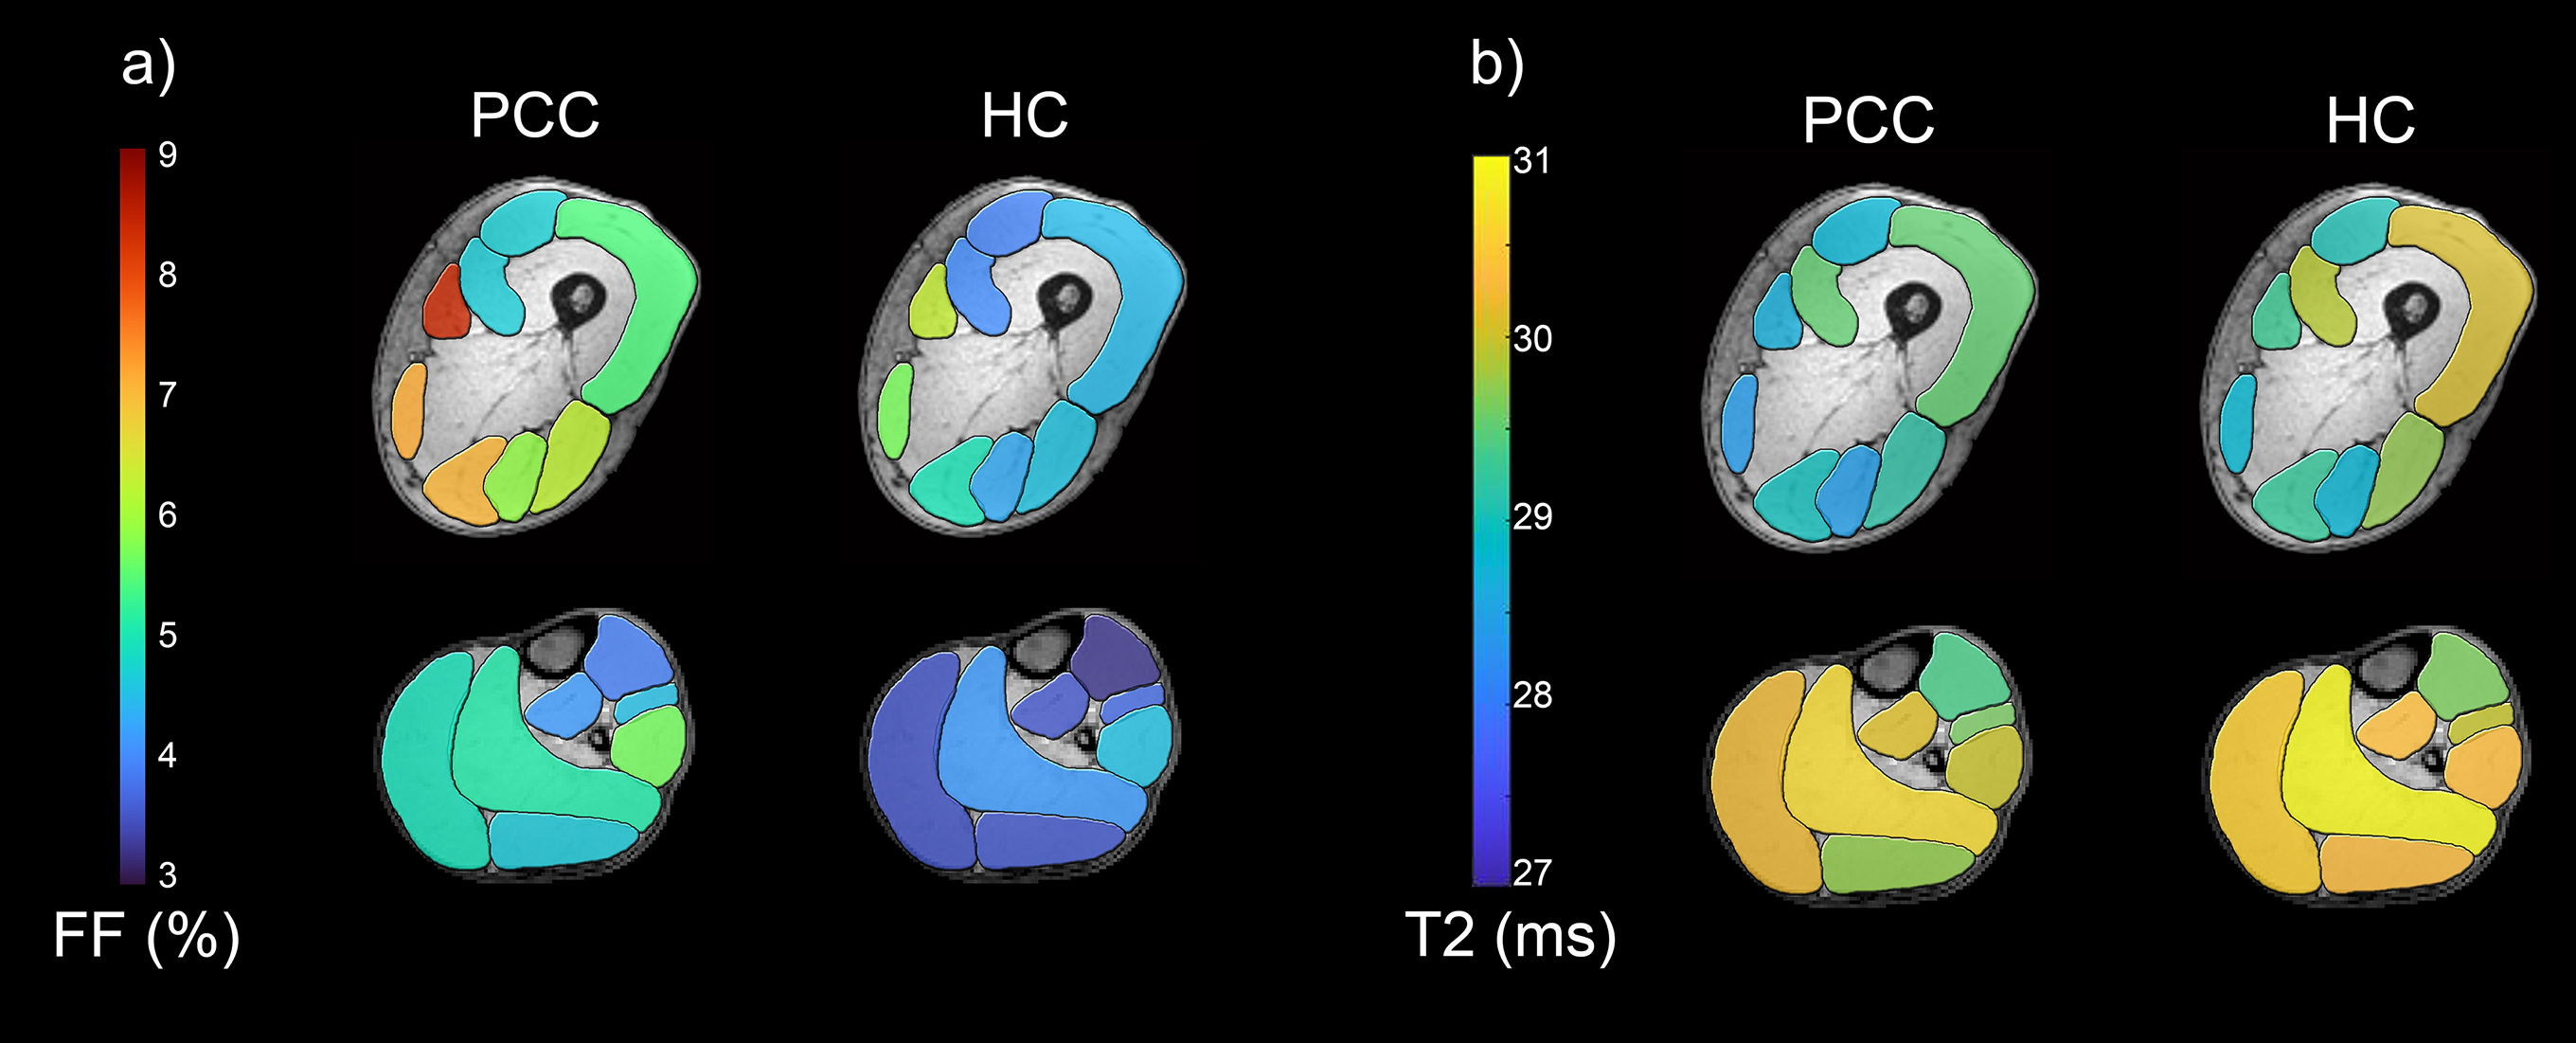
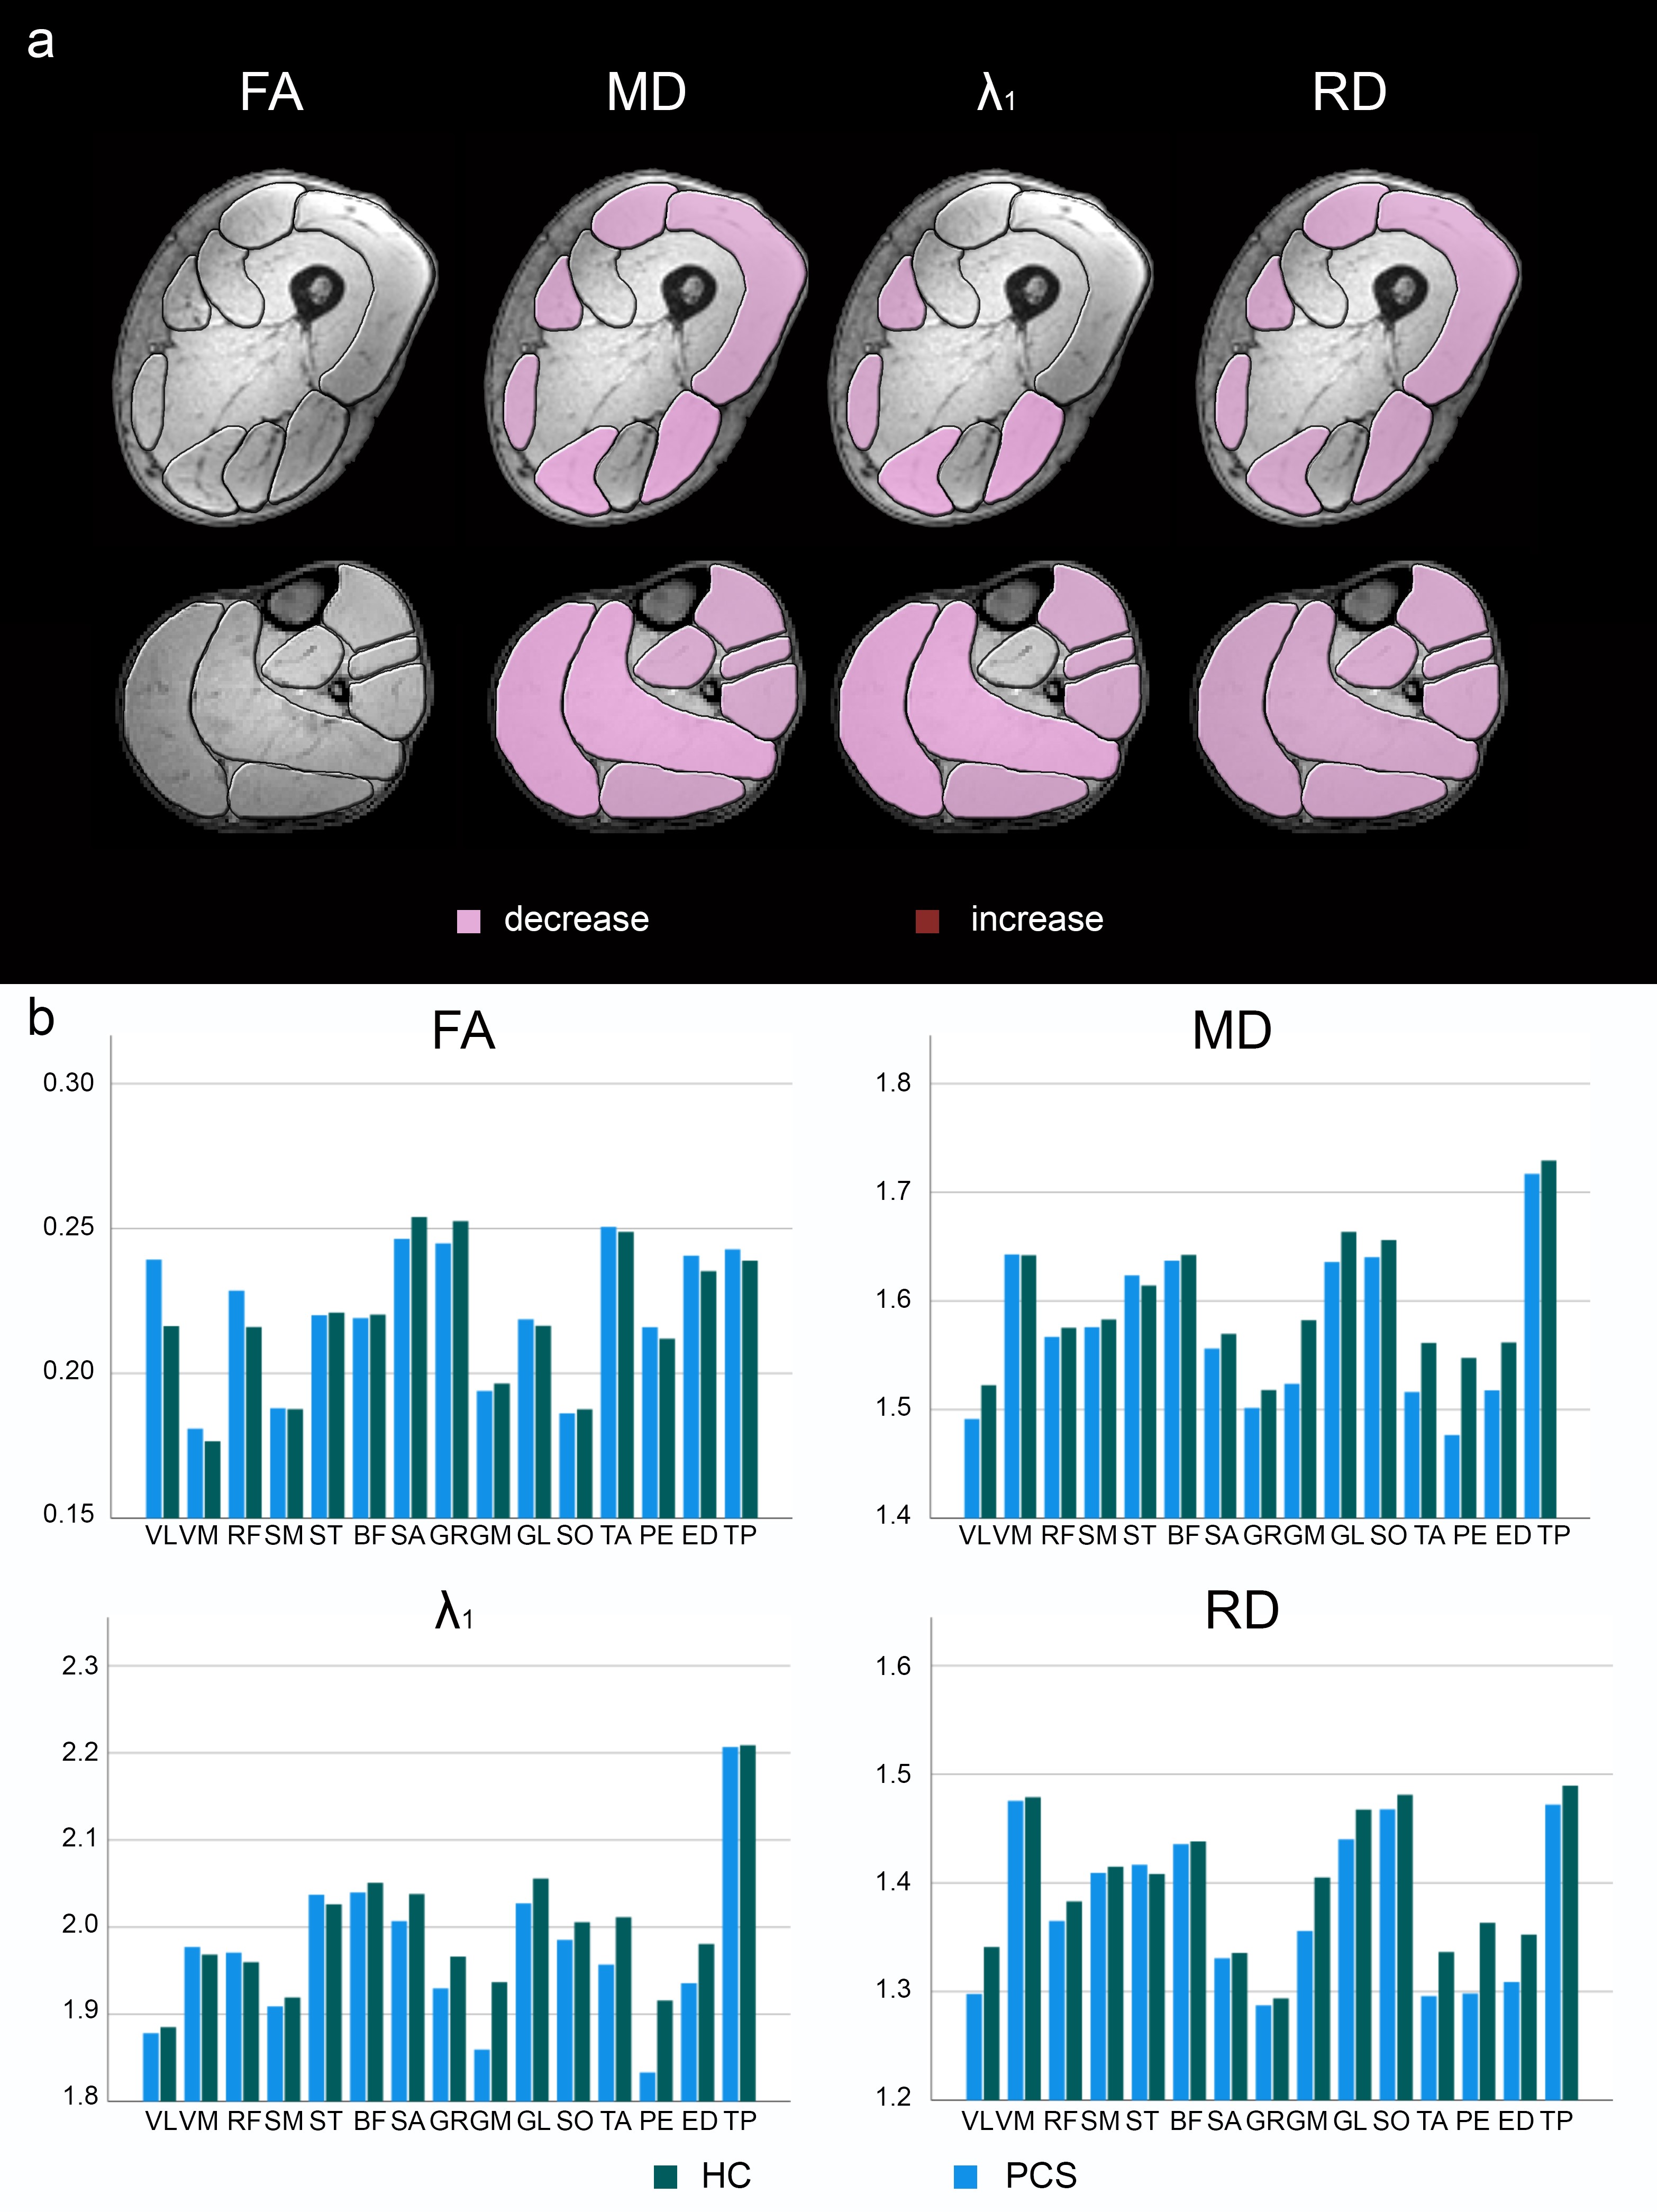
An ANOVA revealed significant differences of FF between PCC and healthy control group (Main Effect: p<0.001), which disappeared when correcting for different BMI in study groups (28.8±4.7 vs. 22.9±2.2, p < 0.001). FF correlated significantly with BMI in thigh (r=0.750, p<0.001) and calf muscles (r=0.622, p<0.001). No significant differences were found for T2-values (see Figure 2).In terms of DTI, a significant decrease of mean diffusivity, axial diffusivity and radial diffusivity was observed in PCC patients (Main effect: p ≤ 0.001) while fractional anisotropy (FA) showed no difference between groups (p = 0.325, see Figure 3).
Walking distance was significantly lower in PCC group. No significant correlations between qMRI values and 6-MWT or questionnaires were found except for a moderate correlation between FSMC and FA (r = 0.577, p =0.031) and T2 (r = 0.592, p = 0.026) in the upper leg.
Discussion
In conclusion, differences in diffusion metrics seem to be unspecific and could indicate fiber hypotrophy possibly due to deconditioning, as seen in sarcopenia, which would go along with the lower 6MWT performance. Importantly, inflammatory processed in the acute phase cannot be excluded by the used study design. However, qMRI did not reveal any signs of dystrophic process or inflammation in patients with long-lasting PCC, although it has been previously repeatedly shown to be sensitive to detect even subtle alterations in skeletal muscles.3,13,14 Since no abnormalities were found in PCC patients using highly sensitive, quantitative Dixon and T2 sequences, no anomalies can be expected in conventional T1weighted- and T2weighted-sequences. Therefore, we recommend performing muscle MRI in PCC patients only in cases of clinical hints for muscular involvement such as manifest paresis, continuously elevated creatin kinase levels or a myopathic pattern in electromyography.Acknowledgements
We thank Philips Germany for continuous scientific support and specifically Dr. Burkhard Mädler for valuable discussion. We thank EuroQOL group for written permission to use the EQ-5D. We thank Miriam Kaisler for support in data entry and analysis. There is no specific funding for the study. EEK holds an endowed professorship funded by the German Social Accident Insurance (DGUV) for the period of 6 years (2020-2026) and has received a grant from the Georg Agricola Ruhr foundation. LS and MT received funding from the DFG (Project number: 122679504, SFB874; TP-A1 to MT, TP-A5 to LS). MR and JF received grants from the FoRUM-programm of the Ruhr-University Bochum (MR: F960R-2020; JF: K139-20). CMF received grants from the FoRUM-programm of the Ruhr-University Bochum (F1013-20, F961-19) and Agricola Rhein-Ruhr. MR is funded by the Heimer Institut. LS received funding from Sanofi Genzyme (Project number: SGZ-2019-12541).References
1. Fernández-de-las-Peñas C, Navarro-Santana M, Plaza-Manzano G, Palacios-Ceña D, Arendt-Nielsen L. Time Course Prevalence of Post-COVID Pain Symptoms of Musculoskeletal Origin in Patients Who Had Survived to Severe Acute Respiratory Syndrome Coronavirus 2 Infection. Vol Publish Ah.; 2021. doi:10.1097/j.pain.0000000000002496
2. Meyer-Frießem CH, Gierthmühlen J, Baron R, Sommer C, Üçeyler N, Enax-Krumova EK. Pain during and after COVID-19 in Germany and worldwide: A narrative review of current knowledge. Pain Reports. 2021;6(1):1-7. doi:10.1097/PR9.0000000000000893
3. Hooijmans MT, Monte JRC, Froeling M, et al. Quantitative MRI Reveals Microstructural Changes in the Upper Leg Muscles After Running a Marathon. J Magn Reson Imaging. 2020;52(2):407-417. doi:10.1002/jmri.27106
4. Güttsches AK, Rehmann R, Schreiner A, et al. Quantitative muscle-MRI correlates with histopathology in skeletal muscle biopsies. J Neuromuscul Dis. 2021;(in press).
5. Rehmann R, Schneider-Gold C, Froeling M, et al. Diffusion tensor imaging shows differences between Myotonic Dystrophy type 1 and type 2. J Neuromuscul Dis. 2021;8(6):949-962.
6. Schlaffke L, Rehmann R, Rohm M, et al. Multicenter evaluation of stability and reproducibility of quantitative MRI measures in healthy calf muscles. NMR Biomed. 2019;32(9):1-14. doi:10.1002/nbm.4119
7. Leemans A, Jones DK. The B-matrix must be rotated when correcting for subject motion in DTI data. Magn Reson Med. 2009;61(6):1336-1349.
8. Veraart J, Novikov DS, Christiaens D, Ades-aron B, Sijbers J, Fieremans E. Denoising of diffusion MRI using random matrix theory. Neuroimage. 2016;142:394-406. http://dx.doi.org/10.1016/j.neuroimage.2016.08.016
9. Veraart J, Sijbers J, Sunaert S, Leemans A, Jeurissen B. Weighted linear least squares estimation of diffusion MRI parameters: Strengths, limitations, and pitfalls. Neuroimage. 2013;81:335-346. http://dx.doi.org/10.1016/j.neuroimage.2013.05.028
10. Reeder SB, Pineda AR, Wen Z, et al. Iterative Decomposition of Water and Fat With Echo Asymmetry and Least-Squares Estimation ( IDEAL ): Application With Fast Spin-Echo Imaging. Magnenetic Reson Med. 2005;644:636-644. doi:10.1002/mrm.20624
11. Marty B, Baudin PY, Reyngoudt H, et al. Simultaneous muscle water T2 and fat fraction mapping using transverse relaxometry with stimulated echo compensation. NMR Biomed. 2016;29(November 2015):431-443. doi:10.1002/nbm.3459
12. Rohm M, Markmann M, Forsting J, Rehmann R, Froeling M, Schlaffke L. 3D Automated Segmentation of Lower Leg Muscles Using Machine Learning on a Heterogeneous Dataset. Diagnostics. 2021;11:1747.
13. Janssen B, Voet N, Geurts A, van Engelen B, Heerschap A. Quantitative MRI reveals decelerated fatty infiltration in muscles of active FSHD patients. Neurology. 2016;86(18):1700-1707. doi:10.1212/WNL.0000000000002640
14. Hooijmans MT, Niks EH, Burakiewicz J, Verschuuren JJGM, Webb AG, Kan HE. Elevated phosphodiester and T2levels can be measured in the absence of fat infiltration in Duchenne muscular dystrophy patients. NMR Biomed. 2017;30(1). doi:10.1002/nbm.3667
Figures