0734
Detection of new resonances in the down-field 1H MRS of human calf muscle in vivo at 7T1CAMIPM, Department of Radiology, Perelman School of Medicine at The University of Pennsylvania, Philadelphia, PA, United States, 2Bioengineering, University of Pennsylvania, Philadelphia, PA, United States, 3Radiology, Perelman School of Medicine at The University of Pennsylvania, Philadelphia, PA, United States
Synopsis
Keywords: MSK, Spectroscopy, Down-field 1H MRS
We have detected new resonances that were not reported previously with chemical shifts of ~10.1, 10.3, and 10.9 ppm occurring in the down-field 1H MRS (DFMRS) from the human calf muscle in vivo. Based on the phantom and literature data, we speculate that the contribution to the 10.1 ppm peak might be from L-Tryptophan whereas the peaks at 10.3 and 10.9 ppm are yet to be assigned. This is for the first time that these peaks are observed and reported from the down-field 1H MRS of the human calf muscle.INTRODUCTION
Down-field proton MR spectroscopy (DF 1H MRS) is an emerging technique for the detection of in vivo metabolites with protons that resonate >4.7 ppm. While several metabolites such as NAD+ and carnosine have previously been characterized in the downfield MR spectrum of the calf muscle and a new peak was reported occurring at 9.7 ppm1, it is unclear if there are other previously unidentified resonances that might be detected in vivo. Since most of the DF metabolites have protons that cross-relax with water or have chemical exchange, typically non-water-suppressed methods are used to perform DF 1H MRS2-6. In the current study at 7T, we have detected new resonances that were previously not reported and some of them seem to be specific to the calf muscle. Preliminary results obtained from healthy human calf muscle are presented here.METHODS
Five healthy male subjects in the age range of 26-59Y participated in the IRB approved study after explaining the study protocol and obtaining the consent form. All the DF 1H MRS data were obtained at 7T Siemens Terra scanner (Siemens Healthcare, Erlangen, Germany) using a single-channel volume transmit/28-channel receive phased array knee radio frequency coil (Quality Electrodynamics, Mayfield Village, OH, USA). A spectrally selective 90° E-BURP pulse7 centered at 10.3 ppm with a bandwidth of 2 ppm was used to excite the downfield metabolites (TR/TE: 1000/18ms, 256 averages, BW: 600Hz), and 3 narrow spatially selective refocusing 180° Shinnar-Le Roux (SLR) pulses (BW: 800Hz) were used for localization as described in our previous study4. Additionally, down-field spectra were also acquired on one of the volunteers with water saturation turned on. A large voxel was positioned within the calf to cover the maximum muscle area and the voxel dimensions varied across the volunteers (140 – 264 mm3).RESULTS
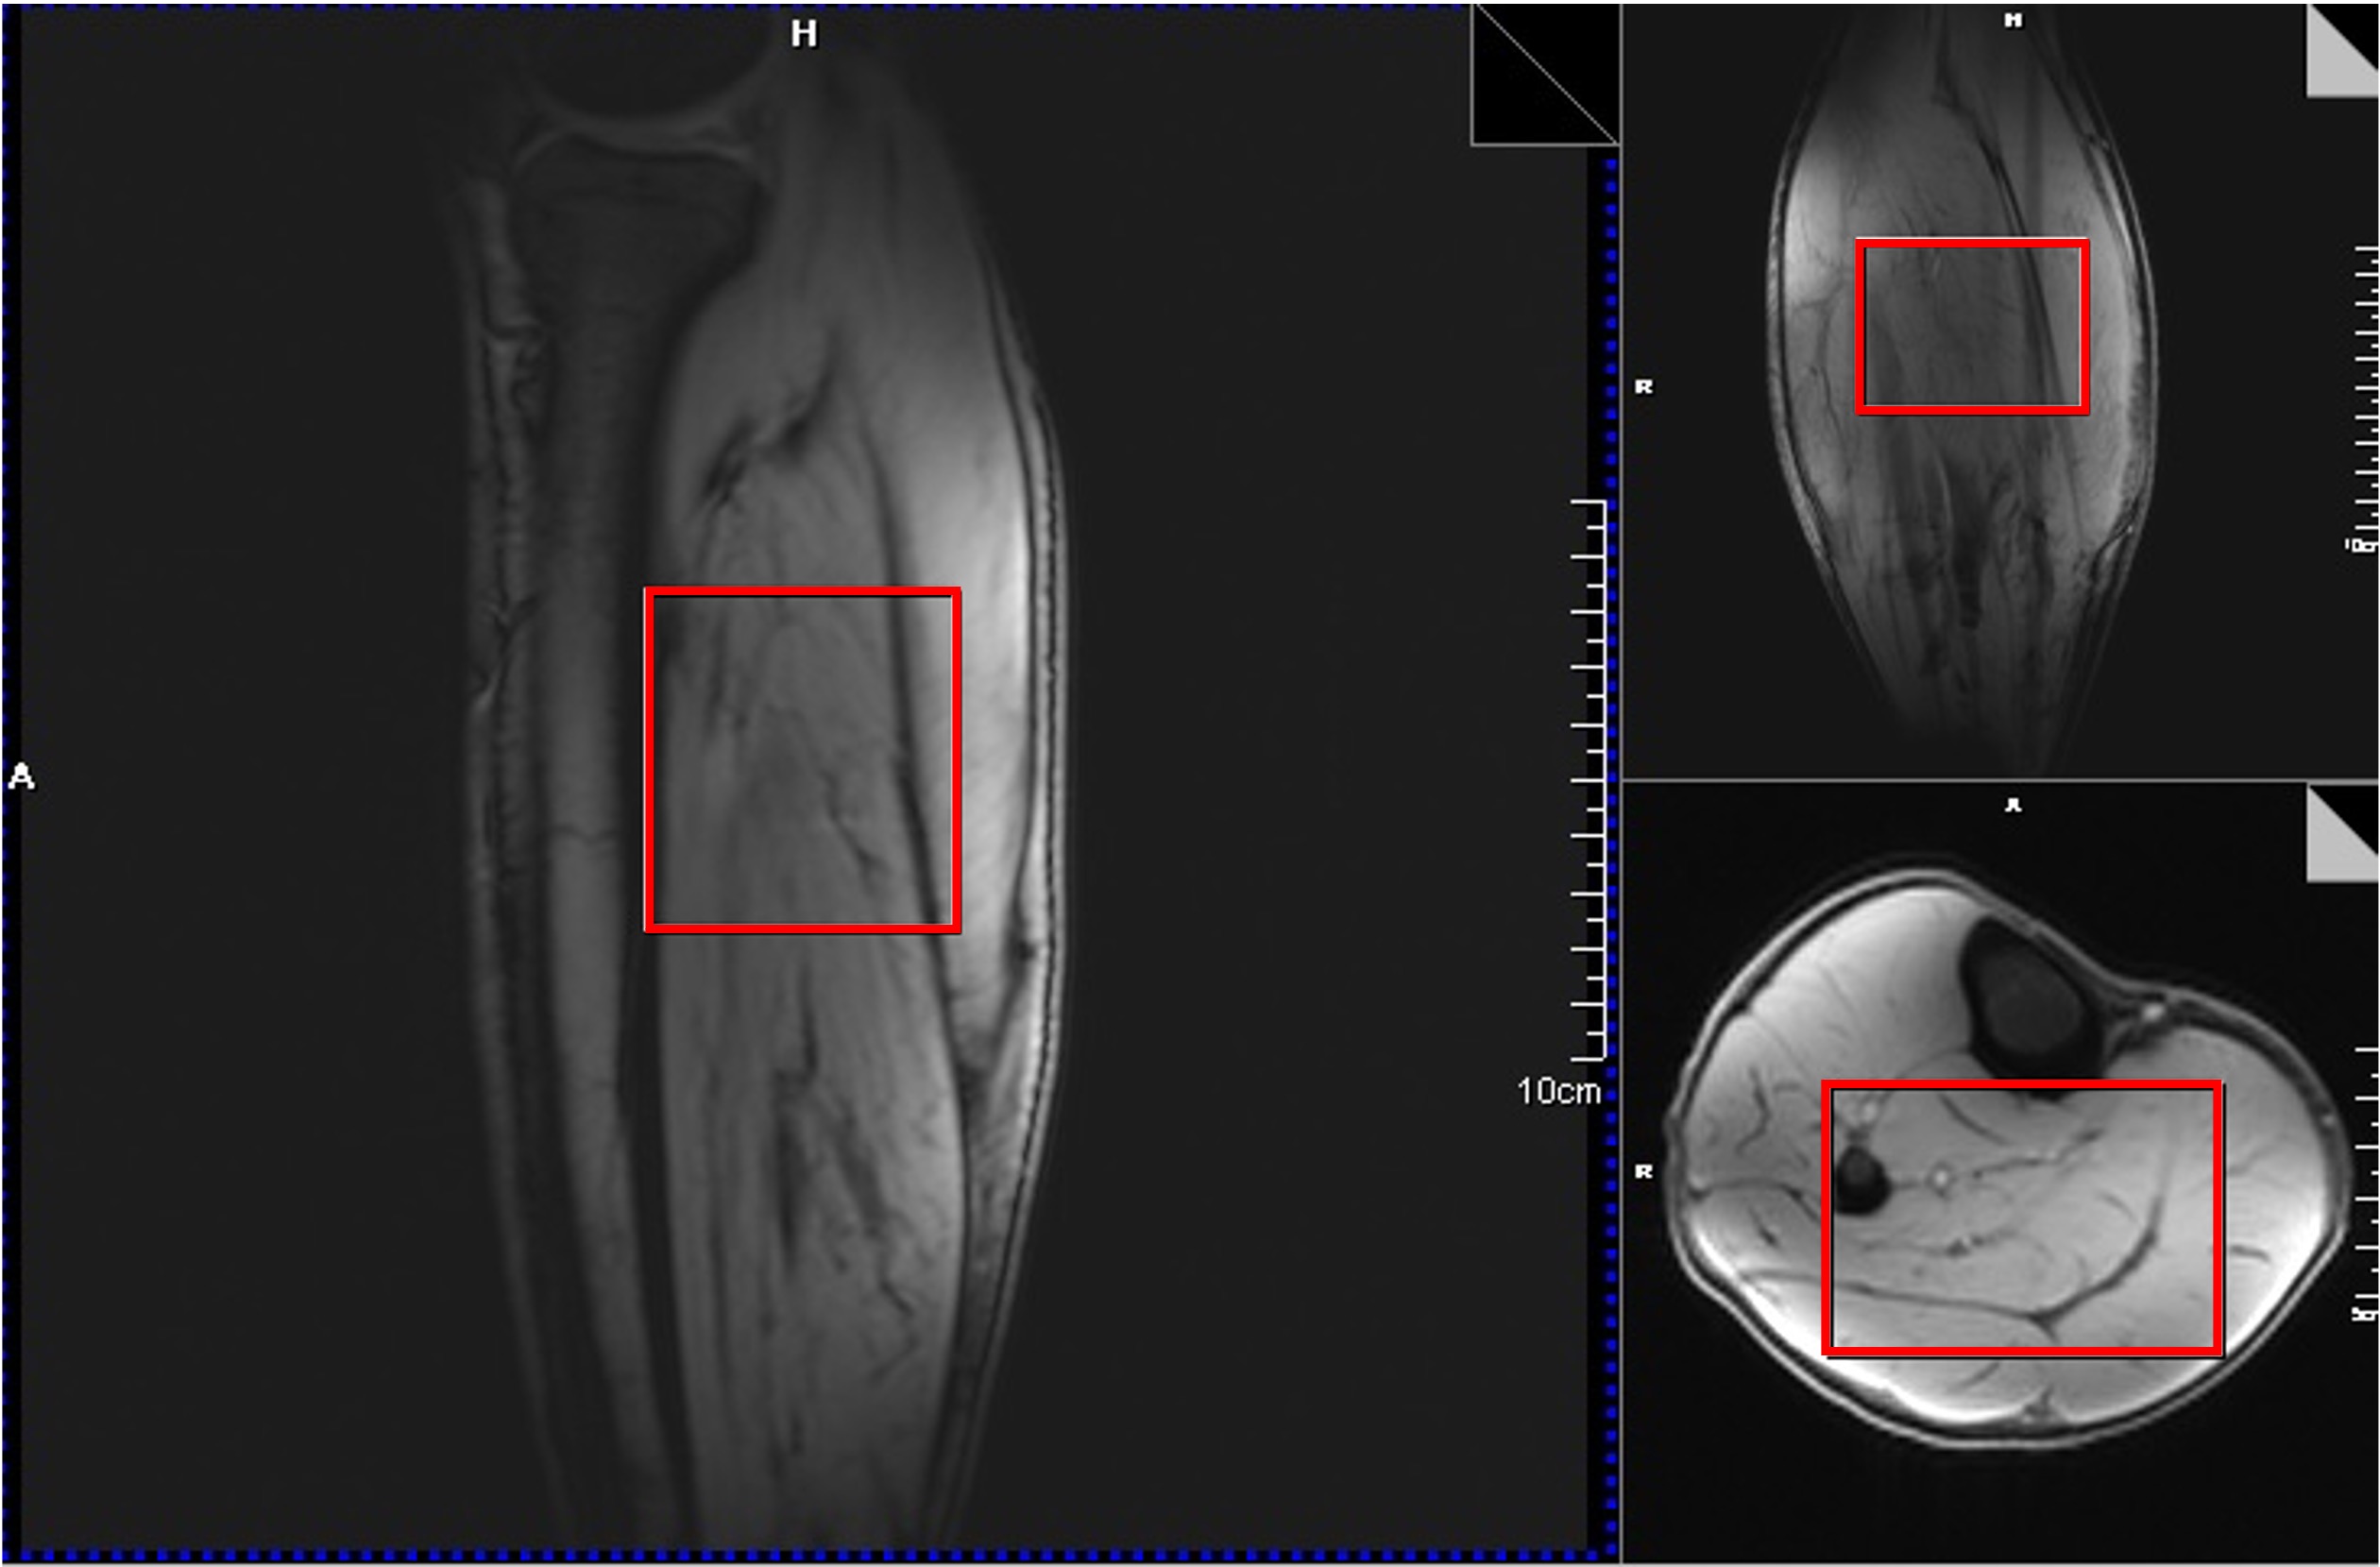
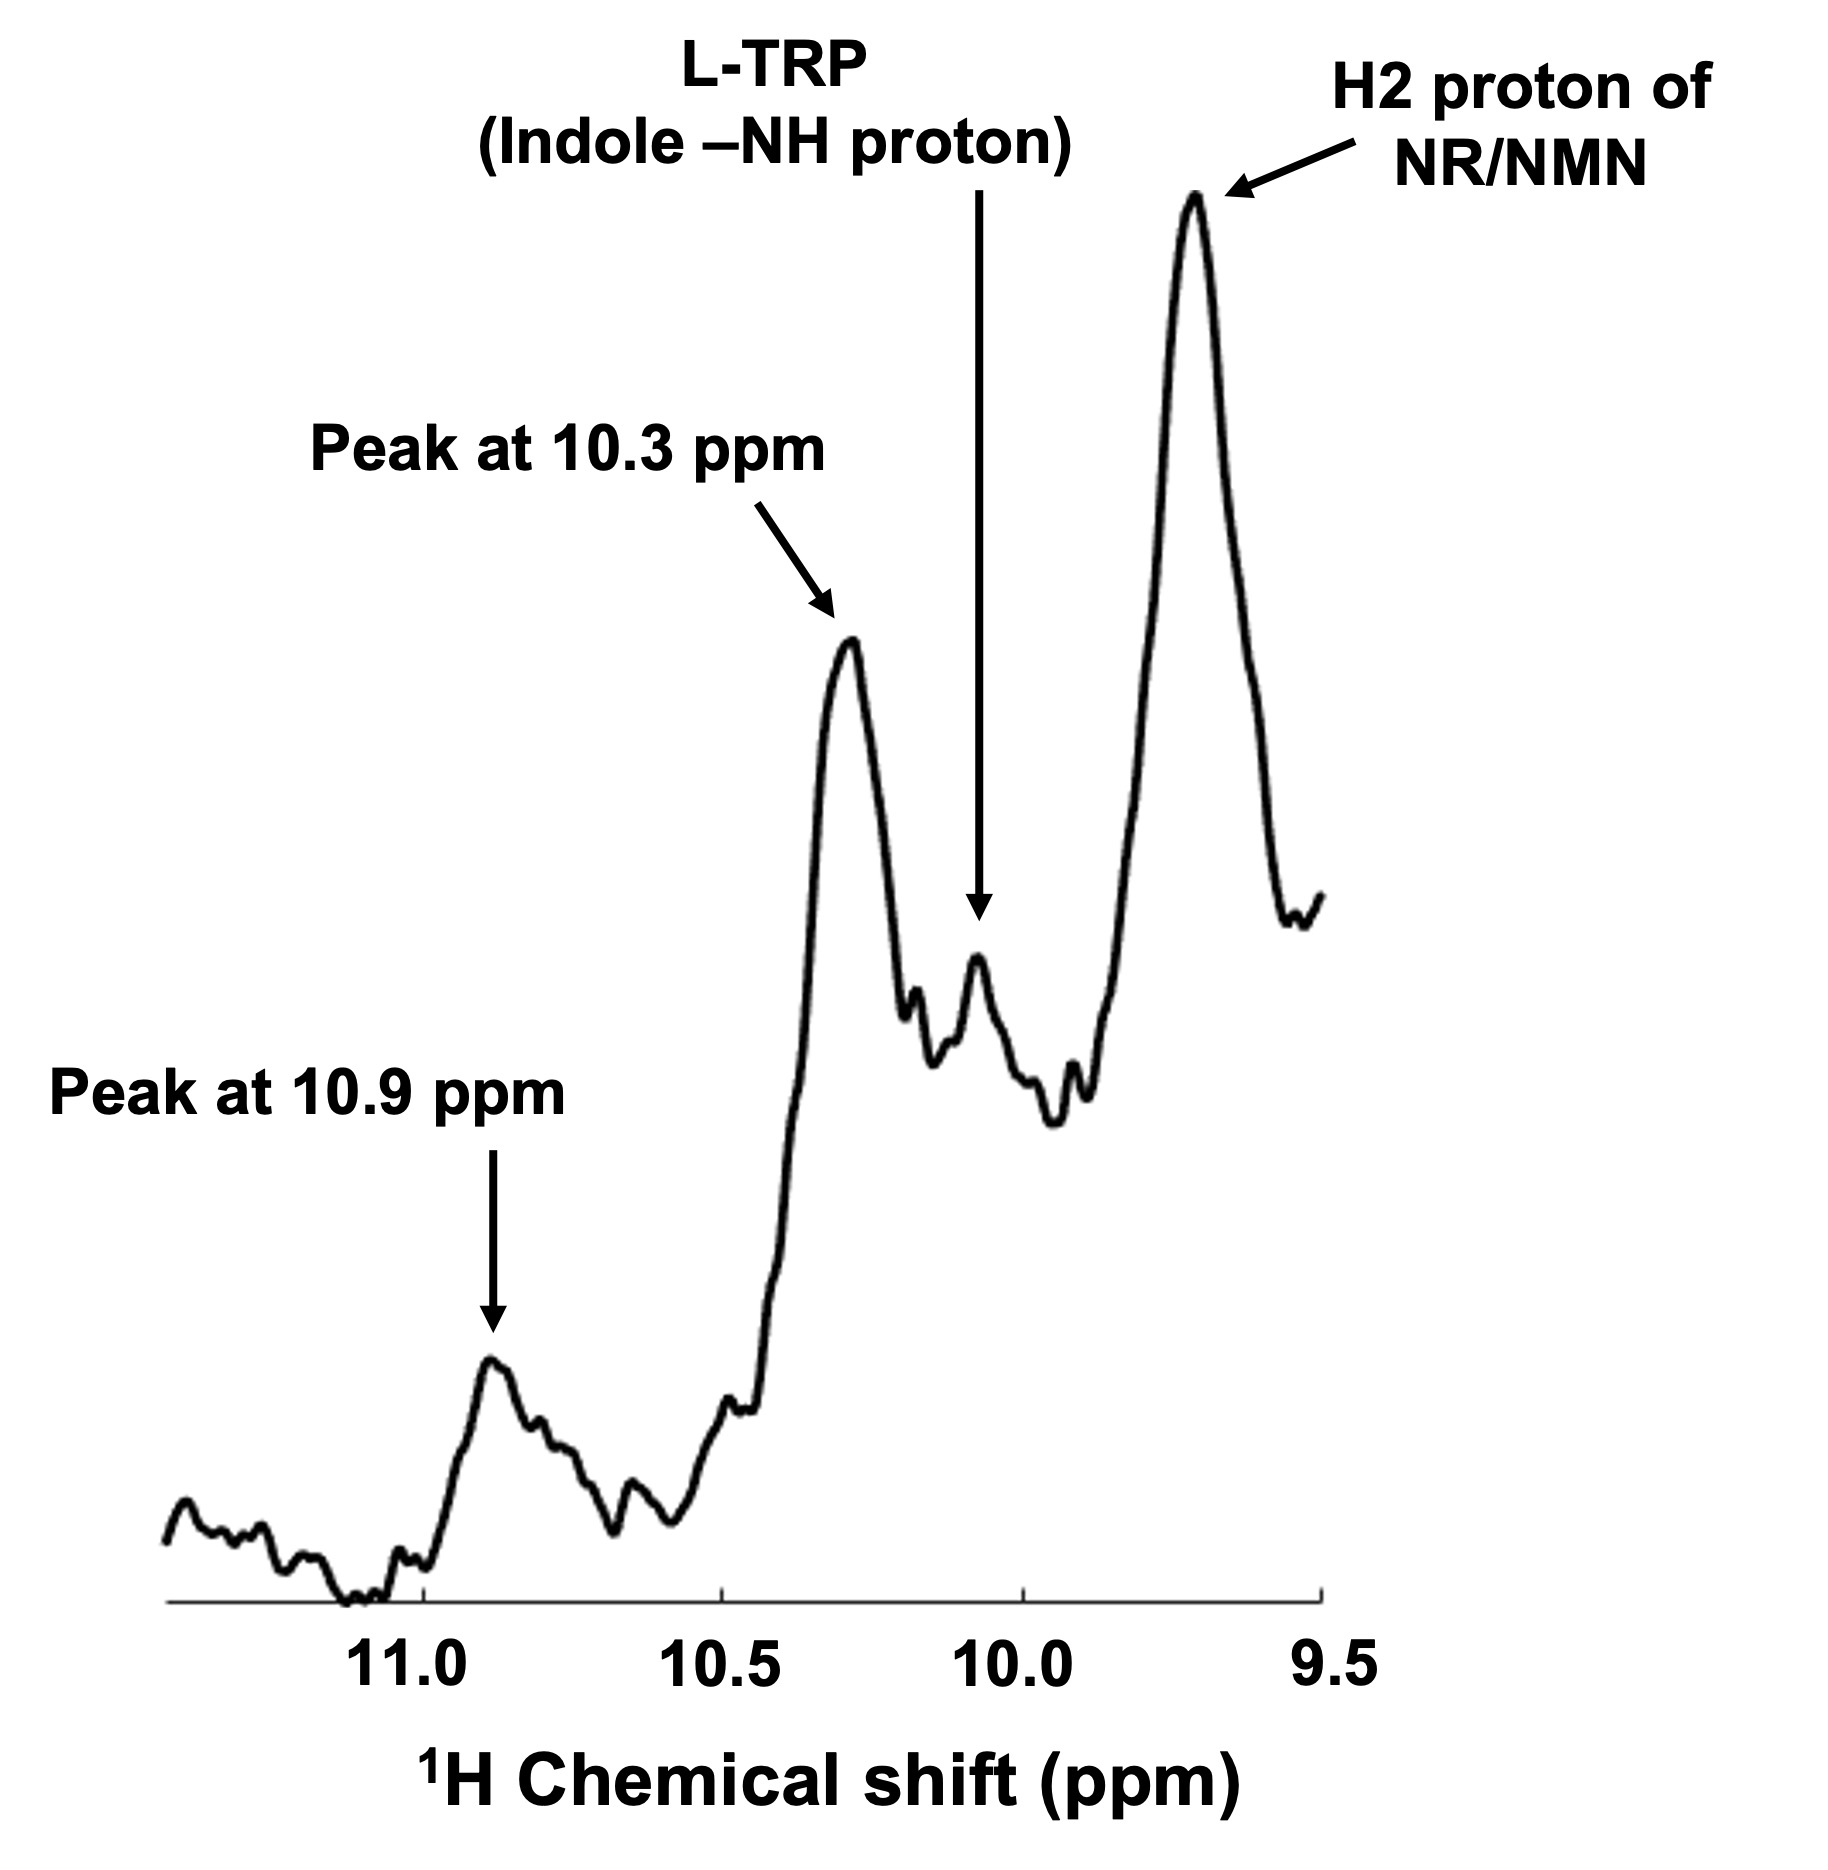
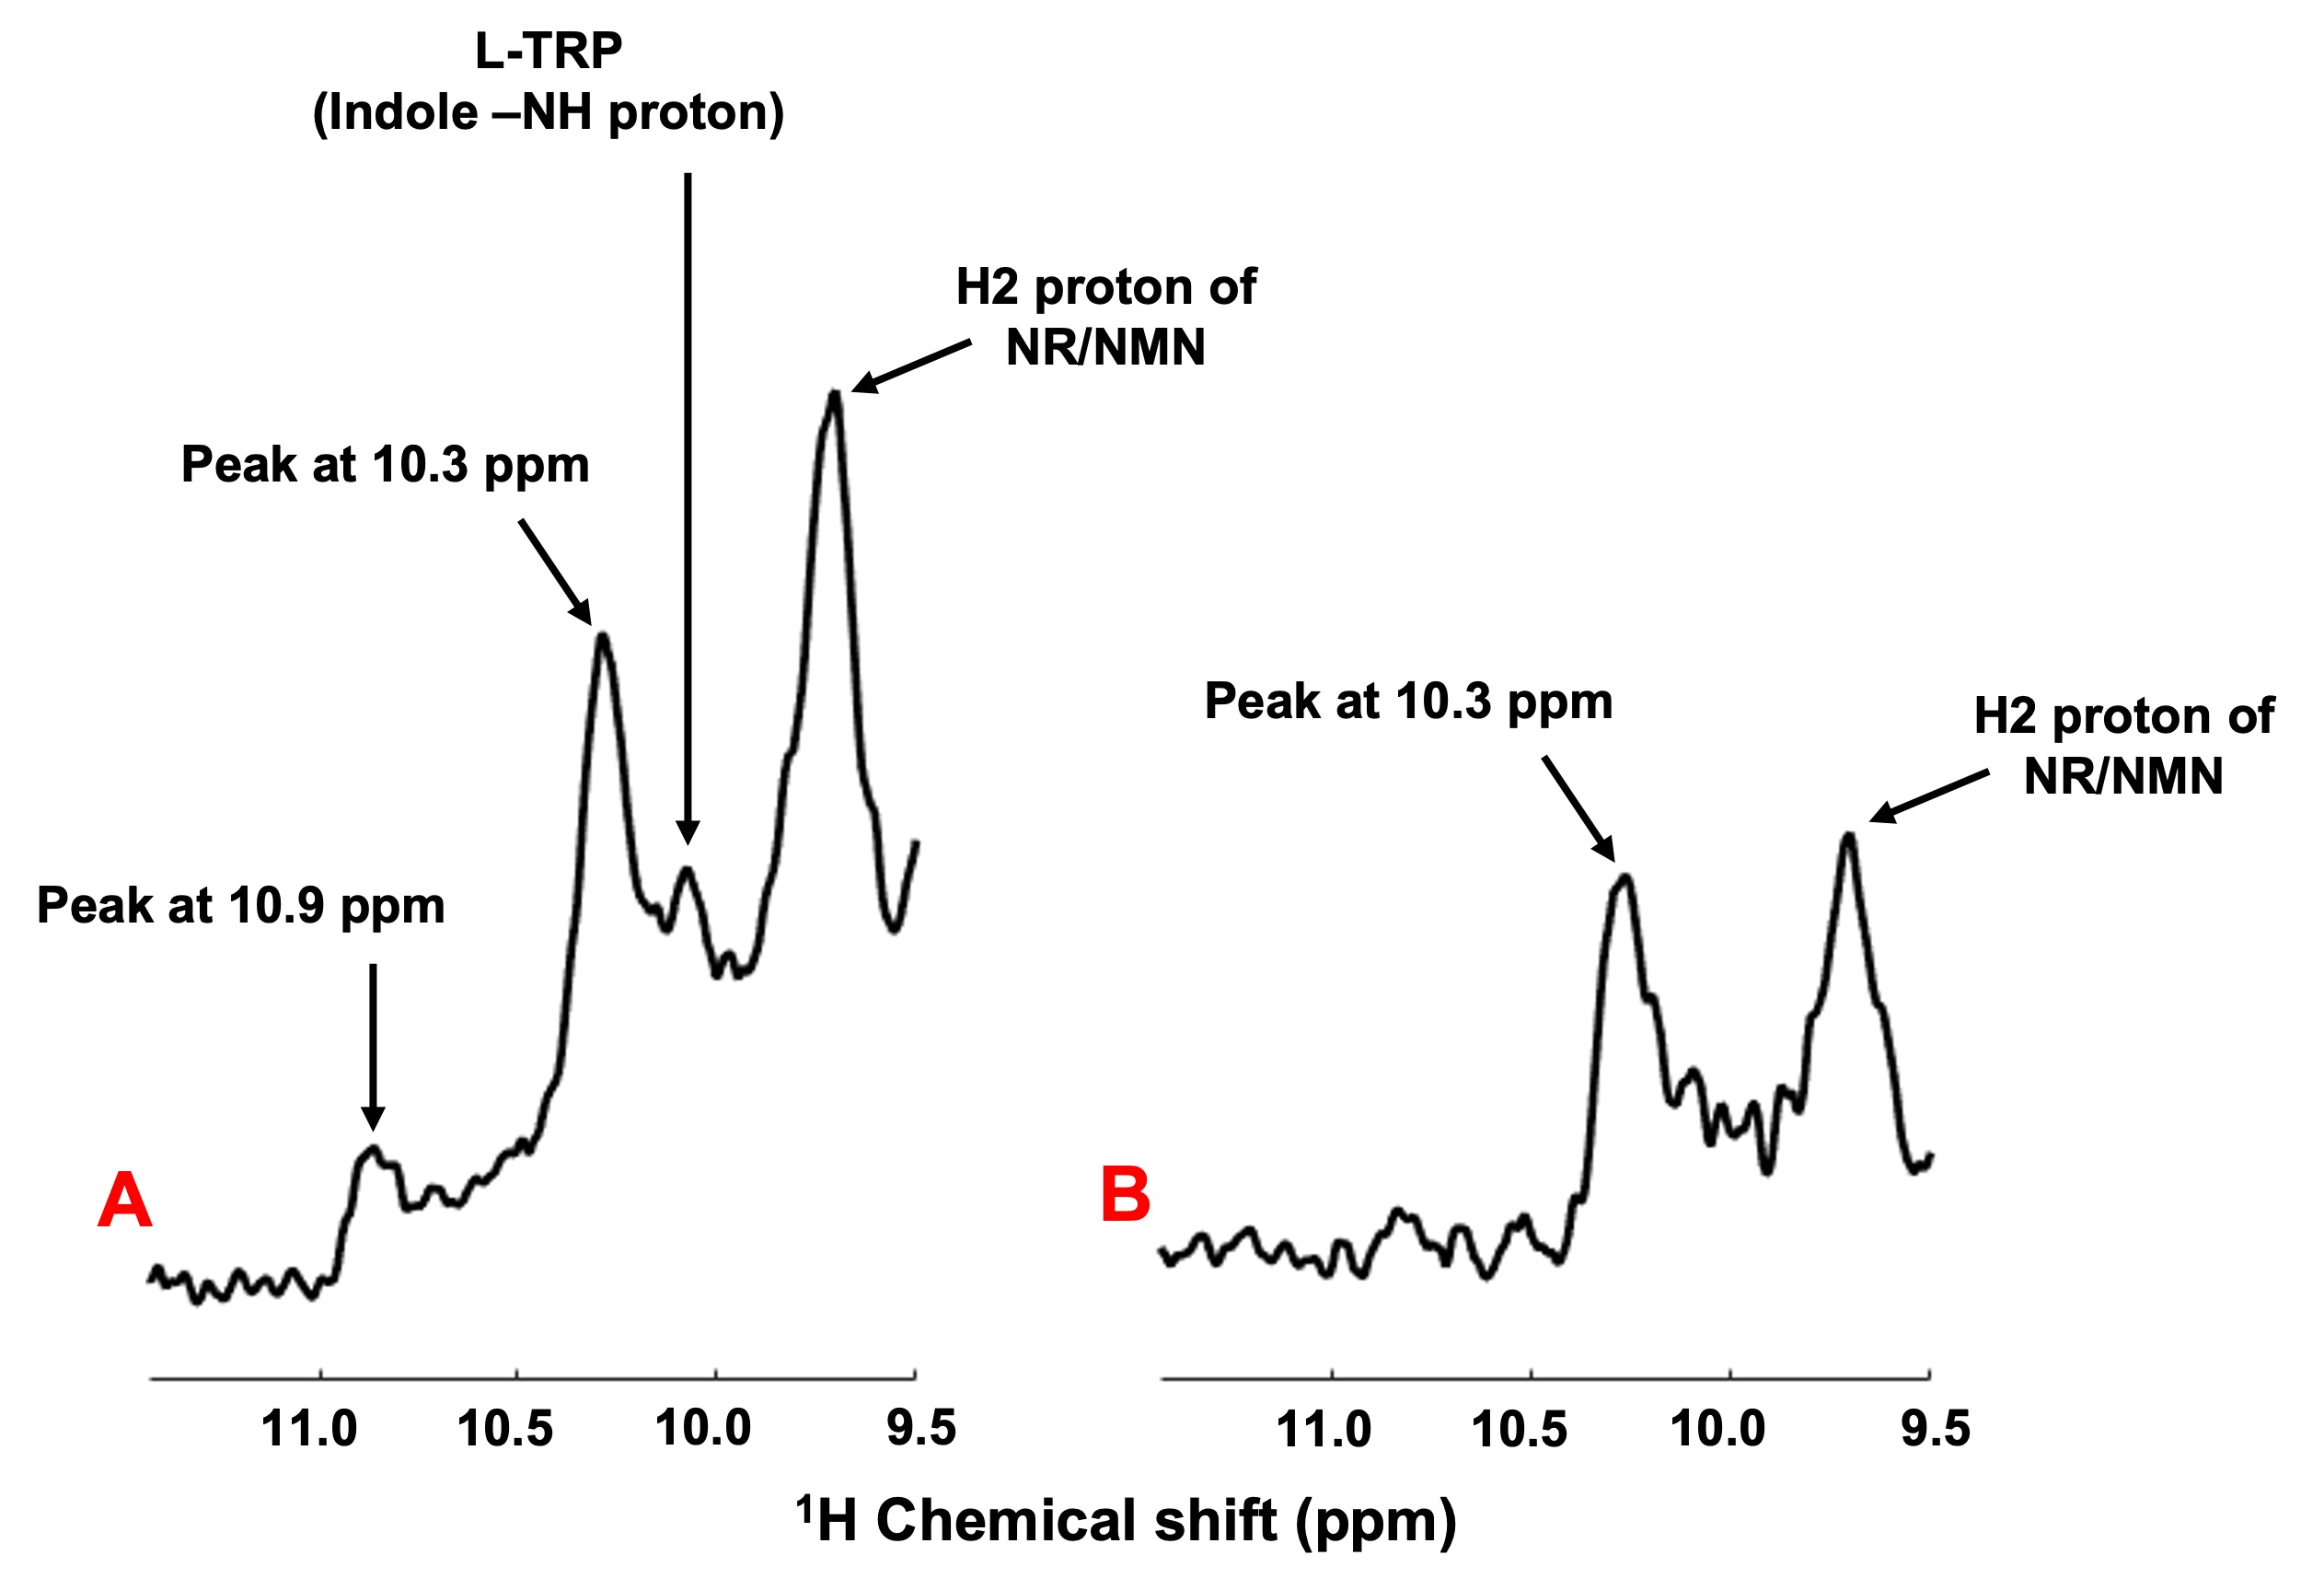
A representative voxel from which the DF 1H MRS was acquired from the calf muscle of one of the volunteers in vivo is shown in Figure 1. In all the five volunteers scanned, we have consistently identified new resonances with peak center at ~10.1, 10.3, and 10.9 ppm. A representative spectrum from one of the volunteers is shown in Figure 2 with the new peaks identified at ~10.1, 10.3, and 10.9 ppm. These new peaks except the one at 10.1 ppm seems to be specific to calf muscle metabolism as the same was not identified in the downfield spectra of the human brain in vivo with similar voxel size (data not shown). Water saturation had maximal effect on the resonances at 10.1 and 10.9 ppm with signal almost completely quenched while the peak at 10.3 ppm had minimal effect as shown in Figure 3.DISCUSSION
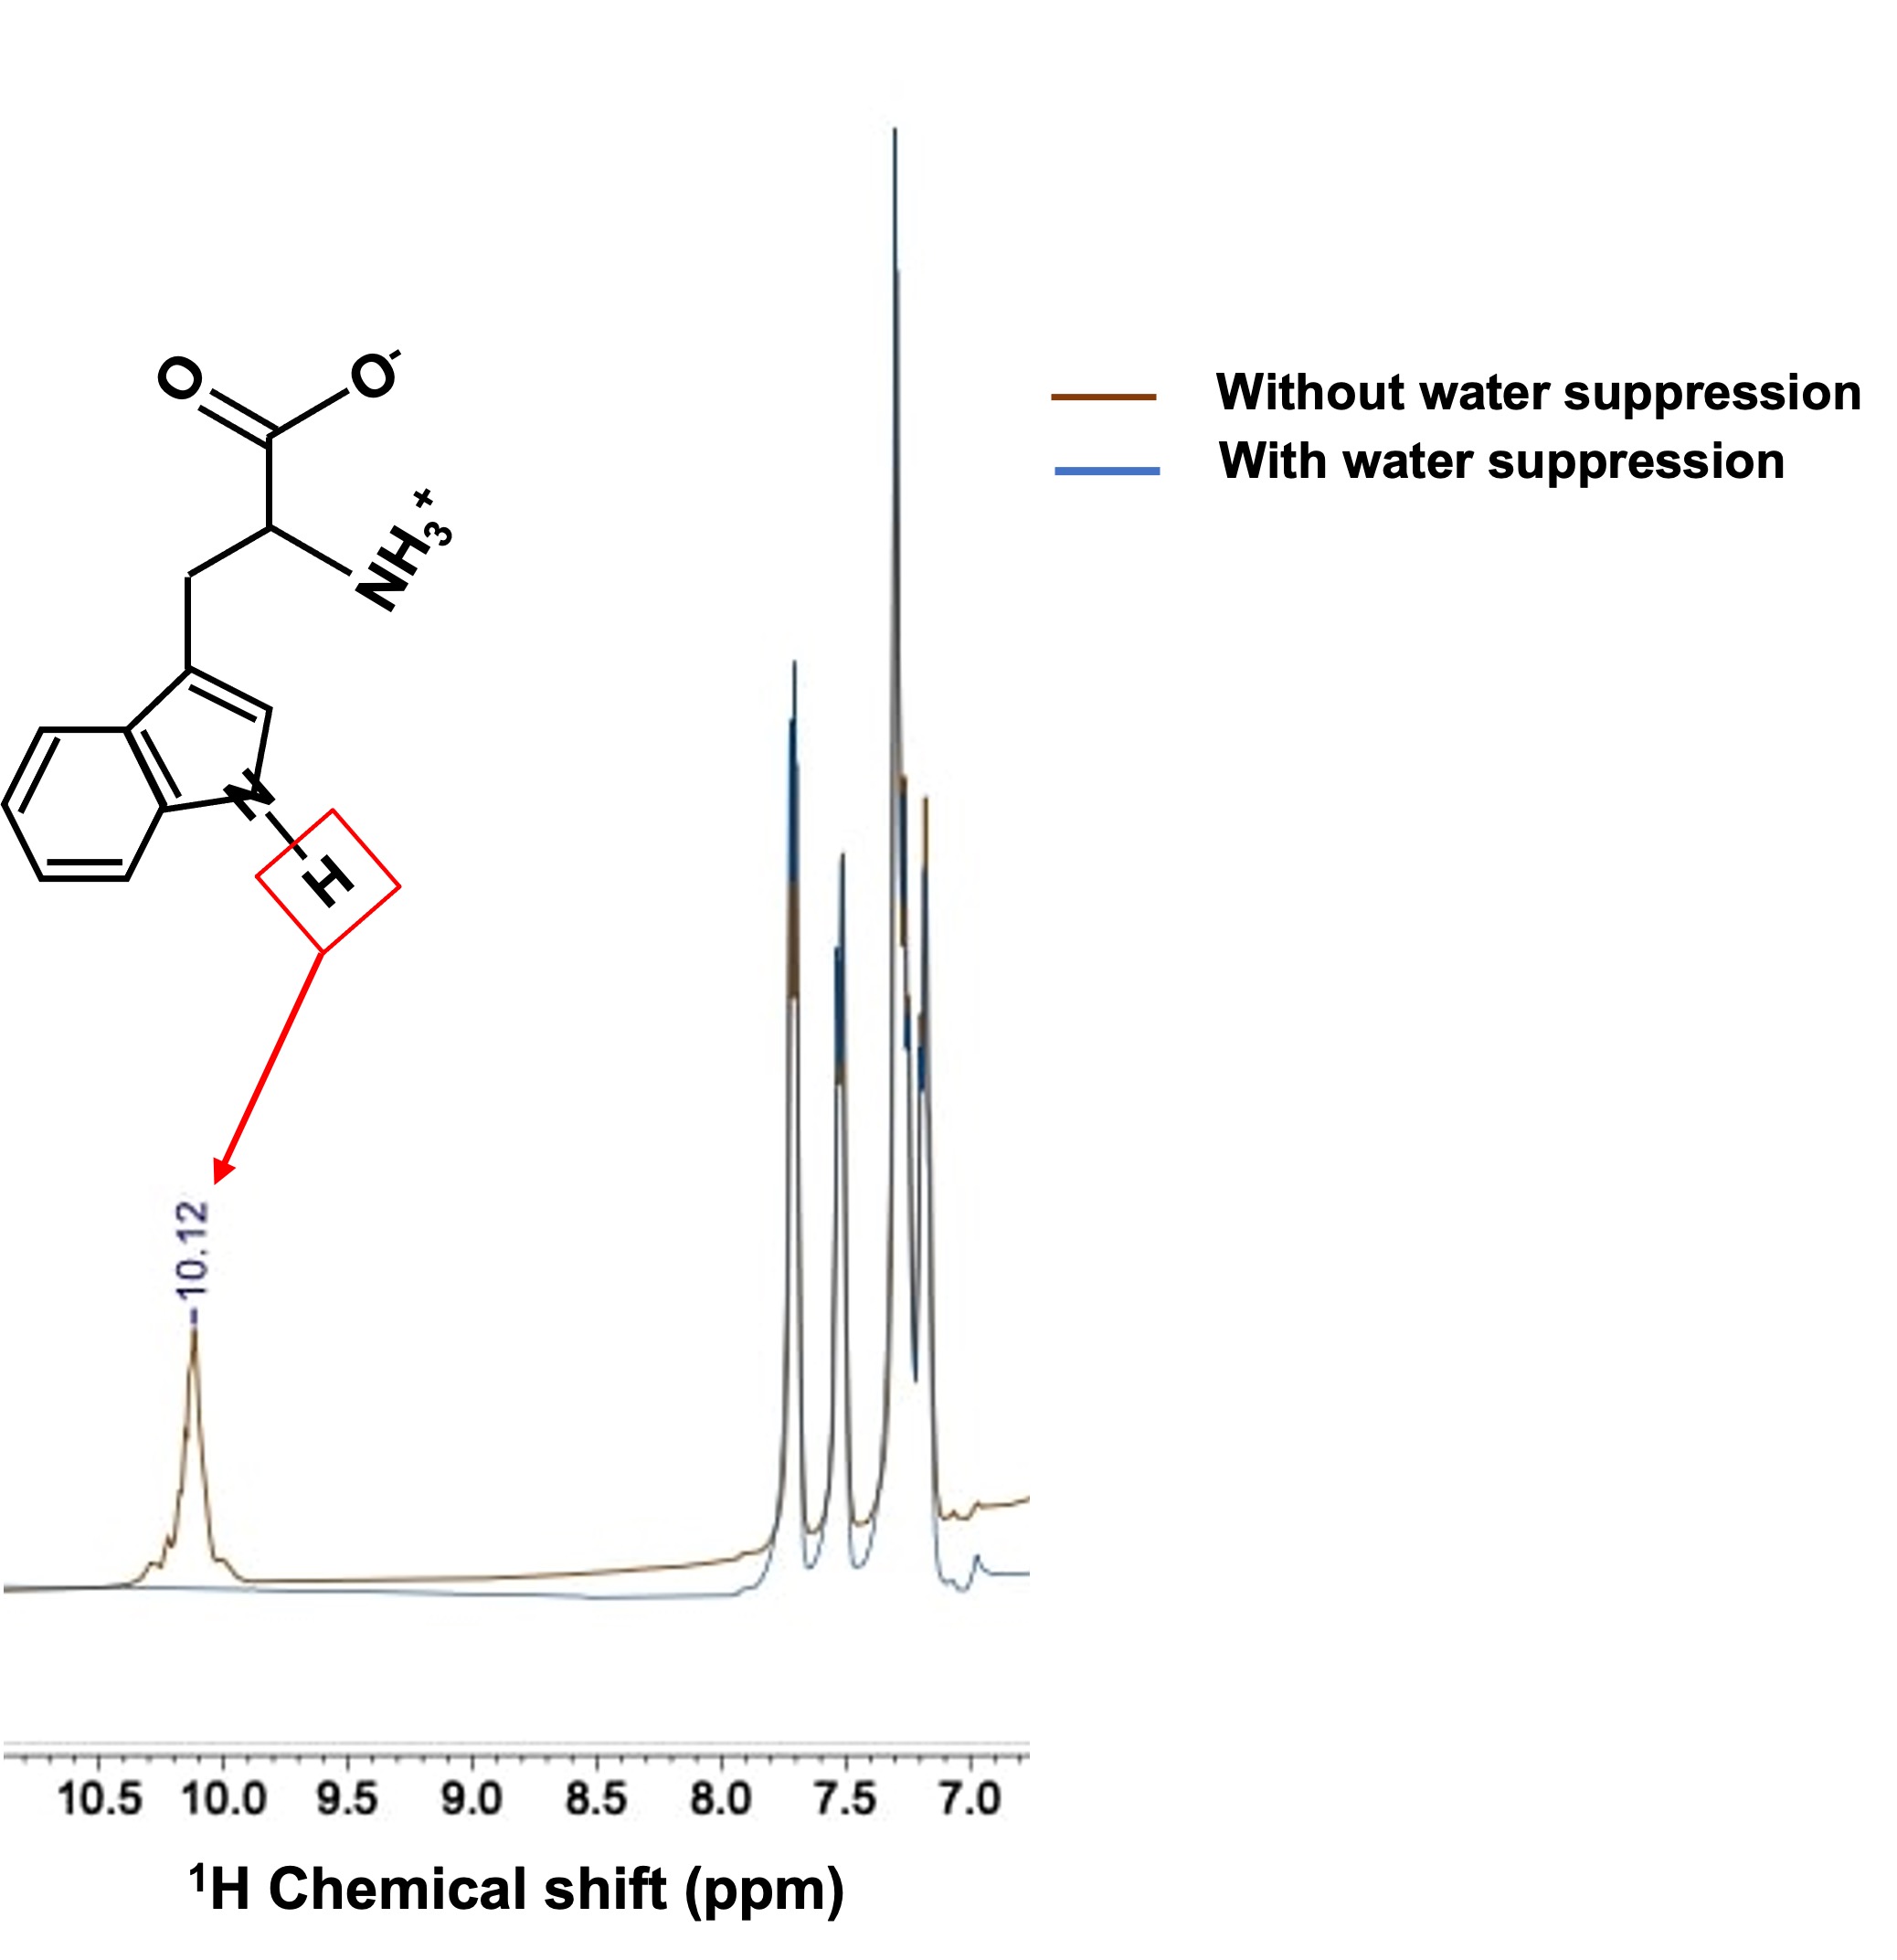
This is for the first time we have detected additional new peaks at ~10.1, 10.3 and 10.9 ppm in the down-field spectra of calf muscle in vivo at 7T. Some of these resonances especially 10.3 and 10.9 ppm, appear to be a feature of muscle metabolism as the same were not observed from the DF 1H MRS of human brain8. The new resonance we have identified at 10.1 ppm could be from L-Tryptophan (L-TRP). The chemical structure and high-resolution NMR spectrum of this molecule are shown in Figure 4 and show good agreement with the chemical shift of the observed resonance in vivo. Since L-TRP is a NAD precursor, it is reasonable that it would be detected when it is converted subsequently to NAD+ by the de novo pathway in calf muscle metabolism. The other two peaks identified at 10.3 and 10.9 ppm are yet to be assigned. While the 10.1 and 10.9 ppm resonances are quenched with water saturation, there is only a minimal effect at 10.3 ppm peaking indicating that the later has minimal cross-relaxation/chemical exchange with water. Future studies are needed to confirm these findings using muscle tissue samples and phantoms of the potential metabolites with expected resonances in the desired chemical shift range. Nevertheless, it is intriguing that some resonances are observed in calf muscle and not brain and is also a topic of future investigation.CONCLUSION
This is the first ever reported finding of new resonances at ~10.1, 10.3 and 10.9 ppm in the DF 1H MRS some of which are specific to calf muscle at 7T. We speculate that the peak at 10.1 might be from L-TRP whereas the peaks identified at 10.3 and 10.9 ppm are yet to be assigned.Acknowledgements
Research reported in this publication was supported by the National Institute of Biomedical Imaging and Bioengineering of the National Institutes of Health under award Number P41EB029460 and by the National Institute of Aging of the National Institute of Health under award Number R56AG062665, R01AG071725. Research is supported also by R01 HL137984.References
1. Nanga RPR, Elliott M, Swain A, et al. Detection of a new resonance in human calf muscle in vivo at 7.0T using the down-field MRS. ISMRM&SMRT Annual Meeting and Exhibition 2022.
2. de Graaf RA, Behar KL. Detection of cerebral NAD(+) by in vivo (1)H NMR spectroscopy. NMR Biomed. 2014;27:802-809.
3. de Graaf RA, De Feyter HM, Brown PB, et al. Detection of cerebral NAD+ in humans at 7T. Magn Reson Med. 2017;78:828-835.
4. Bagga P, Hariharan H, Wilson NE, et al. Single-voxel 1H MR spectroscopy of cerebral nicotinamide adenine dinucleotide (NAD+) in humans at 7T using a 32-channel volume coil. Magn Reson Med. 2020;83:806-814.
5. Fichtner ND, Henning A, Zoelch N, Boesch C, Kreis R. Elucidation of the downfield spectrum of human brain at 7T using multiple inversion recovery delays and echo times. Magn Reson Med. 2017;78:11-19.
6. Fitchner ND, Giapitzakis I-A, Avdievich N, et al. In vivo characterization of the downfield part of 1H MR spectra of human brain at 9.4T: magnetization exchange with water and relation to conventionally determined metabolite content. Magn Reson Med. 2018;79:2863-2873.
7. Geen H, Freeman R. Band-selective radiofrequency pulses. J Magn Reson. 1991;93:93-141.
8. Nanga RPR, Elliott MA, Swain A, et al. Identification of L-Tryptophan by down-field 1H MRS: A precursor for brain NAD+ and Serotonin syntheses. Magn Reson Med. 2022;6:2371-2377.
Figures