0730
Diffusion-relaxation correlation spectroscopic imaging for evaluating response to neoadjuvant therapy in locally advanced rectal cancer
Xixi Zhao1, Wentao Hu2, Honglei Hu1, Chuyao Chen1, Yongming Dai2, and Yikai Xu1
1Department of Medical Imaging Center, Nanfang Hospital, Southern Medical University, Guangzhou, China, 2MR Collaboration, Central Research Institute, United Imaging Healthcare, Shanghai, China
1Department of Medical Imaging Center, Nanfang Hospital, Southern Medical University, Guangzhou, China, 2MR Collaboration, Central Research Institute, United Imaging Healthcare, Shanghai, China
Synopsis
Keywords: Digestive, Cancer
Different treatment strategies should be applied to locally advanced rectal cancer (LARC) patients achieving different response after neoadjuvant chemoradiotherapy (nCRT). The purpose of this study was to determine the diagnostic performance of diffusion-relaxation correlation spectroscopic imaging (DR-CSI) in discriminating the pathological complete response (pCR) to nCRT in LARC. Compared to non-pCR group, pCR group showed significantly decreased average DR-CSI VD. ROC curve analysis indicated that the VD has better diagnostic performance in distinguishing pCR from non-pCR patients than traditional ADC and T2 value.Purpose
Neoadjuvant chemoradiotherapy (nCRT) followed by total mesorectal excision (TME) has become a standard treatment in patients with locally advanced rectal cancer (LARC). After nCRT, approximately 10%–30% of LARC patients achieved a pathologic complete response (pCR), thus proposed for a wait-and-watch policy, with similar disease-free survival and overall survival benefit to surgery. However, the accuracy of traditional clinical and radiologic indicators in tumor response evaluation is poor1,2. Conventional quantitative MRI methods could to some extent help this diagnosis process, but is currently limited by accuracy or reliability, the conclusions have been diverse and inconsistent. This is partially due to the complex microstructure of both rectum itself and residual tumor tissue, which could hardly be detected by conventional MRI indicators due to the average effect from a relatively large voxel.The recently developed multi-dimensional correlation MRI could obtain compositional information with both spectral and spatial distribution3,4. The purpose of this study was to determine the diagnostic performance of diffusion-relaxation correlation spectroscopic imaging (DR-CSI) in discriminating the pathological complete response (pCR) to nCRT in LARC.
Materials and Methods
Thirty-five patients (twelve females, mean age 53.9±14.2 years; twenty-three males, mean age 55.7±10.6 years) with LARC underwent examination by a 3.0T MRI scanner (uMR780, United Imaging Healthcare, Shanghai, China) after nCRT (1 week before surgery). Surgical histopathologic analysis was the reference standard for pCR. DR-CSI assume that acquired signal S of a single voxel obeys: $$S(b,TE)\int\int f(D,T2){e}^{-bD}{e}^{TE/T2}\text{d}D\text{d}T2$$ where D is the diffusivity, and f(D,T2) is the spectrum intensity we need. Data were acquired using 24 DWI images with 6 b-values (0, 200, 500, 800, 1500, 2000 s/mm2) combining 4 TEs (102, 128, 154, 180 ms). Region of interests (ROI) were decided in rectum on 5 slices. Diffusivity-T2 spectra were divided into 4 compartments, A (low diffusivity, short T2), B (high diffusivity, long T2), C (high diffusivity, long T2) and D (low diffusivity, long T2). Dividing boundaries (diffusivity 3×10⁻³ mm2/s, T2 60 ms, Figure 1) were chosen according to foreknowledge of rectum. DR-CSI compartment volume fraction Vm for each compartment m was acquired in each voxel and averaged through whole ROI, and was compared between the pCR group and the non-pCR group using Mann-Whitney U test. The ROC curve analysis was performed to assess the diagnostic performance of Vm, traditional ADC and T2 value in distinguishing pCR from non-pCR patients.Results
Ten patients achieved pCR (28.6%) and twenty-five patients were non-pCR (71.4%). D-T2 spectra were obtained for all patients. Two main peaks, separately with high (>4×10⁻³ mm2/s) and low diffusivity (about 1.5×10⁻³ mm2/s), were visible in spectra of all patients. Different width of peaks could be observed along the T2 dimension. Volume fraction mappings were obtained for all patients (Figure 1).Main statistical results were reported in Table 1, 2 and Figure 2, 3. Compared to non-pCR group, pCR group showed significantly decreased average VD (6.1±2.0% vs 7.9±2.3%, p=0.037,). Decreased VC (2.6±0.8% vs 3,4±1.6%) were also found in the pCR group, but is only marginally significant (p=0.186). No significant difference was found for VA and VB in the two groups. ROC curve analysis indicated that the VD (AUC 0.748) has good diagnostic performance in distinguishing pCR from non-pCR patients, better than traditional ADC (AUC 0.540) and T2 value (AUC 0.692).
Discussion
This is the first study to evaluate response to nCRT in patients with LARC by DR-CSI in vivo. Volume fraction mapping of Compartment D (low D, long T2) was significantly decreased in pCR group. The compartment D with a slow diffusivity and higher T2 value was supposed to correspond to residual tumor after nCRT, which need to be confirmed in further researches. However, in accordance with our results, Ge et al. and Liu et al. reported a more noticeable decrease in the T2 value of the GRs (good responders), which may due to development of collagen fibers during CRT that reduced the water content of the tumor5,6. Slow-diffusion compartments were possibly associated with cellularity instead of perfusion, which may be more relative to the status of residual tumor tissues. Lu et al. reported that the pCR group had higher post D values (diffusivity of slow-diffusion compartment) than the non-pCR group after nCRT in LARC using the intra-voxel incoherent motion (IVIM) model7.Volume fraction mappings, especially V D mapping, may provide help in recognizing areas of residual tumor and identifying the pCR to nCRT for LARC and thus holding potential value for personalized subsequent treatment.
Conclusion
This study illustrated the ability of DR-CSI volume fraction VD for evaluating response to neoadjuvant chemoradiotherapy in locally advanced rectal cancer.Acknowledgements
No acknowledgement found.References
1. Kalisz K R, Enzerra M D, Paspulati R M. MRI evaluation of the response of rectal cancer to neoadjuvant chemoradiation therapy[J]. Radiographics, 2019, 39(2): 538-556.2. Park S H, Cho S H, Choi S H, et al. MRI assessment of complete response to preoperative chemoradiation therapy for rectal cancer: 2020 guide for practice from the Korean Society of Abdominal Radiology[J]. Korean journal of radiology, 2020, 21(7): 812.
3. Kim D, Doyle EK, Wisnowski JL, et al. Diffusion-relaxation correlation spectroscopic imaging: A multidimensional approach for probing microstructure[J]. Magnetic Resonance in Medicine, 2017, 78(6): 2236-2249
4. Benjamini D, Basser PJ. Multidimensional correlation MRI [J]. NMR in Biomedicine, 2020, 33(12): e4226.
5. Ge Y, Jia Y, Li X, et al. T2 relaxation time for the early prediction of treatment response to chemoradiation in locally advanced rectal cancer[J]. Insights into imaging, 2022, 13(1): 1-9.
6. Liu L, Yin B, Geng D Y, et al. Changes of T2 relaxation time from neoadjuvant chemotherapy in breast cancer lesions[J]. Iranian Journal of Radiology, 2016, 13(3).
7. Lu W, Jing H, Ju-Mei Z, et al. Intravoxel incoherent motion diffusion-weighted imaging for discriminating the pathological response to neoadjuvant chemoradiotherapy in locally advanced rectal cancer[J]. Scientific Reports, 2017, 7(1): 1-9.
Figures
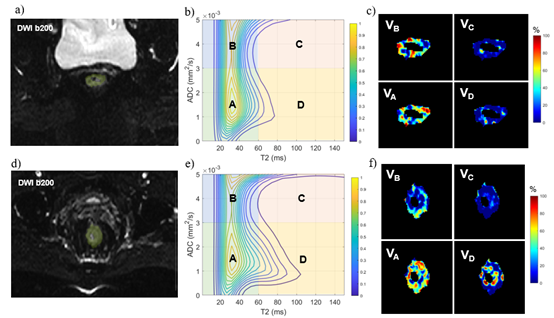
Figure 1. a-c: A 40-Y woman with pCR to nCRT; d-f: A 74-Y woman with non-pCR. a,d: DWI images (TE102, b200) with ROI labelled; b,e: DR-CSI spectra divided into 4 compartments; c.f: V maps of the 4 compartments.
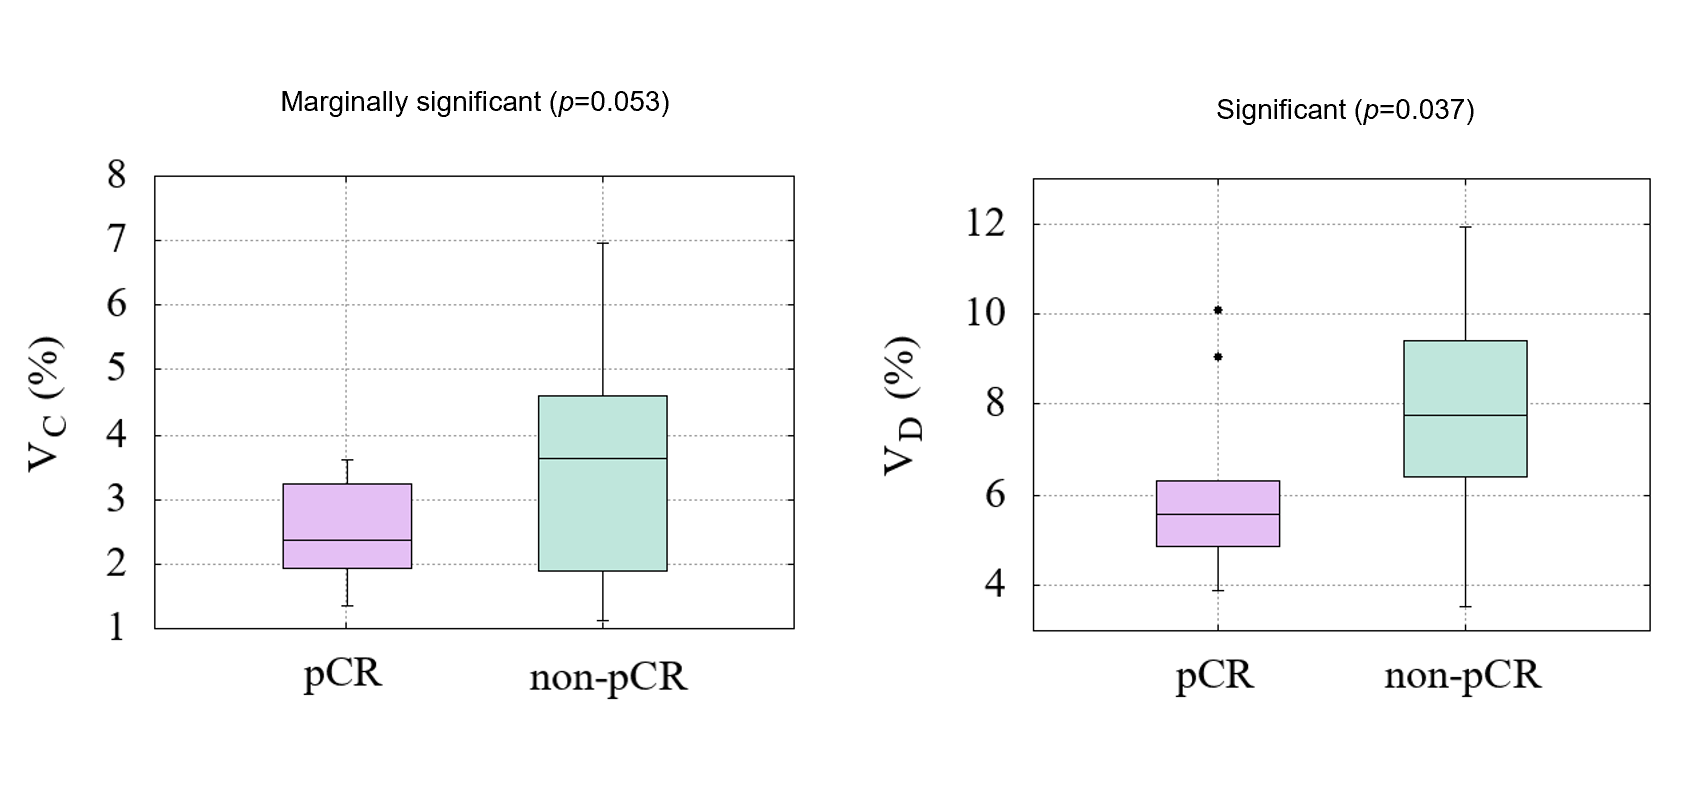
Figure 2. Boxplot of volume fractions Vc and VD in
pCR and non-pCR groups.
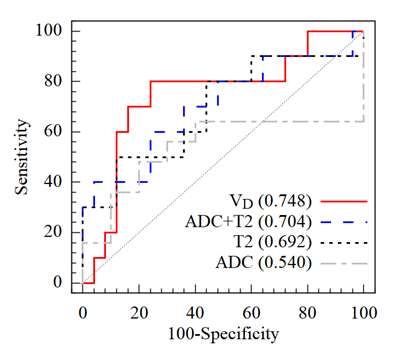
Figure 3. Diagnostic performance ROC of VD, conventional T2, ADC and T2 combining ADC in
distinguishing pCR from non-pCR patients.
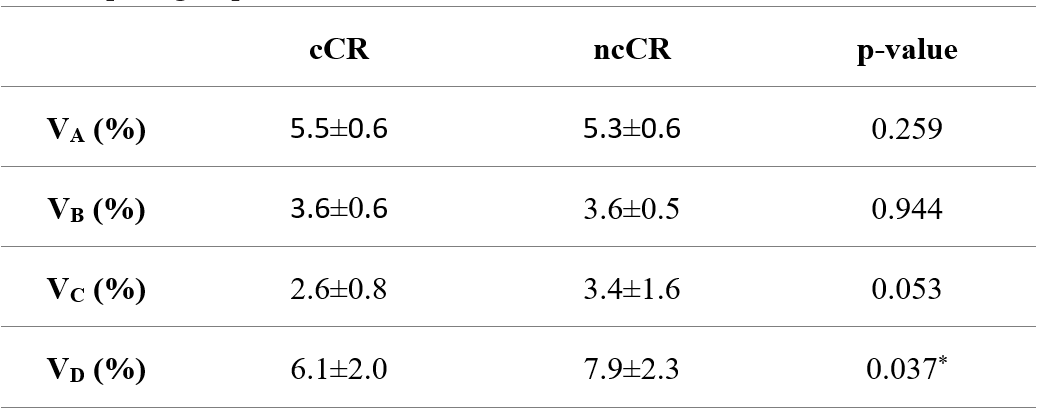
Table 1.
Comparison of Volume
fraction Vm for each compartment m
between
the pCR group and the non-pCR group.
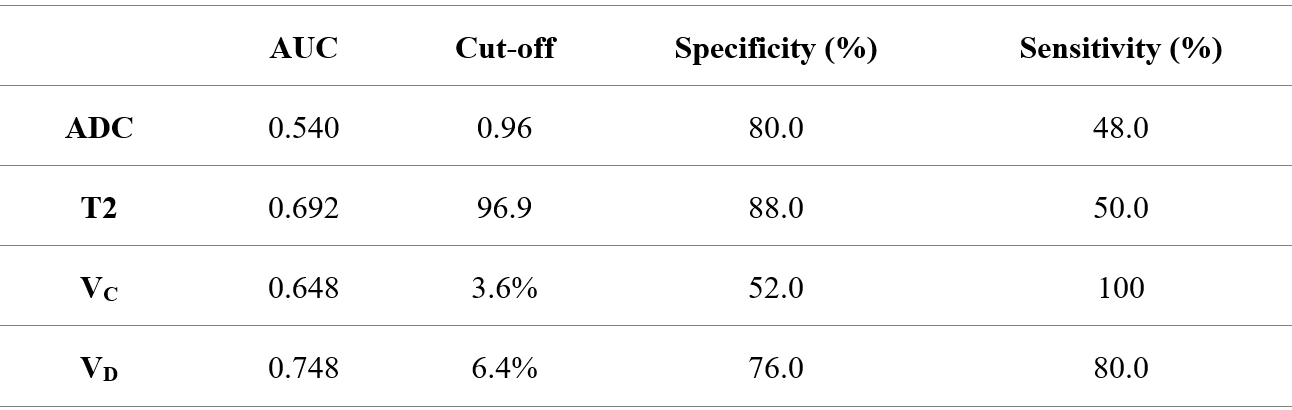
Table 2. The ROC curve analysis of VC, VD, traditional ADC and
T2 value in distinguishing pCR from non-pCR patients.
DOI: https://doi.org/10.58530/2023/0730