0725
Four Quadrant Vector Mapping of Hybrid Multidimensional MRI data for the diagnosis of prostate cancer1University of Chicago, CHICAGO, IL, United States, 2Sanford J. Grossman Center of Excellence in Prostate Imaging and Image Guided Therapy, Chicago, IL, United States
Synopsis
Keywords: Prostate, Cancer
This study introduces a new quantitative mapping technique referred to as “Four Quadrant Vector Mapping” of HM-MRI data, where each image voxel is represented as a vector within a 2D plot with components ‘∆T2/∆b’ and ‘∆ADC/∆TE’ with associated spatial coordinates and quadrant, distance and angle. Measured metrics provides effective cancer markers, with cancers associated with high PQ4, lower PQ2, and higher vector angle, and lower amplitude. Quadrant mapping parameters show promise for determining cancer aggressiveness as they are moderately correlated with Gleason score. Four quadrant mapping could be combined with the compartmental analysis of HM-MRI data to increase diagnostic accuracy.Introduction
While conventional mpMRI assumes T2 and diffusion to be completely independent and acquires T2 and DWI measurements separately, studies of optic nerve(1), brain(2) and the prostate(3) demonstrate that this is a faulty assumption. Sadinski et. al.(4) using Hybrid Multidimensional MRI (HM-MRI) showed that ADC and T2 change as a function of TE and b-values, and that this dependence is different for cancer and benign tissue. Chatterjee et. al.(5) used these changes along with distinct MRI properties of histologic components(6) to measure tissue composition (fractional volumes of stroma, epithelium and lumen) non-invasively, which have been validated with quantitative histology(7) and pathologists’ evaluations(8) of matched prostatectomy specimens.The purpose of this study is to introduce a new quantitative mapping technique referred to as “Four Quadrant Vector Mapping” of HM-MRI data, where each image voxel is represented as a vector within a 2D plot with components ‘∆T2/∆b’ and ‘∆ADC/∆TE’ with associated spatial coordinates and quadrant, distance and angle, and investigate its application to diagnose prostate cancer and determine cancer aggressiveness.
Materials and Methods
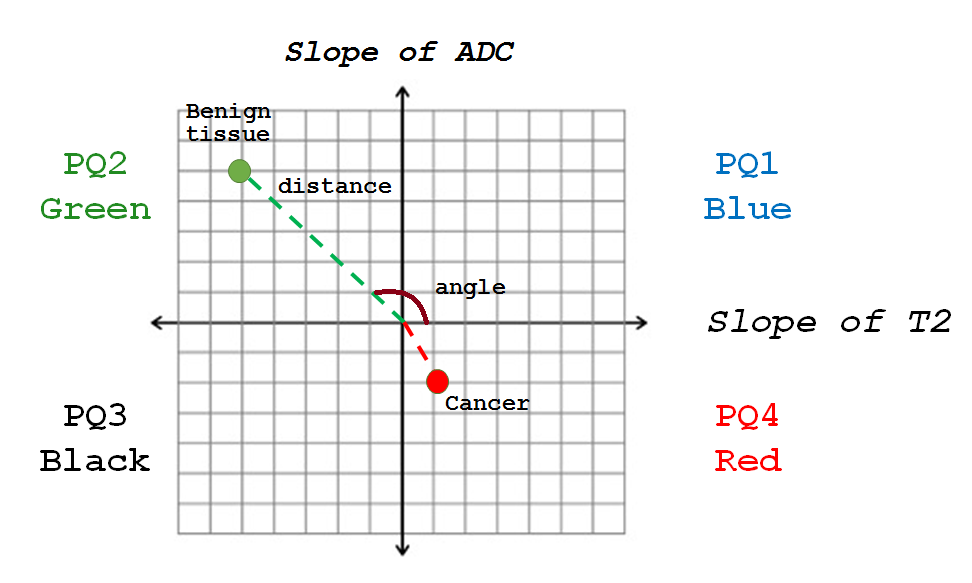
In this study involving retrospective analysis of prospectively collected data, 21 participants (mean age 65 years, mean PSA 6.9ng/ml) with biopsy-confirmed prostate cancer underwent MR imaging with a 3T Philips MR scanner prior to radical prostatectomy. Axial images using HM-MRI were acquired with all combinations of TE=47,75,100 ms and b-values of 0,750,1500 s/mm2.ADC and T2 were calculated at each TE and b-value, respectively, assuming mono-exponential signal decay on a voxel-by-voxel basis. Prostate Quadrant (PQ) mapping analysis represents HM-MRI data for each voxel as a color-coded vector in the 4-quadrant space with associated amplitude and angle information representing the change in T2 and ADC as a function of b-value and TE (slope of ADC with changing TE or ∆ADC/∆TE in the y-axis and slope of TE with changing b-value or ∆T2/∆b in the x-axis), respectively (Figure 1). Each quadrant is assigned a color – quadrant 1 or PQ1 (blue; 0-90⁰; ∆T2/∆b>0, ∆ADC/∆TE>0), quadrant 2 or PQ2 (green; 90-180⁰; ∆T2/∆b<0, ∆ADC/∆TE>0), quadrant 3 or PQ3 (black; 180-270⁰; ∆T2/∆b<0, ∆ADC/∆TE<0) and quadrant 4 (red; 270-360⁰; ∆T2/∆b>0, ∆ADC/∆TE<0). The amplitudes (distance from the origin where ∆T2/∆b and ∆ADC/∆TE=0) and angles of the vectors associated with each voxel were measured.
The difference was assessed by a one-way ANOVA with post hoc Tukey’s HSD test. Spearman correlation was performed between Gleason score and measured parameters. Receiver operating characteristic (ROC) analysis was used to evaluate the performance of parameters in differentiating cancer from benign prostatic tissue.
Results
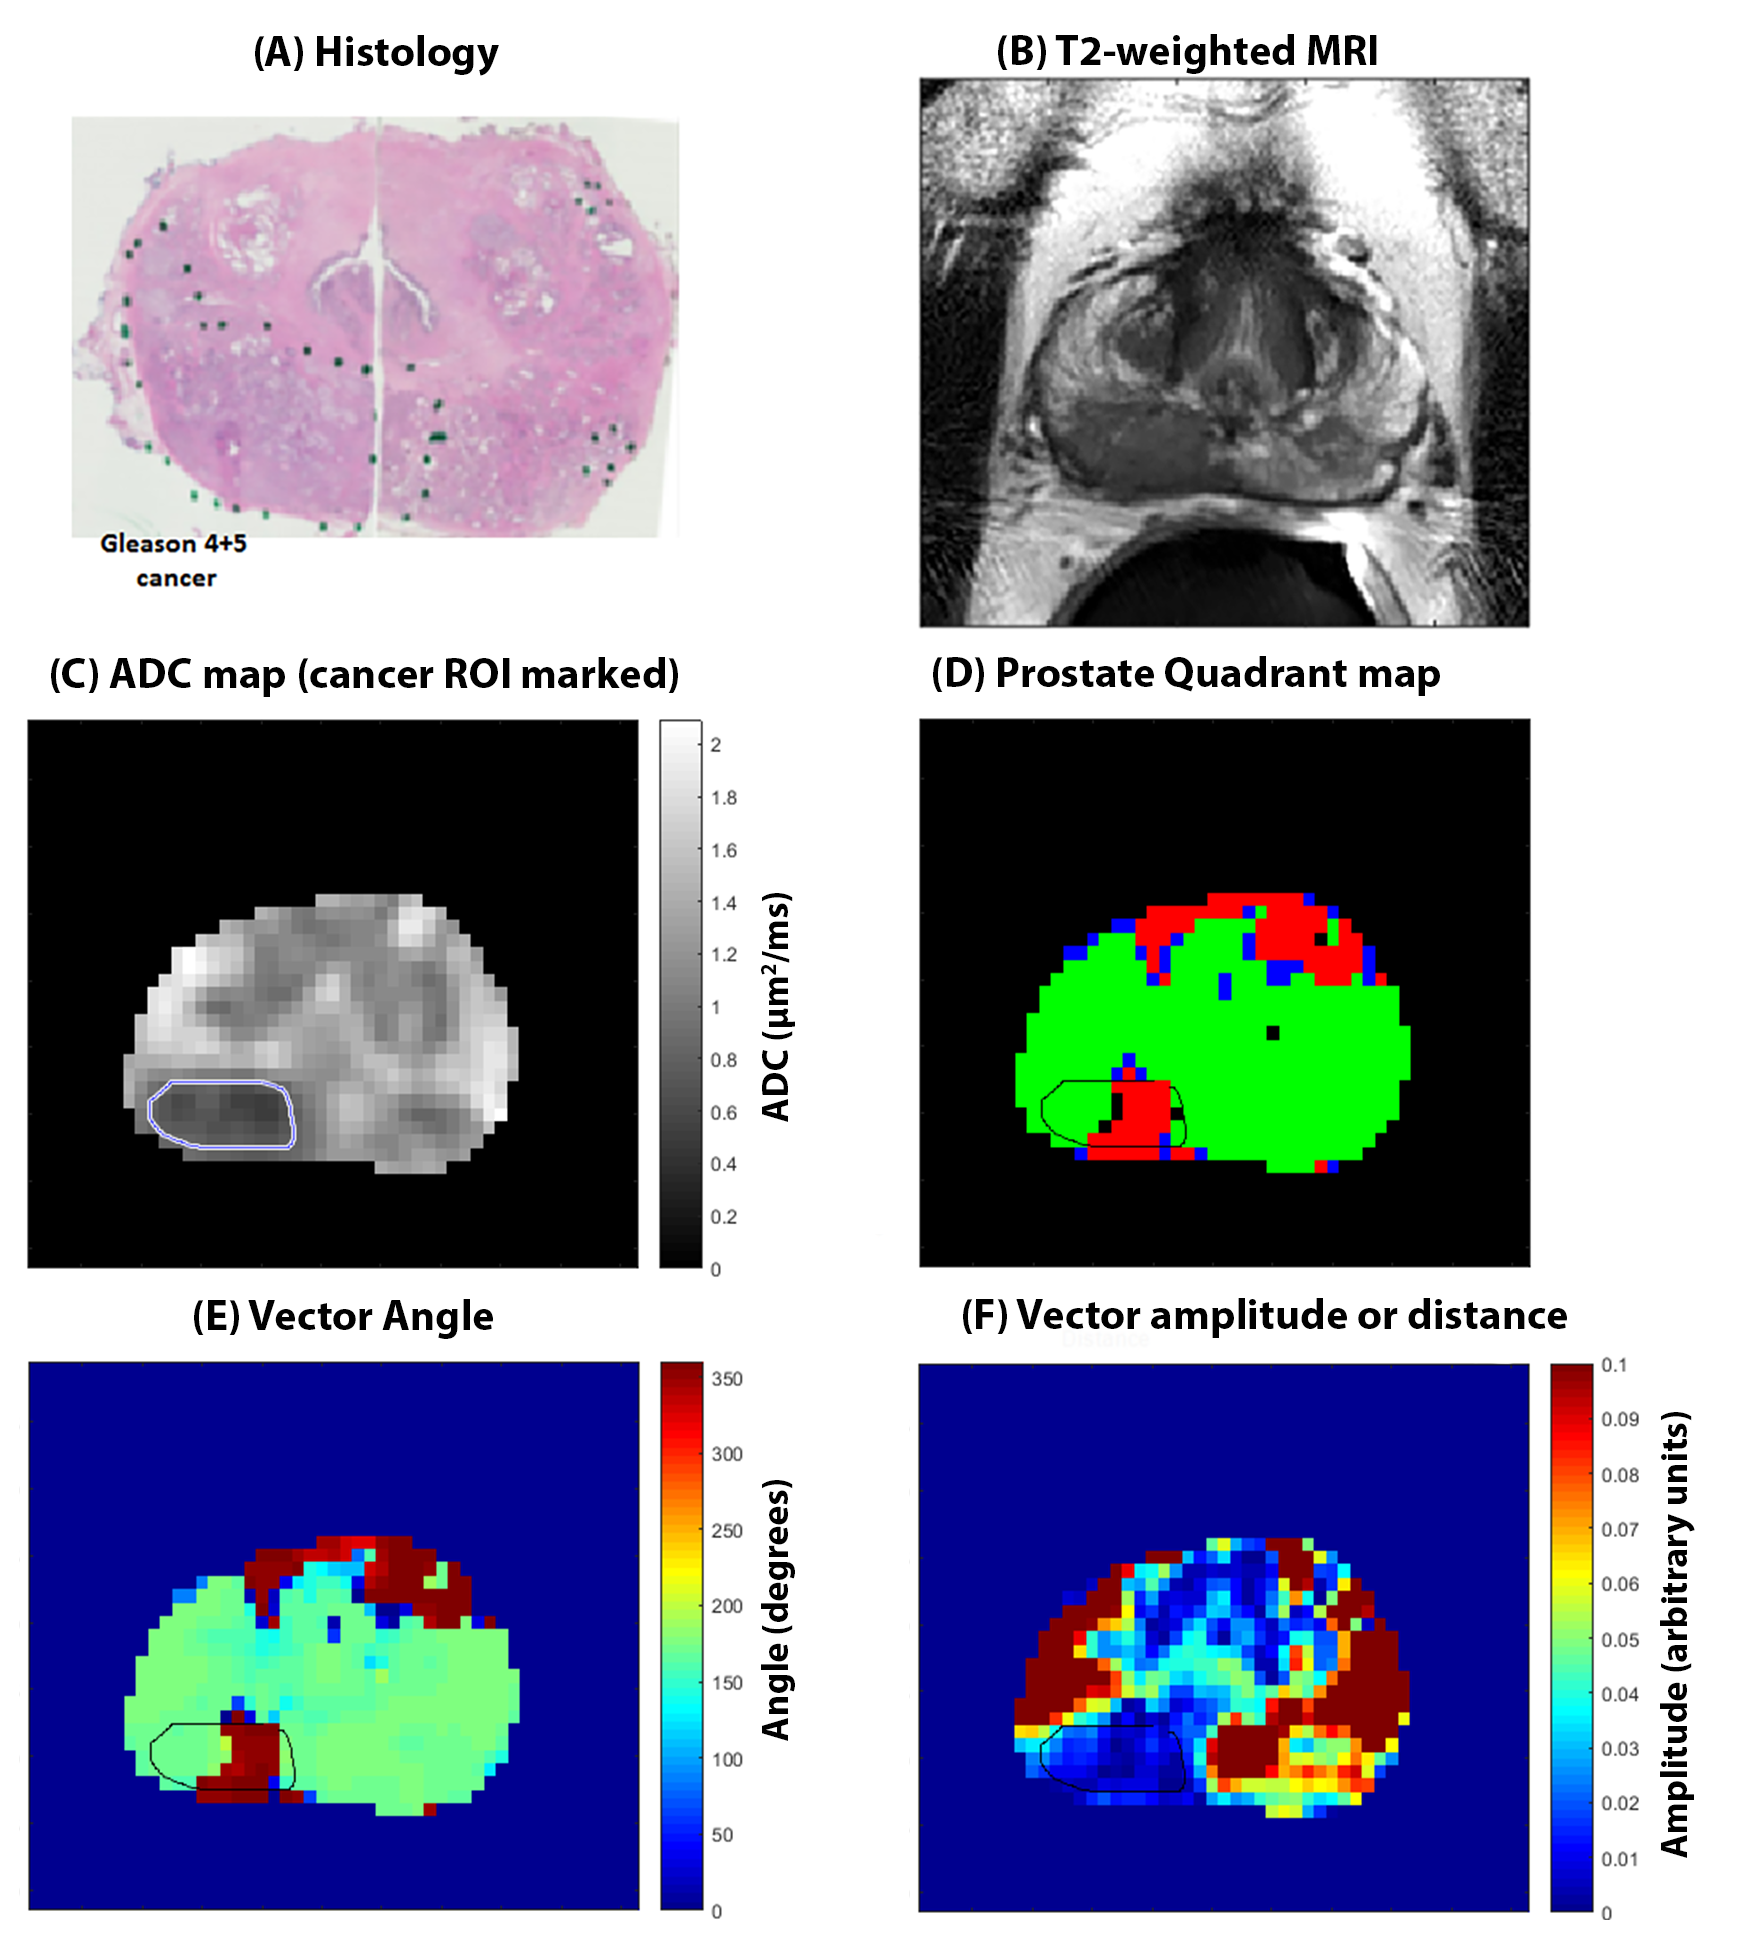
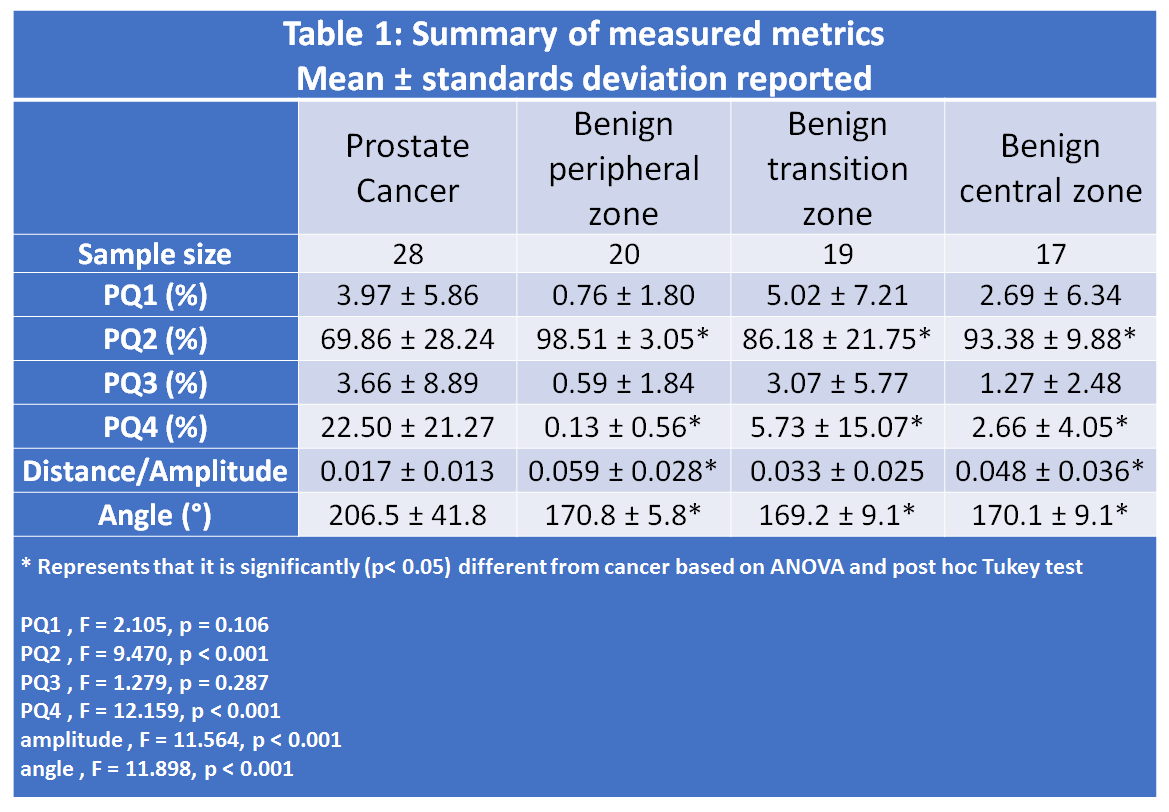
A total of 28 cancer ROIs and 70 benign tissue ROIs were included in the analysis.Table 1 summarizes the measured metrics using the four quadrant mapping schema. Cancers have a significantly (p<0.001) higher PQ4 (22.50±21.27%) and lower PQ2 (69.86±28.24%) voxels compared to benign tissue: peripheral, transition and central zone tissue (PQ4 = 0.13±0.56, 5.73±15.07, 2.66±4.05% and PQ2 = 98.51±3.05, 86.18±21.75, 93.38±9.88% respectively). Therefore, cancers appear as red on the four-quadrant map due to the higher PQ4, while benign tissue appears green due to higher PQ2. Mean angle for cancer (206.5±41.8⁰) was significantly higher (p<0.001) from that of benign tissue: peripheral (170.8±5.8⁰), transition (169.2±9.1⁰) and central zone (170.1±9.1⁰) tissue. The vector amplitude for cancer (0.017±0.013) was significantly lower (p<0.001) than that of benign tissue from peripheral (0.059±0.028) and central (0.048±0.036) zones, but not significantly different from benign tissue from transition zone (0.033±0.025). Figure 2 shows a representative example.
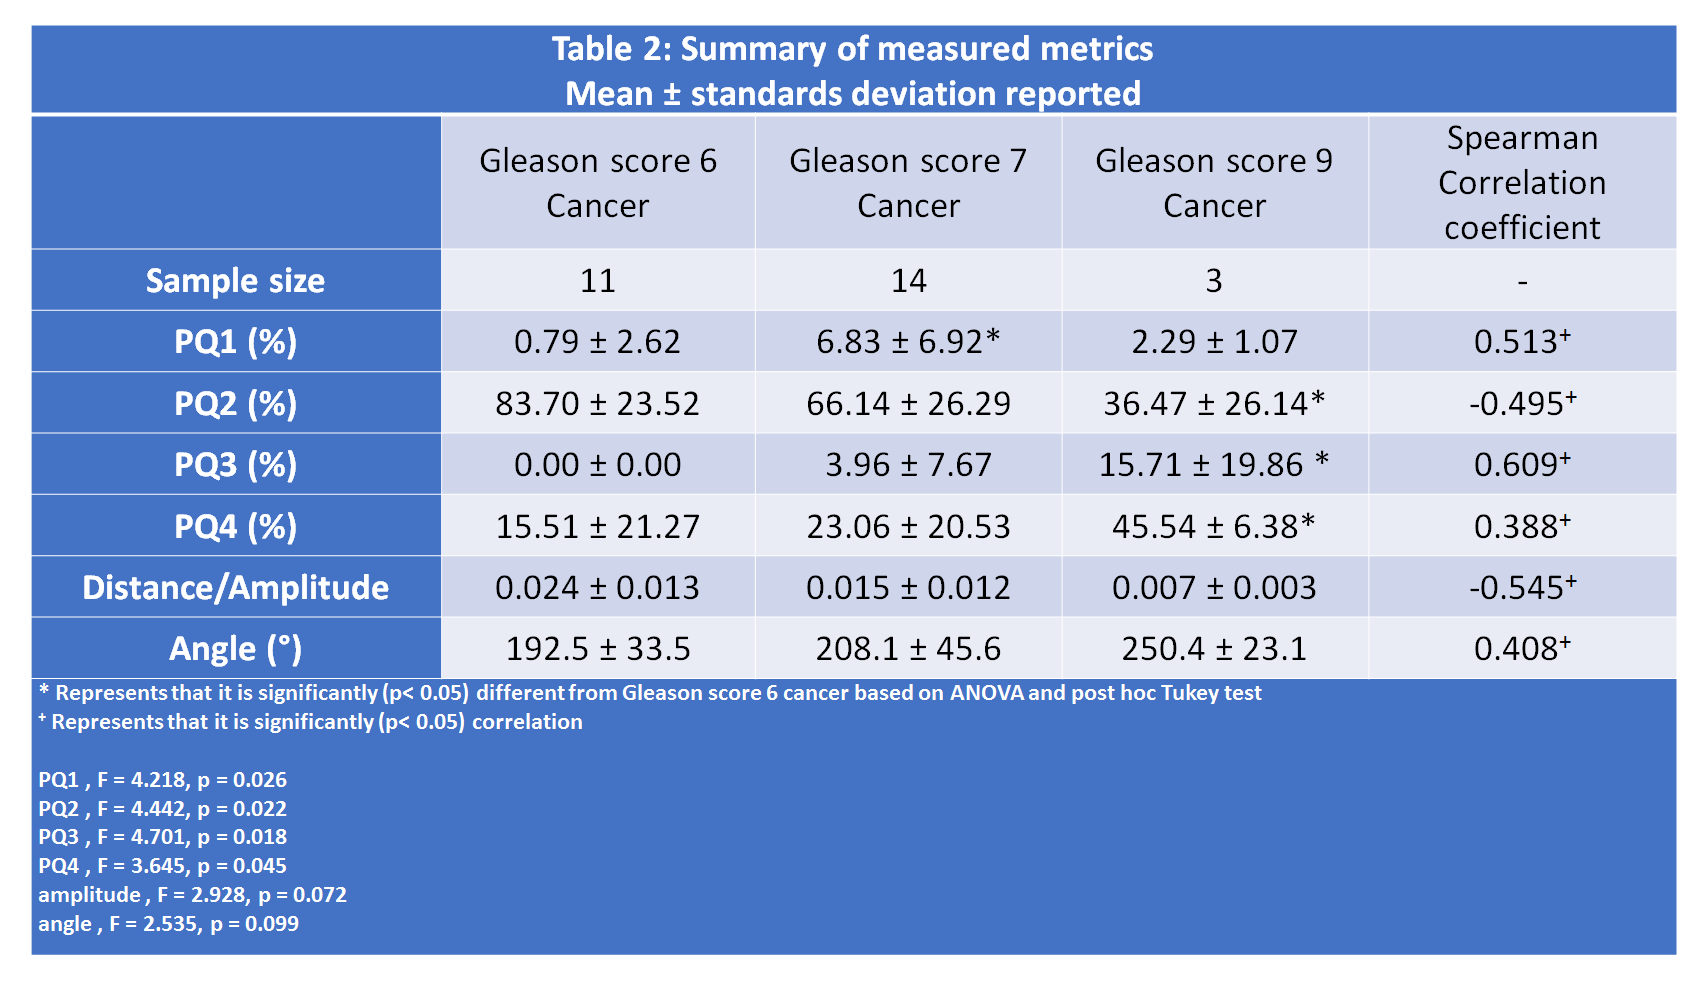
Four quadrant metrics showed moderate correlation with Gleason score (|ρ|=0.388-0.609) with more aggressive cancers being associated with increased PQ1, PQ3, PQ4 and angle and reduced PQ2, amplitude and angle (Table 2). The strongest correlation was shown by PQ3 (0.609) followed by amplitude (-0.545).
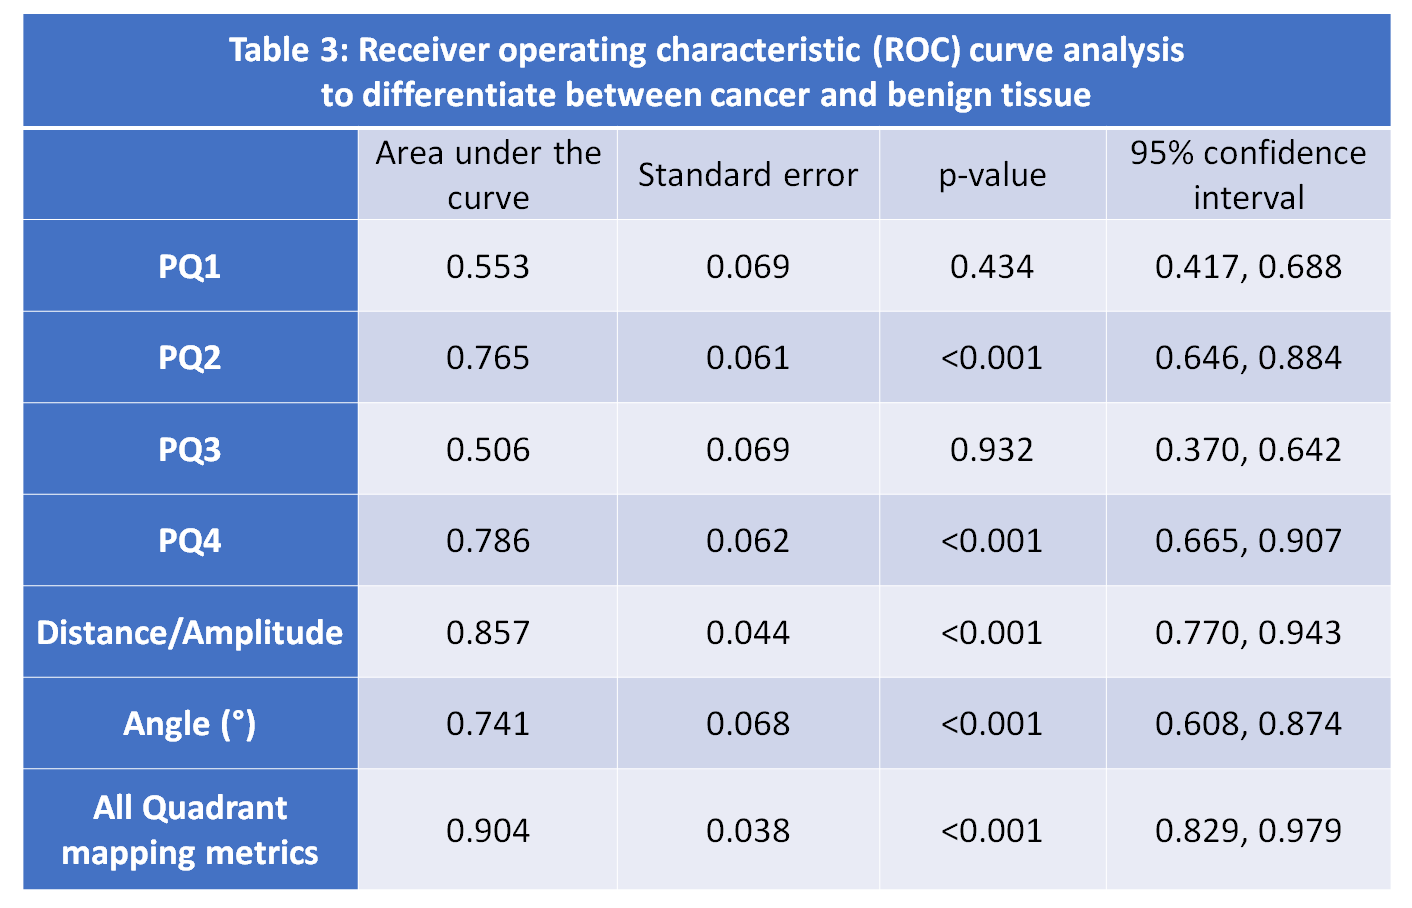
Vector amplitude followed by PQ4, PQ2, and angle were effective in differentiating between cancer and benign tissue (Table 3).The combination of quadrant analysis metrics showed an AUC of 0.904. Combining PQ metrics with tissue composition measured from compartmental analysis of HM-MRI provides an improved AUC of 0.990.
Discussion
These results show that prostate cancer diagnosis is feasible with parameters providing good differentiation between prostate cancer and benign prostatic tissue, evidenced by high AUC value and moderate correlation with Gleason score. Cancers exhibit lower vector amplitude in the PQ quadrant map compared to benign issue. This can be attributed to more homogeneous tissue microanatomy in cancers, which primarily consist of epithelial cells. Benign tissue is more heterogeneous; in addition to epithelium it contains luminal fluid and larger lumen with larger ADC and longer T2. At increased TE and b-values, the signal from the luminal glands shows increased suppression of diffusion signal, leading to higher ADC, and thus increased amplitude. This distinct PQ4 signal in cancers can be attributed to rapidly diving cells with large nuclei in this mitotic phase; water in these nuclei have restricted diffusion but long T2(9-13).Conclusion
Four Quadrant Vector mapping of HM-MRI data provides effective cancer markers, with cancers associated with high PQ4, lower PQ2, and higher vector angle, and lower amplitude representing cancer voxels. Quadrant mapping parameters show promise for determining cancer aggressiveness as they are moderately correlated with cancer Gleason score. Four quadrant mapping could be combined with the compartmental analysis of HM-MRI data to increase diagnostic accuracy.Acknowledgements
This study was supported by NIH (R01 CA227036, 1R41CA244056-01A1, R01 CA17280, 1S10OD018448-01), and Sanford J. Grossman Charitable Trust.References
1. Stanisz GJ, Henkelman RM. Diffusional anisotropy of T2 components in bovine optic nerve. Magnetic Resonance in Medicine 1998;40(3):405-410.
2. Burdette JH, Elster AD, Ricci PE. Acute Cerebral Infarction: Quantification of Spin-Density and T2 Shine-through Phenomena on Diffusion-weighted MR Images. Radiology 1999;212(2):333-339.
3. Wang S, Peng Y, Medved M, Yousuf AN, Ivancevic MK, Karademir I, Jiang Y, Antic T, Sammet S, Oto A, Karczmar GS. Hybrid multidimensional T2 and diffusion‐weighted MRI for prostate cancer detection. Journal of Magnetic Resonance Imaging 2014;39(4):781-788.
4. Sadinski M, Karczmar G, Peng Y, Wang S, Jiang Y, Medved M, Yousuf A, Antic T, Oto A. Pilot Study of the Use of Hybrid Multidimensional T2-Weighted Imaging–DWI for the Diagnosis of Prostate Cancer and Evaluation of Gleason Score. American Journal of Roentgenology 2016;207(3):592-598. 5. Chatterjee A, Bourne R, Wang S, Devaraj A, Gallan AJ, Antic T, Karczmar GS, Oto A. Diagnosis of Prostate Cancer with Noninvasive Estimation of Prostate Tissue Composition by Using Hybrid Multidimensional MR Imaging: A Feasibility Study. Radiology 2018;287(3):864-872.
6. Bourne RM, Kurniawan N, Cowin G, Stait-Gardner T, Sved P, Watson G, Price WS. Microscopic diffusivity compartmentation in formalin-fixed prostate tissue. Magn Reson Med 2012;68(2):614-620.
7. Chatterjee A, Mercado C, Bourne RM, Yousuf A, Hess B, Antic T, Eggener S, Oto A, Karczmar GS. Validation of Prostate Tissue Composition by Using Hybrid Multidimensional MRI: Correlation with Histologic Findings. Radiology 2022;302(2):368-377.
8. Chatterjee A, Antic T, Gallan AJ, Paner GP, Lin LIK, Karczmar GS, Oto A. Histological validation of prostate tissue composition measurement using hybrid multi-dimensional MRI: agreement with pathologists’ measures. Abdom Radiol 2022;47(2):801-813.
9. White NS, Dale AM. Distinct effects of nuclear volume fraction and cell diameter on high b-value diffusion MRI contrast in tumors. Magn Reson Med 2014;72(5):1435-1443.
10. Thelwall PE, Grant SC, Stanisz GJ, Blackband SJ. Human erythrocyte ghosts: Exploring the origins of multiexponential water diffusion in a model biological tissue with magnetic resonance. Magnetic Resonance in Medicine 2002;48(4):649-657.
11. Schoeniger JS, Aiken N, Hsu E, Blackband SJ. Relaxation-Time and Diffusion NMR Microscopy of Single Neurons. Journal of Magnetic Resonance, Series B 1994;103(3):261-273.
12. Bottomley PA, Hardy CJ, Argersinger RE, Allen-Moore G. A review of 1H nuclear magnetic resonance relaxation in pathology: Are T1 and T2 diagnostic? Medical Physics 1987;14(1):1-37.
13. Callahan DE, Deamond SF, Creasey DC, Trapane TL, Bruce SA, Ts'O POP, Kan L-S. NMR studies of intracellular water at 300 MHz: T2-specific relaxation mechanisms in synchronized or EGF-stimulated cells. Magnetic Resonance in Medicine 1991;22(1):68-80.
Figures