0717
Do Breast Edema and Shrinkage pattern Provide Additional Evaluation Value for Treatment Response and Recurrence in Luminal Breast Cancer
Shiyun Sun1, Yajia Gu1, and Chao You1
1Fudan University Shanghai Cancer Center, Shanghai, China
1Fudan University Shanghai Cancer Center, Shanghai, China
Synopsis
Keywords: Breast, Breast, breast edema; magnetic resonance imaging (MRI); treatment response; recurrence
This study aims to develop an accurate and convenient prediction model for luminal breast cancer based on conventional MRI. First, we evaluated conventional MRI features and their changes during NAC (pre, early and post) and identified stable imaging markers that predicted multiple treatment responses and prognosis. Second, we comprehensively explored the shrinkage pattern, breast edema and changes during NAC. We found that both of them can provide added value to traditional MRI features. Finally, we constructed a combined model with multi-parameter MRI features and clinicopathological information, which showed good prediction performance in treatment response and prognosis of luminal breast cancer.Introduction
Luminal breast cancer is the most common type of breast cancer. Endocrine therapy resistance and distant recurrence remain clinical challenges for luminal breast cancer. Precision treatment evaluation is particularly important for luminal breast cancer. However, prediction models in previous studies were developed based on whole breast cancer and could not show satisfactory performance for luminal breast cancer. Although machine learning-based radiomics and deep learning have greatly improved the performance of cancer prediction, many factors also limit their clinical application. At present, the unmet needs for precision treatment evaluation of luminal breast cancer include a lack of customized prediction models, a lack of exploration of the value of MRI feature changes during NAC, and a lack of comprehensive evaluation of edema and shrinkage pattern. Therefore, the main objective of this study is to evaluate traditional MRI features and changes during NAC (pre, early, post) and develop an accurate and convenient prediction tool for predicting treatment response and prognosis in luminal breast cancer. The secondary objective is to explore the added value of emerging MRI features such as breast edema and shrinkage pattern to traditional MRI.Methods
Patients with luminal breast cancer were consecutively included in the treatment development (n=186), validation (n=81) and prognosis cohorts (n=125). MRI features at the early and pre-NAC stages were evaluated for their associations with 4 treatment responses (Miller-Payne grade, bpCR [tumor and lymph node pCR], tpCR [tumor pCR], lpCR [lymph node pCR]). MRI features during NAC (pre, early, post) were evaluated for their associations with invasive disease-free survival (iDFS). Independent variables were screened by univariate, multivariate logistic and Cox regression analyses. A nomogram was constructed based on the regression coefficients of independent variables. The models were evaluated by the area under the receiver operating characteristic curve (AUC) and calibration curve. Kaplan‒Meier curves were used to evaluate the survival rate among different recurrence risk groups.Results
Δ%LD1, Δ%ADC1, diffuse edema1 and pre-NAC Ki67 ≥20% were common independent variables of 4 treatment responses (all P <.05). Combined edema1 significantly increased the AUC of Δ%LD1 for 4 treatment responses but could not improve any AUC of Δ%ADC1. The combined model showed the highest AUC values for M-P (AUC, 0.82, 0.79), followed by bpCR (AUC, 0.81, 0.78), tpCR (AUC, 0.80, 0.74) and lpCR (AUC, 0.79, 0.72) in the development and validation cohorts. Δ%ADC2, SP2, edema2, post-Ki67 were independently associated with iDFS (all P <.05). Combined edema2 (C index, from 0.67 to 0.77) and SP2 (C index, from 0.67 to 0.73) significantly increased the predictive performance of Δ%ADC2 for iDFS. The prediction model and bootstrap-validation model all have good predictive ability for iDFS (C index, 0.74, 0.70). According to the predictive model, the high-risk group had poorer 3-year iDFS rates than the low-risk group (51% vs 88%, P <.001).Discussion
Similar to previous studies[1-4], we found that Δ%LD1 and Δ%ADC1 values in early NAC also showed a predictive role both for pCR and M-P grade in luminal breast cancer. In addition, we restratified the breast edema based on a previous study[5]. We classified breast edema into four categories and combined prepectoral and subcutaneous edema. We are also the first to describe the coexistence of two or two different edema types, defining it as diffuse edema (grade 4). To the best of our knowledge, this is the first study to report in detail the relationship between breast edema and NAC treatment response in luminal breast cancer. Although the exact mechanism remains unclear, the tumor mass effect and mechanical obstruction of lymphatic vessels or blood vessels caused by LVI and increased vascular permeability caused by tumor hypoxia are among the causes of fluid retention and leakage in the stroma surrounding tumors[6-7]. These reasons may contribute to a poor response to treatment in patients with breast edema. In the prognostic study, we observed that patients with lower Δ%ADC2, moderate-serve or diffuse, and higher expression of post Ki-67 (≥20%) after NAC were more likely to experience recurrence. This is consistent with the majority of reported risk factors associated with breast cancer recurrence[8-10]. At the same time, the relationship between these features and treatment response was confirmed in this study. This indicates that ADC, edema and Ki-67 are features that are strongly associated with both short-term outcome and long-term prognosis of breast cancer, which needs to be considered. In addition, we found that non-concentric shrinkage during NAC was also an independent risk factor for recurrence, which is similar to the research results of Fukada et al[11]. They suggest that lesions with non-concentric shrinkage, where tumor cells are distributed near normal breast tissue, may retain more cancer cells that are resistant to chemotherapy and thus more prone to distant recurrence. The performance of our model is comparable to that of Kwon et al.[8] (C index, 0.67-0.75). However, our model is more convenient for clinical practice than their model, which was built based on mammography, ultrasound and MRI. Conclusions: Breast edema and shrinkage pattern during NAC can provide additional evaluation value to traditional MRI features. A combined model with multiparameter MRI and clinicopathological features can optimize treatment response and recurrence prediction for luminal breast cancer.Acknowledgements
The authors declare no potential conflicts of interest associated with this work.References
[1] Partridge SC, Zhang Z, Newitt DC, et al. Diffusion-weighted MRI Findings Predict Pathologic Response in Neoadjuvant Treatment of Breast Cancer: The ACRIN 6698 Multicenter Trial[J]. Radiology, 2018, 289(3): 618-627. [2] Hylton NM, Blume JD, Bernreuter WK, et al. Locally advanced breast cancer: MR imaging for prediction of response to neoadjuvant chemotherapy--results from ACRIN 6657/I-SPY TRIAL[J]. Radiology, 2012, 263(3): 663-672. [3] Virostko J, Sorace AG, Slavkova KP, et al. Quantitative multiparametric MRI predicts response to neoadjuvant therapy in the community setting[J]. Breast Cancer Res, 2021, 23(1): 110. [4] Pereira NP, Curi C, Osorio C, et al. Diffusion-Weighted Magnetic Resonance Imaging of Patients with Breast Cancer Following Neoadjuvant Chemotherapy Provides Early Prediction of Pathological Response - A Prospective Study[J]. Sci Rep, 2019, 9(1): 16372. [5] Harada TL, Uematsu T, Nakashima K, et al. Evaluation of Breast Edema Findings at T2-weighted Breast MRI Is Useful for Diagnosing Occult Inflammatory Breast Cancer and Can Predict Prognosis after Neoadjuvant Chemotherapy[J]. Radiology, 2021, 299(1): 53-62. [6] Park NJ, Jeong JY, Park JY, et al. Peritumoral edema in breast cancer at preoperative MRI: an interpretative study with histopathological review toward understanding tumor microenvironment[J]. Sci Rep, 2021, 11(1): 12992. [7] Panzironi G, Moffa G, Galati F, et al. Peritumoral edema as a biomarker of the aggressiveness of breast cancer: results of a retrospective study on a 3 T scanner[J]. Breast Cancer Res Treat, 2020, 181(1): 53-60. [8] Kwon BR, Shin SU, Kim SY, et al. Microcalcifications and Peritumoral Edema Predict Survival Outcome in Luminal Breast Cancer Treated with Neoadjuvant Chemotherapy[J]. Radiology, 2022, 304(2): 310-319. [9] Kim JY, Kim JJ, Hwangbo L, et al. Diffusion-weighted Imaging of Invasive Breast Cancer: Relationship to Distant Metastasis-free Survival[J]. Radiology, 2019, 291(2): 300-307. [10] von Minckwitz G, Schmitt WD, Loibl S, et al. Ki67 measured after neoadjuvant chemotherapy for primary breast cancer[J]. Clin Cancer Res, 2013, 19(16): 4521-4531. [11] Fukada I, Araki K, Kobayashi K, et al. Pattern of Tumor Shrinkage during Neoadjuvant Chemotherapy Is Associated with Prognosis in Low-Grade Luminal Early Breast Cancer[J]. Radiology, 2018, 286(1): 49-57.Figures
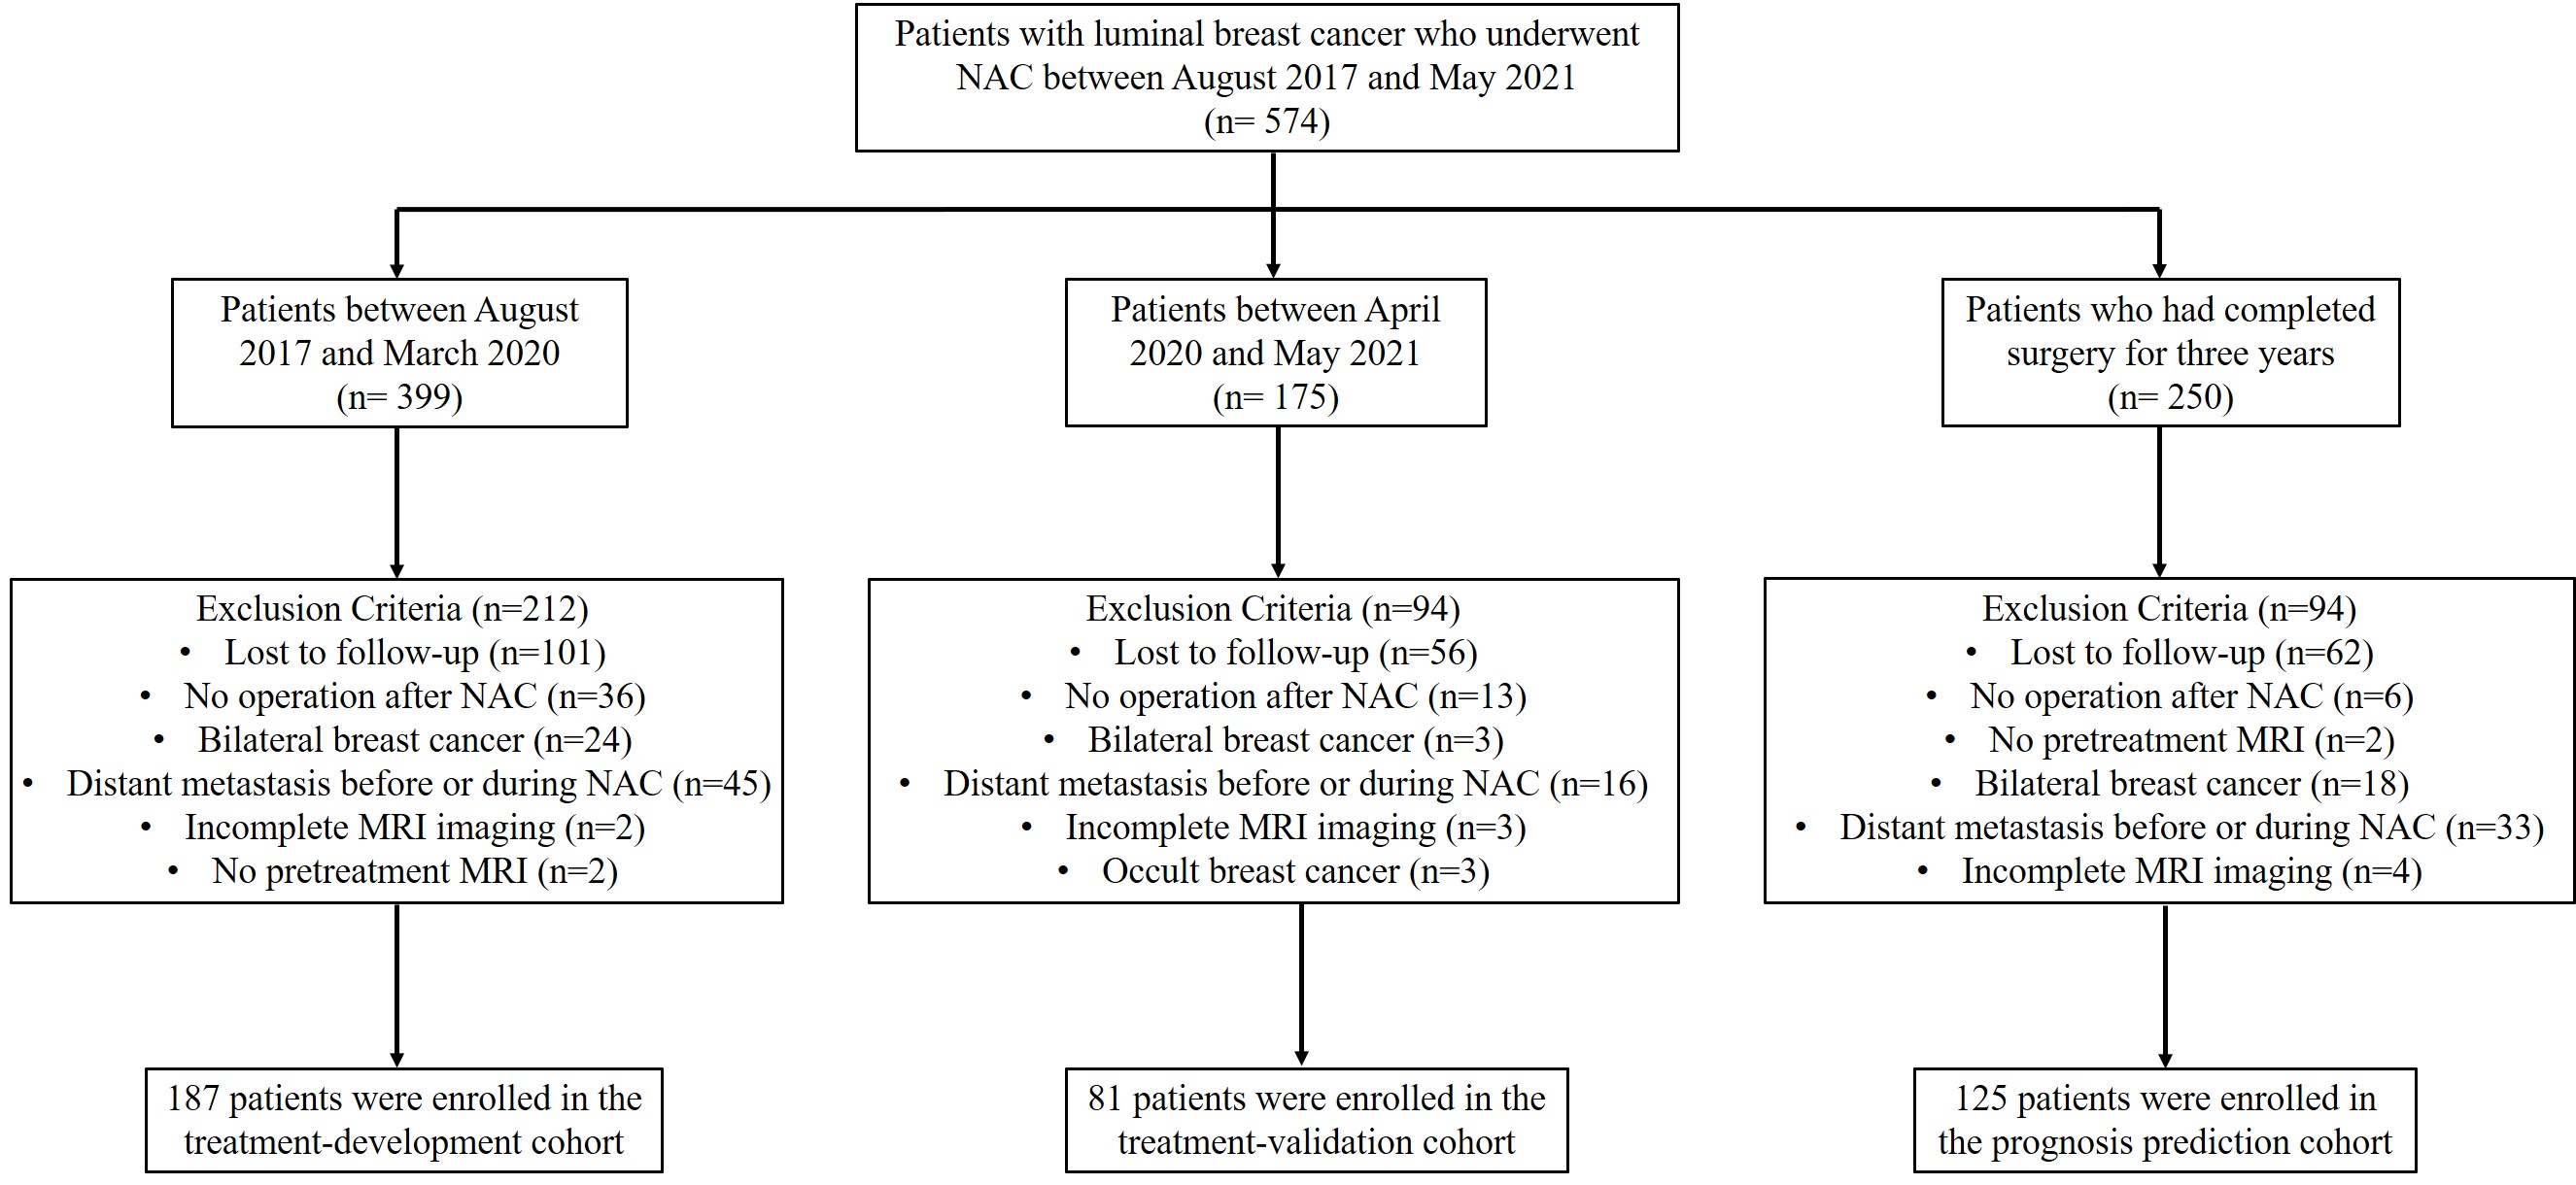
Figure
1. Study flowchart. NAC = neoadjuvant chemotherapy
Figure
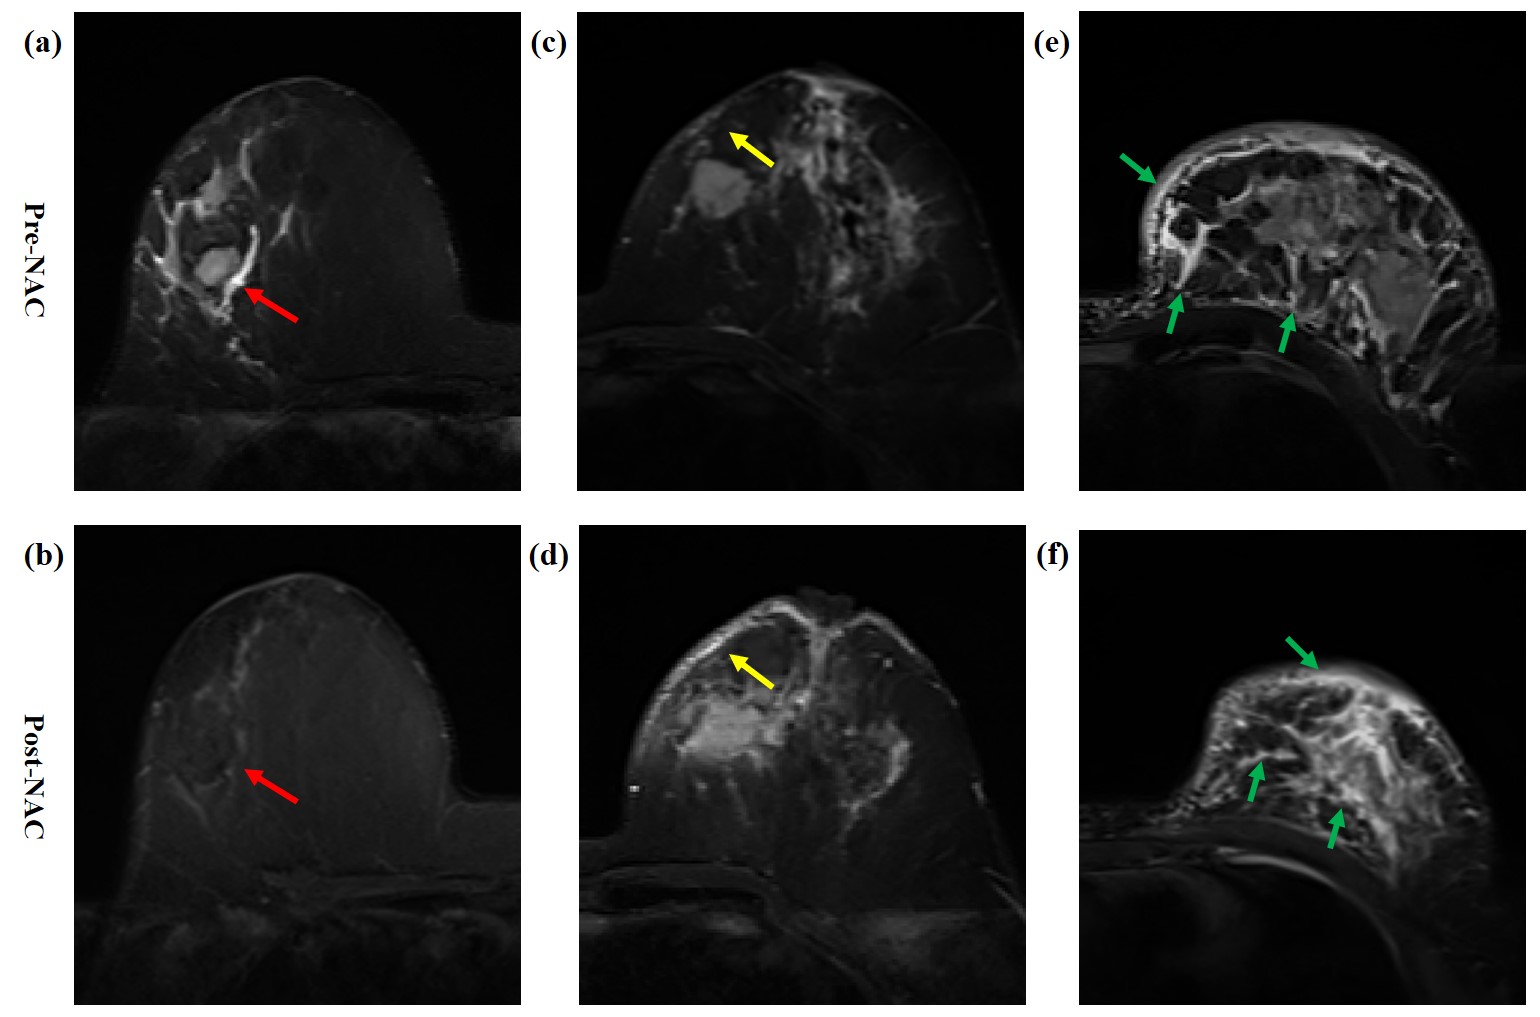
2. Diagram of breast edema.
(a, b) A patient with peritumoral edema (red
arrow, grade 2) before NAC, which disappeared after NAC (grade 1), Δedema =
decreased. (c, d) A patient with subcutaneous edema (yellow arrow, grade 3)
before NAC, which increased after NAC (Δedema = increased). (e, f) A patient with
peritumoral, subcutaneous and prepectoral edema, i.e diffuse edema (green
arrow, grade 4) before NAC, which remained after NAC (Δedema = unchanged).
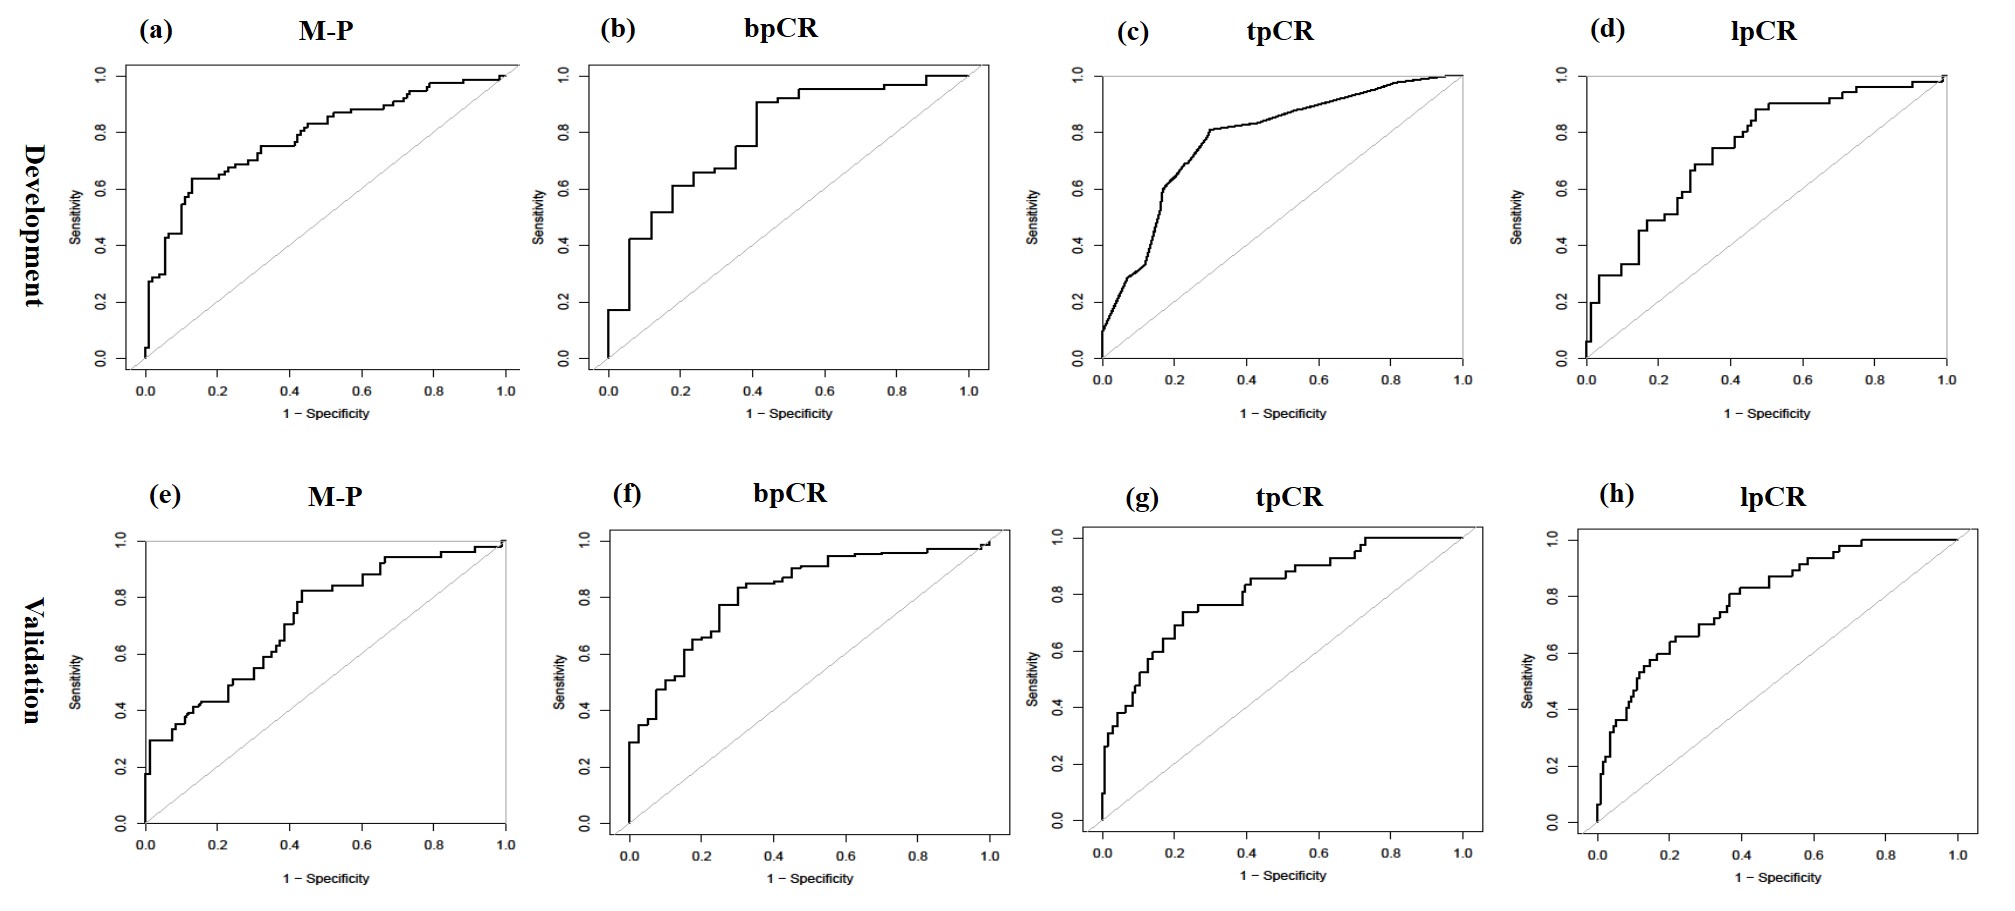
Figure
3. ROC curve analysis.
ROC
curves for the
assessment model of four treatment responses in the development cohort and validation
cohort.
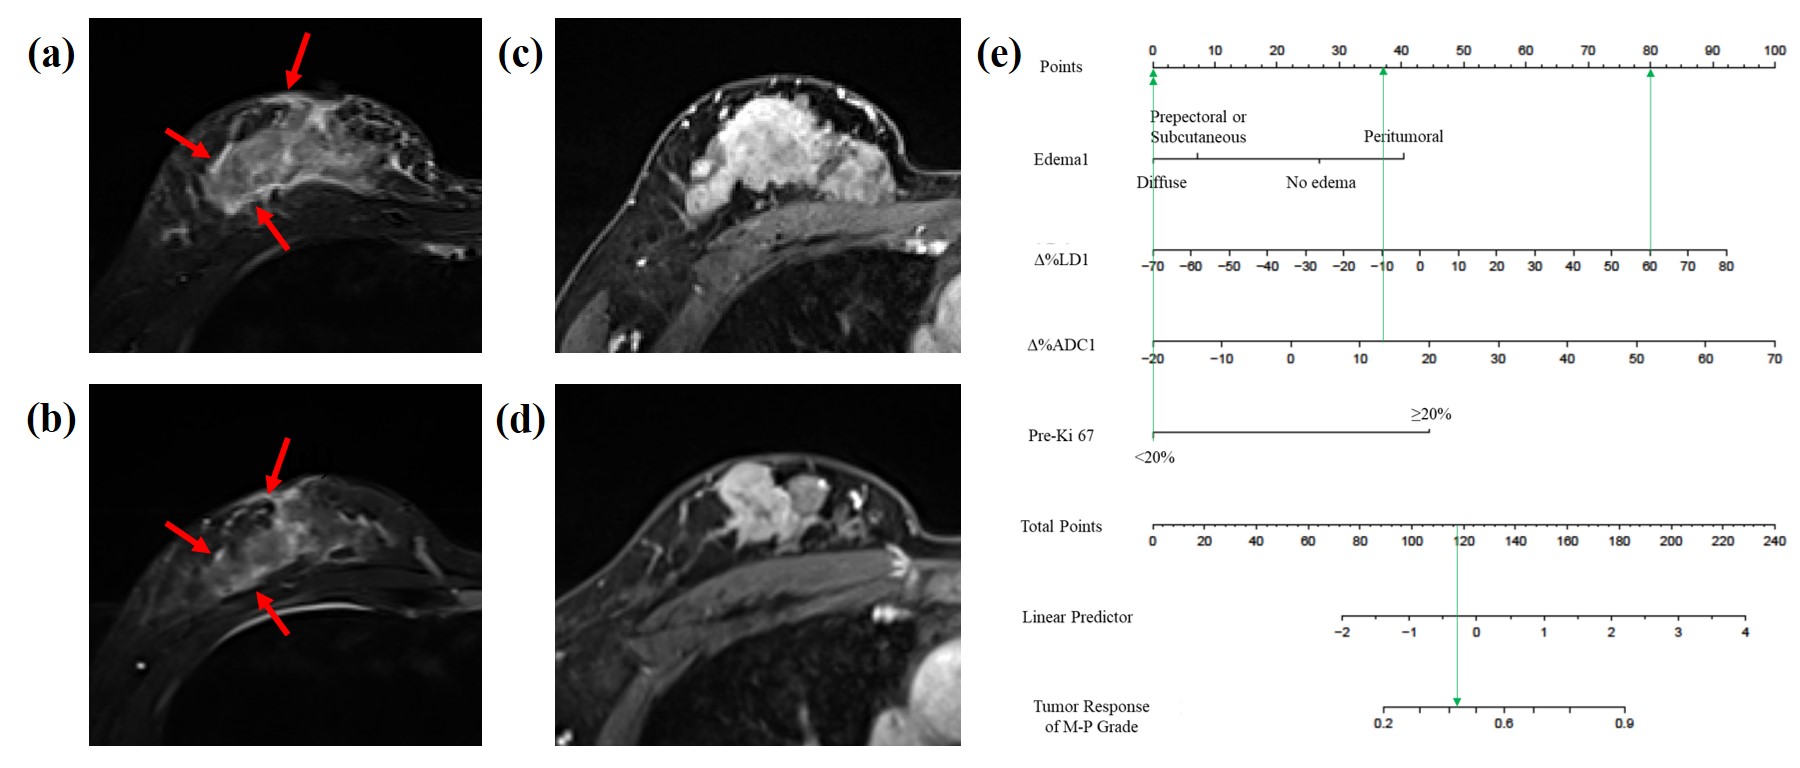
Figure
4. Representative images of a patient with non-response. (a) T2WI
shows a tumor with peritumoral and subcutaneous edema before NAC (red arrow).
(b) T2WI shows a tumor still with peritumoral and subcutaneous edema at the
early stage of NAC. (c) DCE-MRI shows the largest
slice of the tumor before NAC. (d) DCE-MRI shows that the size of the tumor was reduced by 80% at the
early stage of NAC. Despite the reduction in tumor size during NAC,
this patient was
evaluated as a non-response after NAC based on the nomogram of treatment
response (e, probability of tumor response < 50%).
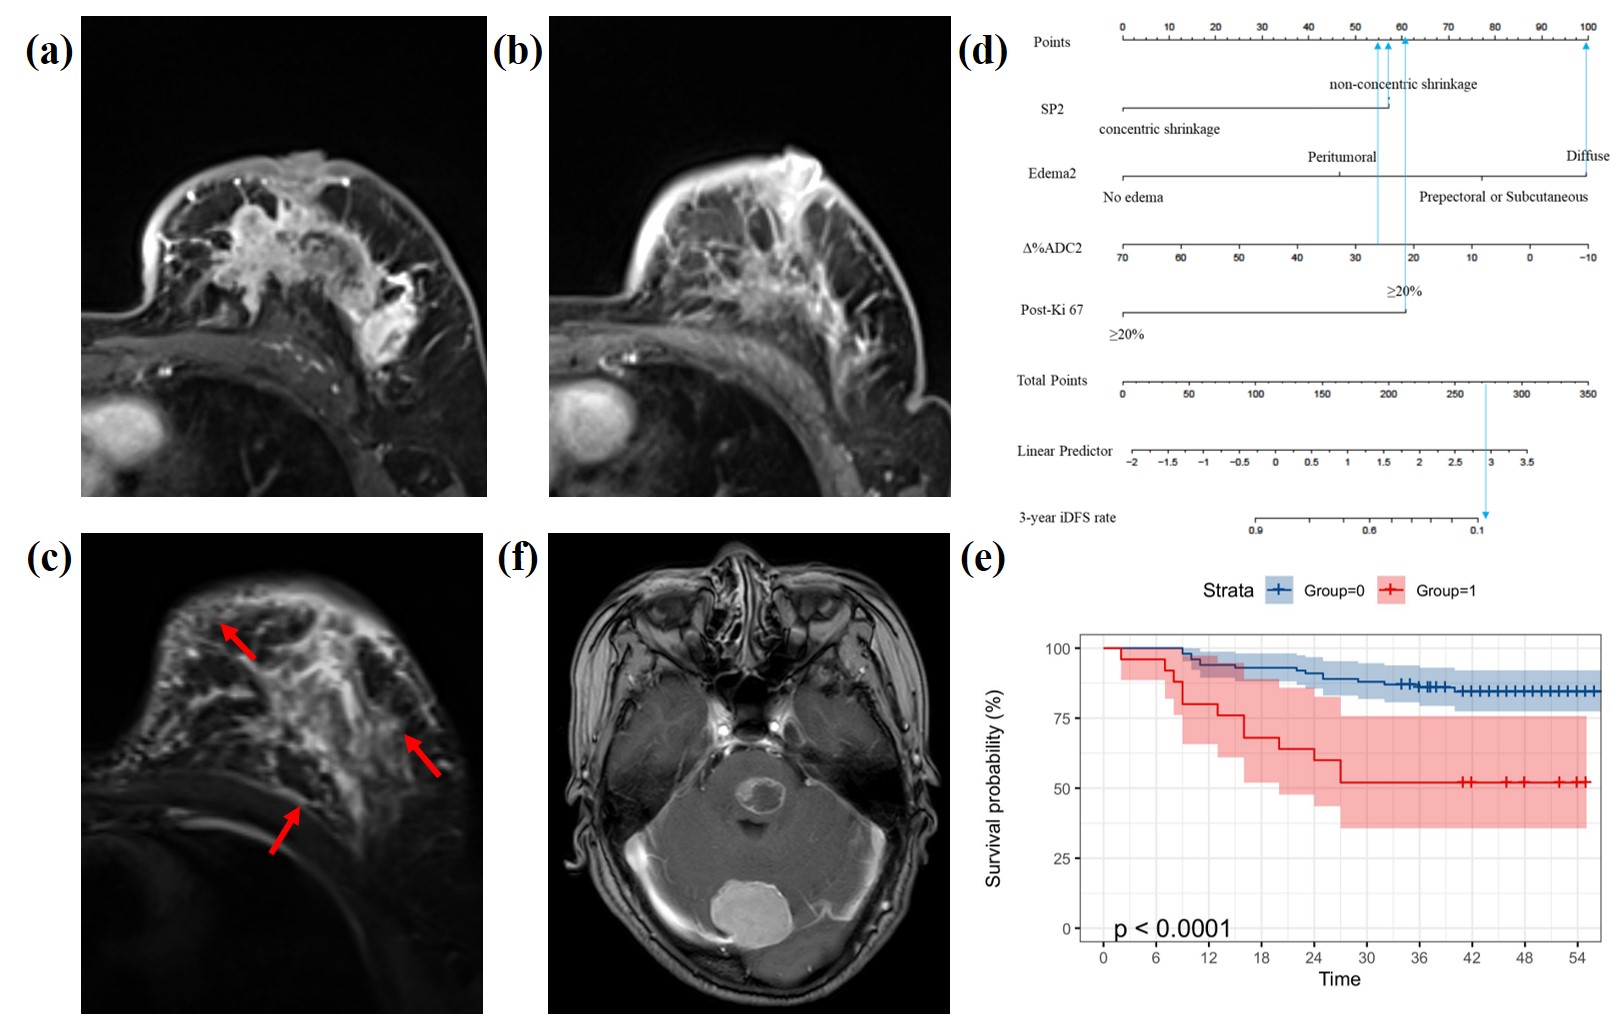
Figure
5. Representative images of a patient with recurrence.
(a) DCE-MRI shows the largest slice of the tumor before NAC. (b) DCE shows only point foci enhancement remaining after NAC, and the
shrinkage pattern is non-concentric shrinkage. (c) T2WI shows a tumor
still with peritumoral, subcutaneous and prepectoral edema after NAC (red
arrow). This patient was stratified into
high-risk groups (d, total points > 165), and the 3-year iDFS
rate was
less than 10% (e). Finally, this patient was confirmed to have developed brain
metastases 2 years after surgery (f).
DOI: https://doi.org/10.58530/2023/0717