0715
Time Course Changes of Synthetic Relaxation Time during Neoadjuvant Chemotherapy in Breast Cancer.1Department of Radiology, The First Hospital of China Medical University, Shenyang, China, 2MR Research, GE Healthcare, Beijing, China, 3Department of Medical Oncology, The First Hospital of China Medical University, Shenyang, China
Synopsis
Keywords: Breast, Cancer, neoadjuvant chemotherapy; pathological complete response
This study investigated the time course changes of synthetic magnetic resonance imaging (MRI) parameters (T1/T2 relaxation time [T1/T2], proton density [PD]) during neoadjuvant chemotherapy (NAC) and evaluate their value as predictors for pathological complete response (pCR) in locally advanced breast cancer. The results showed that median synthetic T1/T2/PD and tumor diameter generally decreased throughout NAC. And the Change of synthetic T1 after the first cycle of NAC may be an early predictor for NAC response in locally advanced breast cancer during whole treatment cycles. However, its predictive ability is significantly affected by histological grades.Purpose
Synthetic MRI technology provides the possibility of achieving rapid quantification of various relaxation time at the same time by adding multi-dynamic, multi-echo (MDME) sequences. In recent years, previous studies demonstrated the clinical feasibility of T1 and T2 for differentiating benign and malignant breast lesions1 and evaluating pathological factors2. However, longitudinal studies during NAC have not been investigated, this study was designed to apply synthetic MRI and analyze time course changes in T1, T2, and PD during NAC in breast cancer patients in order to search for the optimal parameter set for a given time point to help predict NAC treatment response.Methods
All the subjects in our study signed informed consent. In this study, 102 invasive ductal breast cancer patients underwent breast MRI at four time points: baseline, after one cycle of NAC (early-NAC), after three or four cycles of NAC (mid-NAC), and pre-operation (post-NAC). A synthetic MRI sequence was added to the breast MRI by a 3.0T whole-body scanner (SIGNATM Pioneer, GE Healthcare, Milwaukee, WI, USA) with an 8-channel breast coil. This added sequence included two echo times and four automatically calculated saturation delays in 3:09 min with the following parameters: TR/TE1/TE2 = 5600/22.1/110.4 ms, TI = NA, field of view (FOV) = 360×360 mm, matrix = 192×180, section thickness = 5mm, number of sections = 25, and acceleration factor = 2.5. A random effects model of repeated measurement was used to investigate overall changes in synthetic MRI parameters and tumor diameter, and to test differences between pCR and non-pCR groups at each treatment time point. The areas under the receiver operating characteristic (ROC) curves (AUC) were calculated and cutoff values of synthetic parameters were determined, as well as the corresponding sensitivity, specificity, and accuracy. Additionally, interaction analysis was conducted to explore the potential interaction between useful MRI parameters and clinicopathological features for treatment response evaluation. To compensate for multiple comparisons, a corrected p-value <0.05/4 = 0.0125 was considered to indicate a statistically significant test result. All statistical analysis was performed with R software (version 3.6.1; http://www.r-project.org/) and EmpowerStats (http://www.empowerstats.com, X&Y Solutions, Inc.).Results
In our study, HER-2 (p=0.007) and histological grade (p=0.010) differed significantly between the pCR and non-PCR groups before NAC. However, no significant differences were found in the other clinicopathological features between two groups. The detailed results are shown in Figure 1. The violin figure of the synthetic T1/T2/PD and tumor diameter for pCR and non-pCR patients are displayed in Figure 2, which shows the generally decreased trend throughout NAC. However, after the initiation of NAC, there is a mild rebound in median T2 for the pCR group while median synthetic T1/T2/PD continuously declined for the non-pCR group. Some images examples of pCR and non-pCR patients are shown in Figure 3-4. After early-NAC, T1 change was significantly higher in the pCR group, which also had the highest area under the ROC curves (AUC) at 0.75 (95% CI, 0.64-0.85, p<0.001). After mid-NAC, PD change and absolute PD showed the same highest AUC of 0.72 (95% CI, 0.60-0.83, p<0.001) for pCR discrimination, and prior to surgery, changes in tumor diameter held the highest AUC at 0.80 (95% CI, 0.75-0.93, p<0.001). Interaction analysis showed that histological grade III patients had higher OR (OR=1.203) compared to grade II patients (OR=1.055) (p for interaction=0.012).Discussion and conclusion
In this study, we investigated the time course changes of synthetic MRI parameters during NAC in breast cancer patients. Among all time points and parameters, early reduction in T1 after the first cycle of NAC was found to be the best predictor for therapeutic response. Furthermore, the correlation of T1 early changes with treatment response was influenced by histological grades. We suspected that in the early stage, especially after the first cycle of NAC, hyperproliferative tumor cells are sensitive to chemotherapeutic drugs and that this generates a rapid decrease of tumor components with high T1 that causes the reduction of T1 values3. Moreover, T1 relaxation is more susceptible to macromolecular content induced by chemotherapy in the literature4. At the middle and later stages of NAC, complicated intertumoral components and their interactions may weaken the correlation between the changes of T1 and treatment response. However, absolute median T2 rebounds before surgery, and it could not predict NAC response during NAC. It possibly due to complex intra-tumor mechanisms and inevitable measurement errors5-6. This reflects its limited capacity for NAC prediction in the late stage of treatment. Besides, PD reduction after mid-NAC can significantly predict pCR patients, and this may serve as a valuable complement in response to NAC. To conclude, synthetic relaxation time, especially T1, has the potential to be the early NAC response monitor of choice. Quantitative imaging techniques are noninvasive, contrast-free, and multi-parametric based on a single sequence with an acceptable scan time. All these advantages facilitate clinical applicability and thus avoid tumor progression and unnecessary drug side effects caused by ineffective treatments.Acknowledgements
No.References
1. Matsuda M, Tsuda T, Ebihara R, Toshimori W, Takeda S, Okada K, et al. Enhanced Masses on Contrast-Enhanced Breast: Differentiation Using a Combination of Dynamic Contrast-Enhanced MRI and Quantitative Evaluation with Synthetic MRI. J Magn Reson Imaging 2021;53(2):381-391.
2. Seo M, Ryu JK, Jahng GH, Sohn YM, Rhee SJ, Oh JH, et al. Estimation of T2* Relaxation Time of Breast Cancer: Correlation with Clinical, Imaging and Pathological Features. Korean J Radiol 2017;18(1):238-248.
3. Zormpas-Petridis K, Poon E, Clarke M, Jerome NP, Boult JKR, Blackledge MD, et al. Noninvasive MRI Native T1 Mapping Detects Response to MYCN-targeted Therapies in the Th-MYCN Model of Neuroblastoma. Cancer Research 2020;80:3424-3435.
4. Virta, A., Komu, M., and Kormano, M. T1 of protein solutions at very low fields: dependence on molecular weight, concentration, and structure. Magn. Reson. Med 1997;37:53-57.
5. Weidensteiner C, Allegrini PR, Sticker-Jantscheff M, Romanet V, Ferretti S, McSheehy PM. Tumour T1 changes in vivo are highly predictive of response to chemotherapy and reflect the number of viable tumour cells–a preclinical MR study in mice. BMC Cancer 2014;14:88.
6. Jamin Y, Tucker ER, Poon E, Popov S, Vaughan L, Boult JK, et al. Evaluation of clinically translatable MR imaging biomarkers of therapeutic response in the TH-MYCN transgenic mouse model of neuroblastoma. Radiology 2013;266:130-140.
Figures
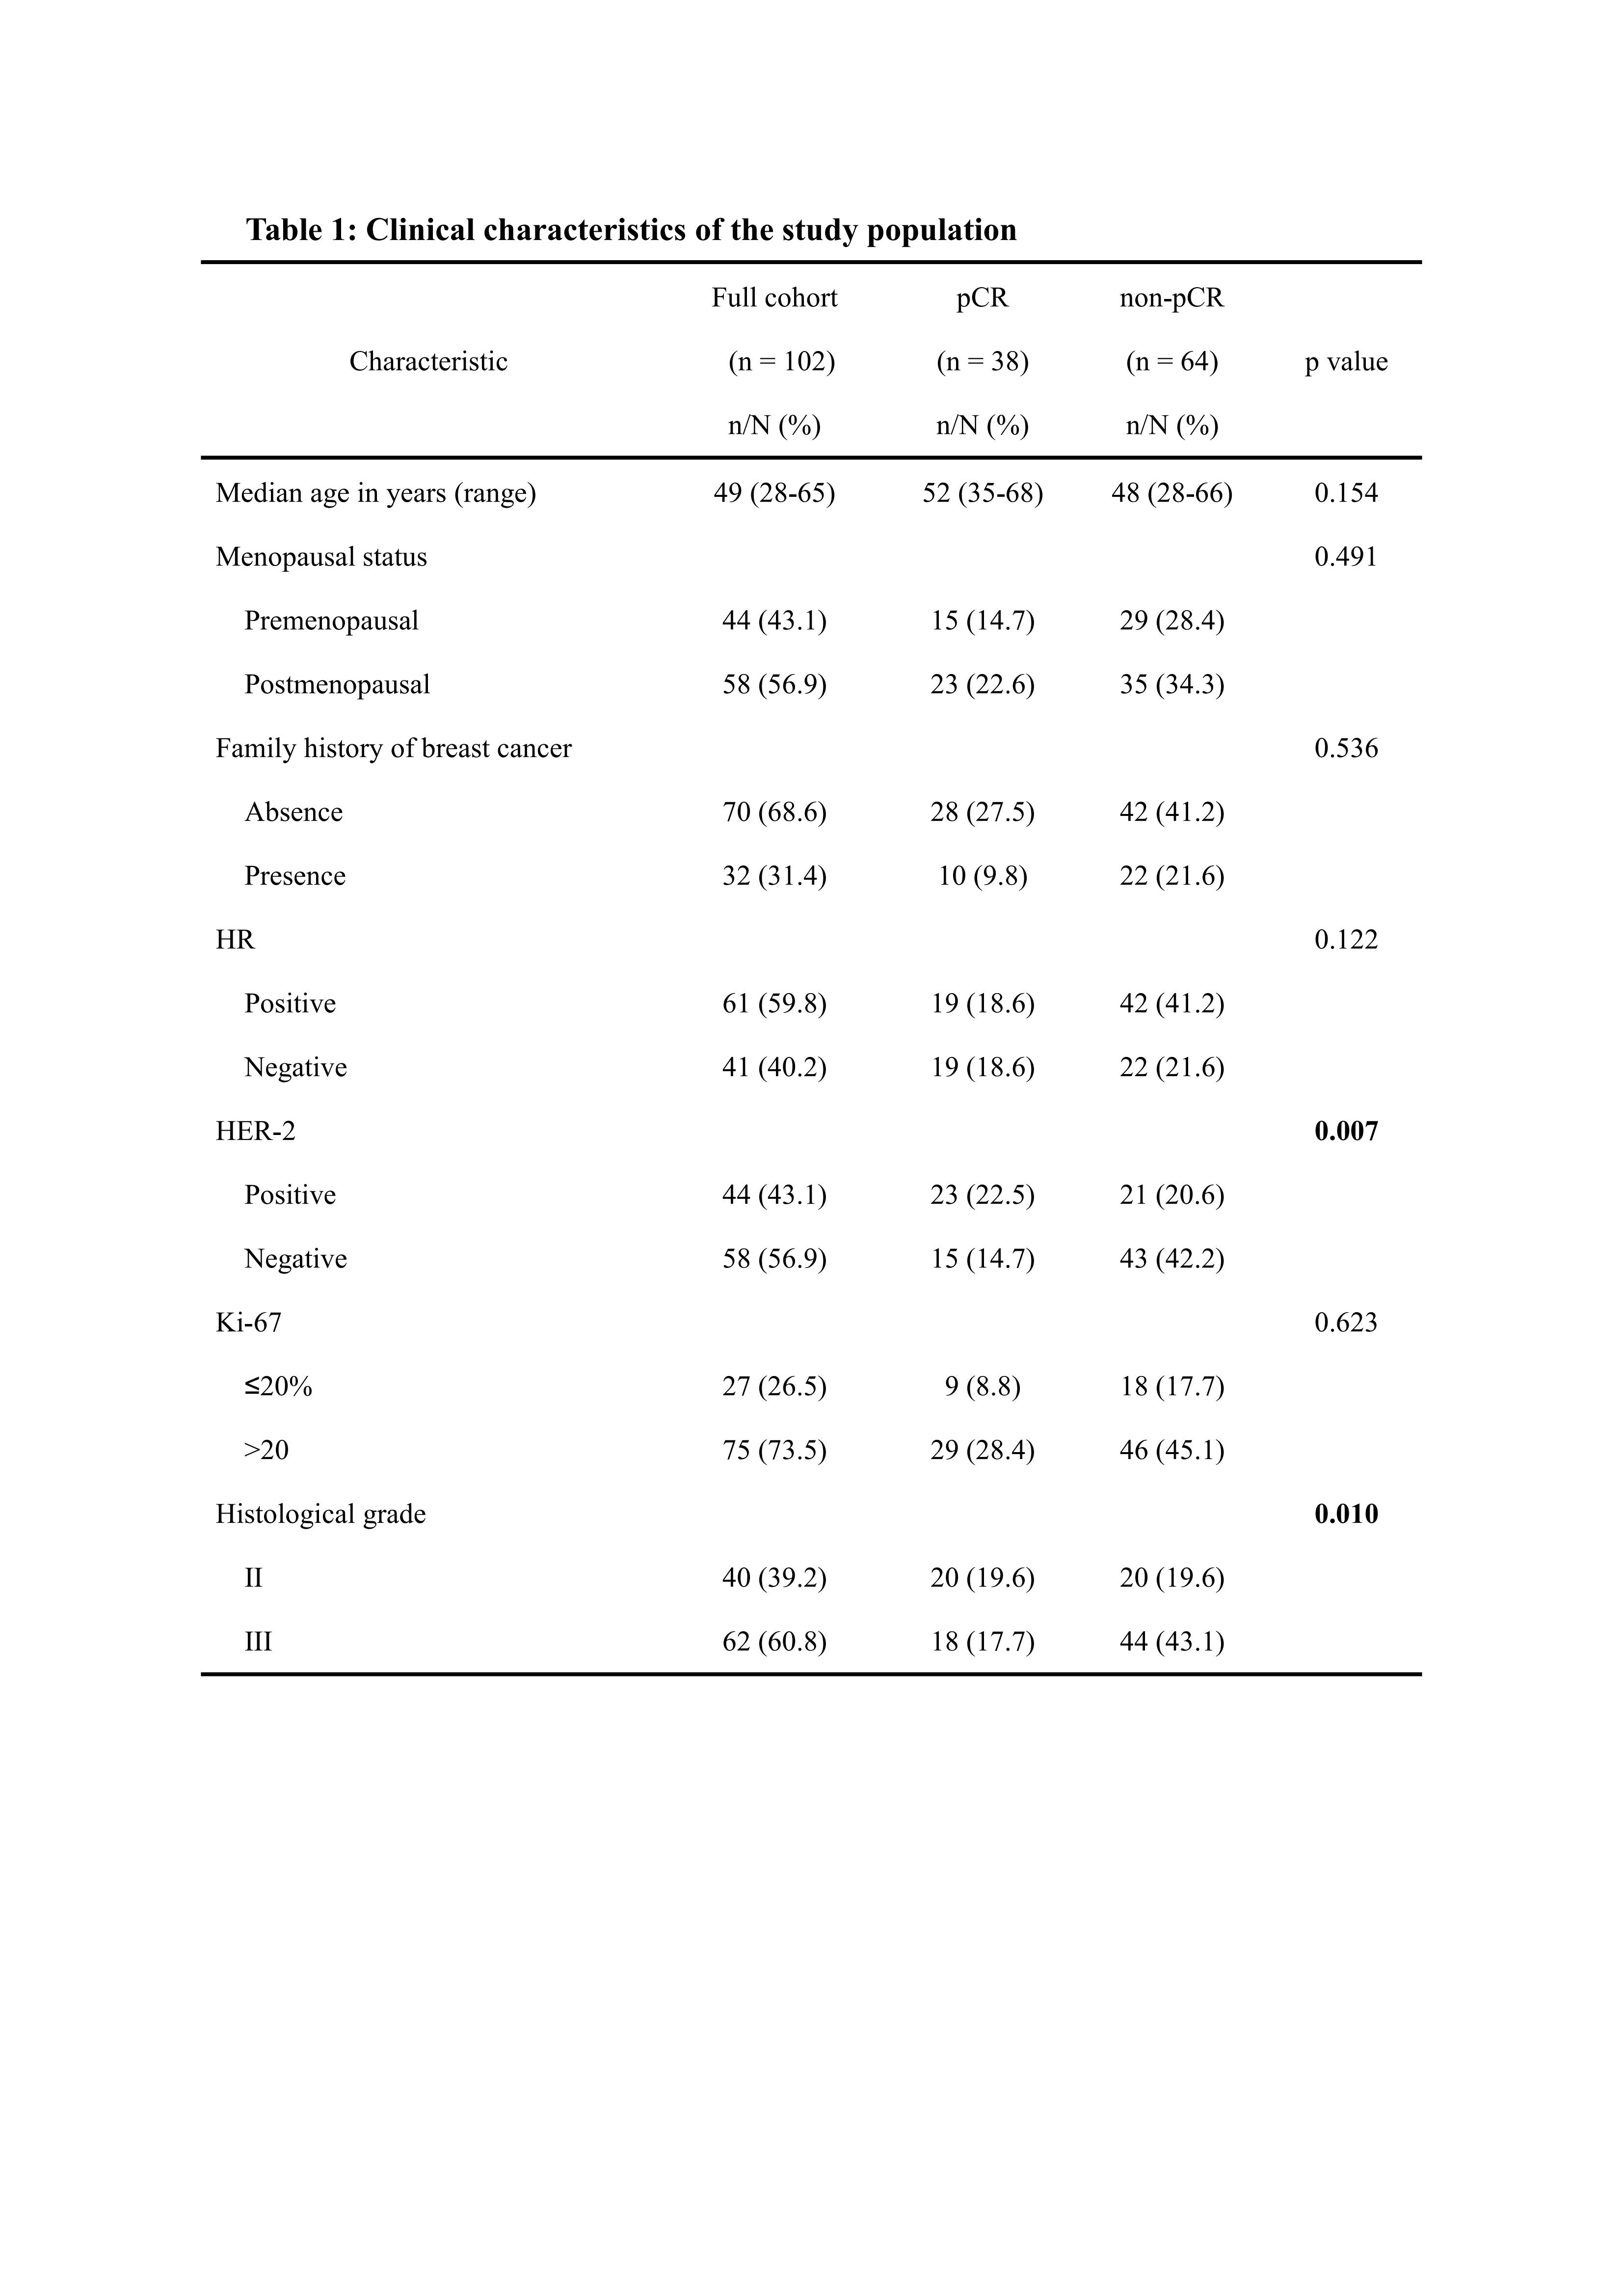
Figure 1: Clinical characteristics of the study population
Note—Bolded text with p values indicates statistical significance. pCR, pathologic complete response; HR, hormone receptor; HER-2, human epidermal growth factor receptor-2.
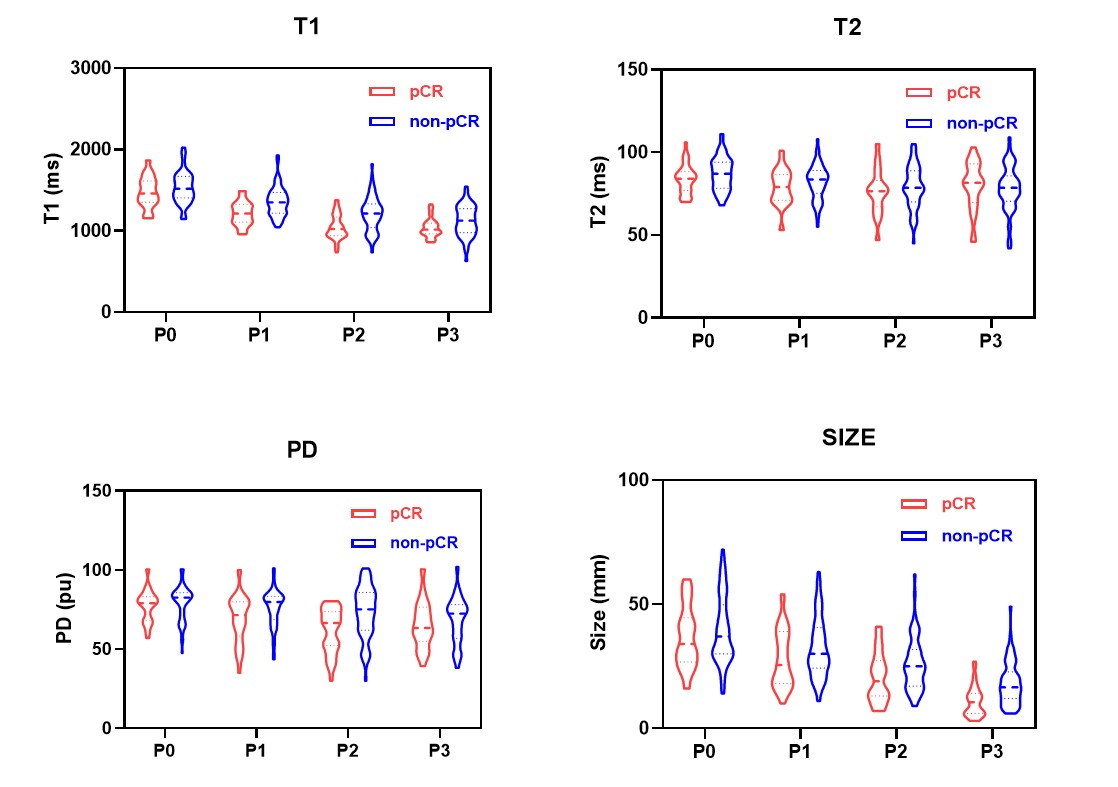
Figure 2: The violin figure of the synthetic T1/T2/PD and tumor diameter between group of pCR and non-pCR
Note—Median synthetic T1, T2 and PD for all patients, pathologic complete response (pCR) and non-pathologic complete response (non-pCR) group continuously decreased during NAC expect that after post-NAC (P3). The magnitude and direction of the changes varied according to the cycles of treatment and final treatment response.
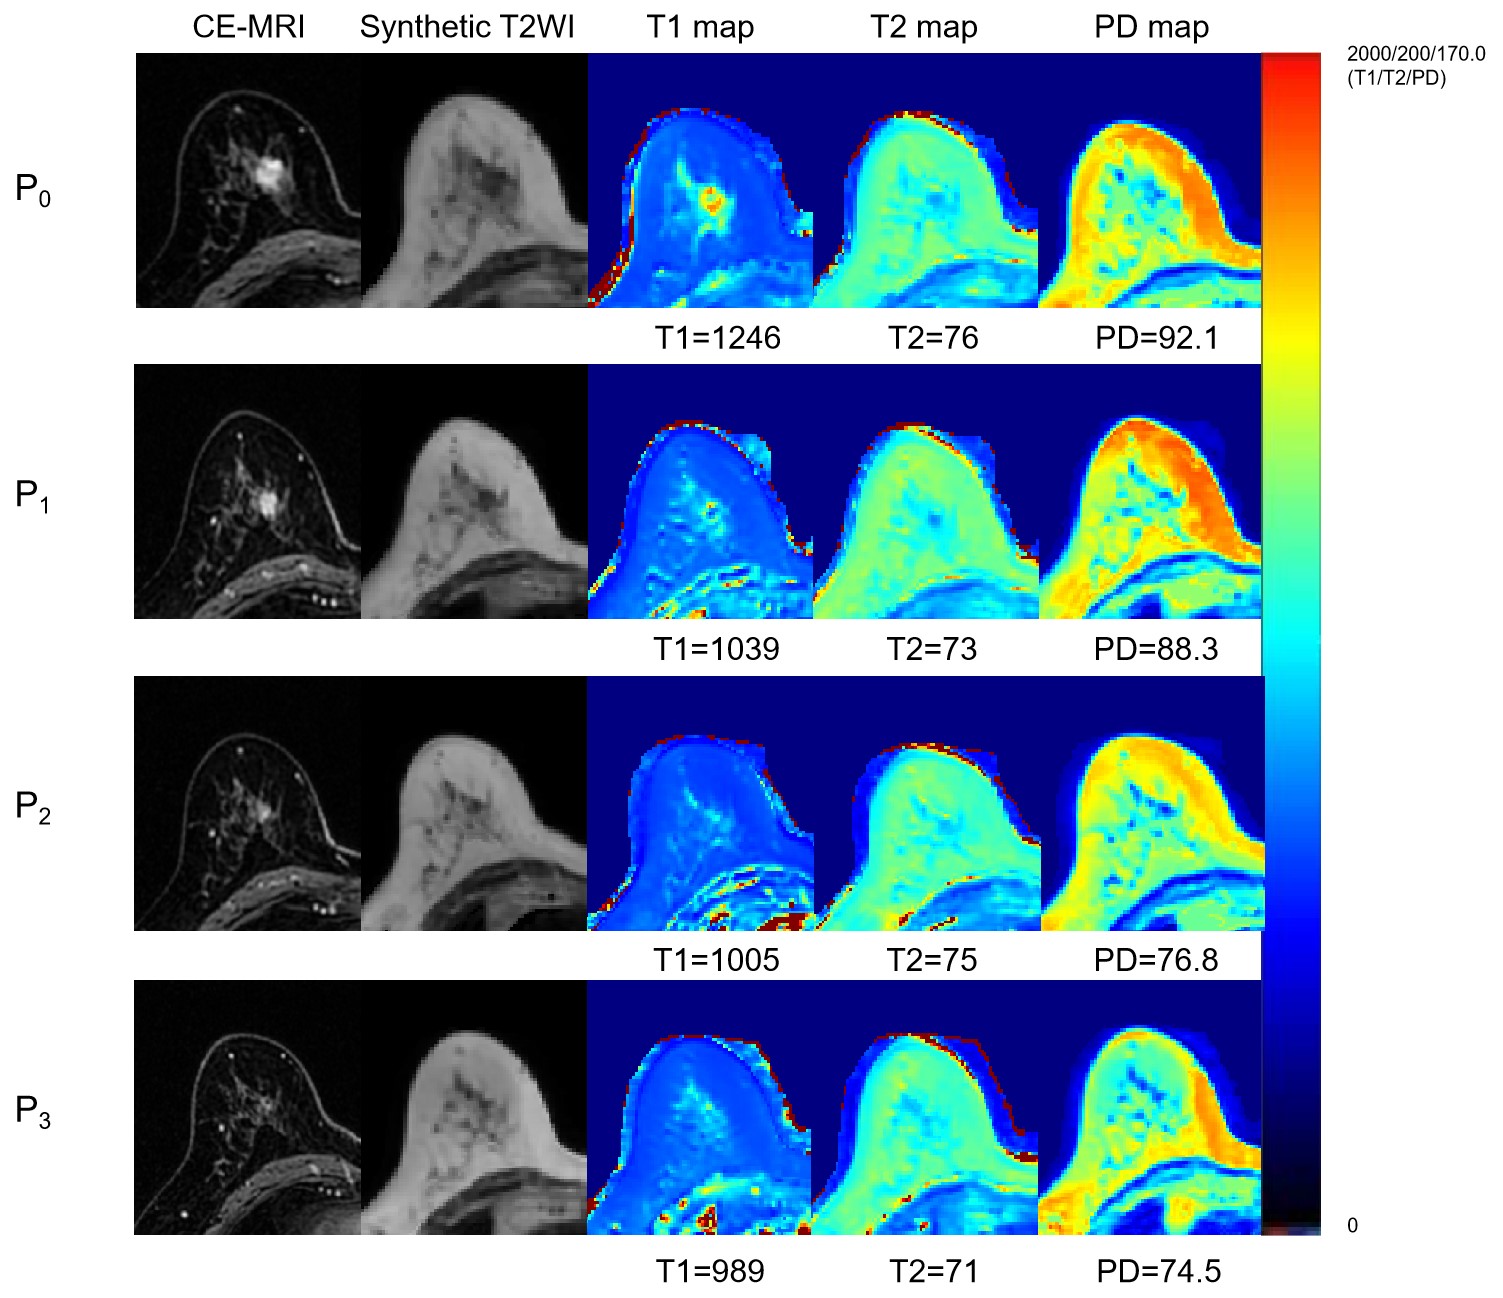
Figure 3: CE-MRI and synthetic T1/T2/PD mapping of pCR patients
Note—Example of a 60-year-old female patient diagnosed with invasive ductal carcinoma in the left breast, which was confirmed by pCR after 8 cycles biweekly chemotherapy (epirubicin and cyclophosphamide followed by taxane). The synthetic MRI quantitative parameter values at each treatment timepoint were marked below the corresponding synthetic diagrams.
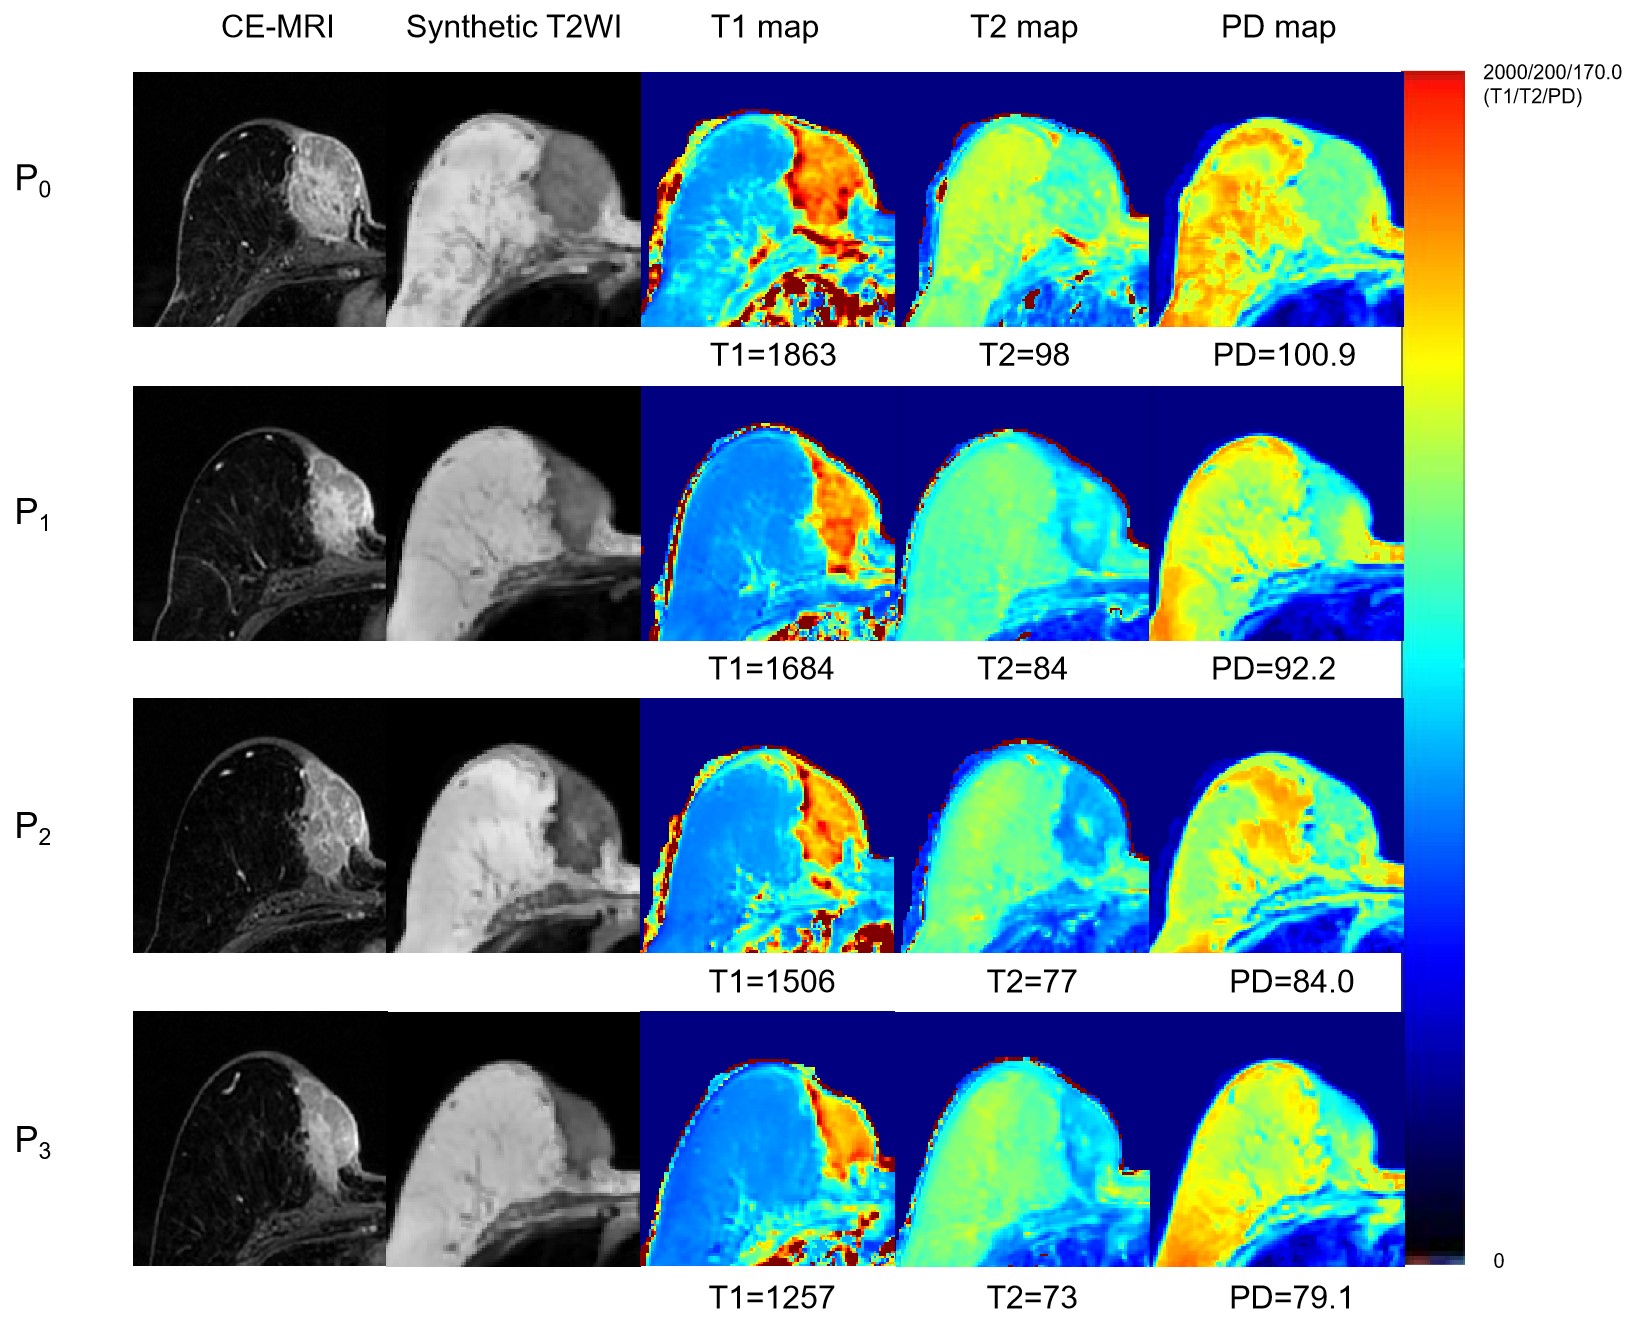
Figure 4: CE-MRI and synthetic T1/T2/PD mapping of non-pCR patients
Note—Example of a 61-year-old female patient diagnosed with invasive ductal carcinoma in the left breast, which was confirmed by non-pCR after 8 cycles biweekly chemotherapy (epirubicin and cyclophosphamide followed by taxane). The synthetic MRI quantitative parameter values at each treatment timepoint were marked below the corresponding synthetic diagrams.