0714
19F-MRI of pulmonary ventilation: Assessment of response to treatment in asthma and COPD1Newcastle Magnetic Resonance Centre, Newcastle University, Newcastle upon Tyne, United Kingdom, 2Translational and Clinical Research Institute, Newcastle University, Newcastle upon Tyne, United Kingdom, 3Department of Respiratory Medicine, Newcastle upon Tyne Hospitals NHS Foundation Trust, Newcastle upon Tyne, United Kingdom, 4Sheffield Teaching Hospitals NHS Foundation Trust, Sheffield, United Kingdom, 5Institute of Health and Society, Newcastle University, Newcastle upon Tyne, United Kingdom, 6POLARIS, Imaging Sciences, Department of IICD, University of Sheffield, Sheffield, United Kingdom
Synopsis
Keywords: Lung, Non-Proton, fluorine, 19F, ventilation
19F-MRI is an emerging technique which holds promise for direct, quantitative imaging of pulmonary ventilation without recourse to ionising radiation or use of specialist hyperpolarised gases. We aimed to assess the sensitivity of 19F-MRI to treatment response by imaging inhaled perfluoropropane in patients with asthma and patients with COPD before and after administration of a bronchodilator, at two research sites. Significant increases in percent ventilated lung volume were measured from the 19F-MR images following bronchodilator administration in both patient groups, and a positive correlation with spirometry was measured, demonstrating good technique sensitivity and clinical validity.
Introduction
Clinical assessment of pulmonary ventilation delivers invaluable functional information relevant to the management of respiratory disease. However, current measures of pulmonary ventilation can prove deficient due to inherent limitations: spirometry provides no spatially localised information, while CT and ventilation-perfusion scans incur ionising radiation, deterring serial use. Hyperpolarised (HP) gas MRI enables direct assessment of lung structure and function without recourse to ionising radiation, with proven efficacy in patient populations,1,2 but requires access to hyperpolarising equipment, which could limit broad clinical uptake.19F-MRI of inhaled perfluoropropane (PFP) is emerging as a viable alternative to HP-MRI for investigating lung ventilation properties, with scope for translation to clinical practice.3,4 We have previously demonstrated reproducibility of this technique in a dual-centre study of 38 healthy volunteers.5 Here, we aimed to assess the utility of 19F-MRI of inhaled PFP in patient populations by measuring changes in ventilation in patients with asthma and patients with chronic obstructive pulmonary disease (COPD) following administration of a bronchodilator.
Methods
42 patients with a physician diagnosis of stable moderate or severe asthma (40 at Newcastle, 2 at Sheffield; 25M/17F; aged 18-91) and 25 patients with severe COPD with evidence of emphysema on a previous CT scan (Newcastle: 24, Sheffield: 1; 16M/9F; aged 59-82), provided written consent, were screened for eligibility, and recruited to the study. After withholding bronchodilators for 12-24 hours, all participants underwent spirometry followed by an MRI scan session. MR images were acquired at both sites using dual-tuned 19F/1H birdcage torso coils (Rapid Biomedical GmbH, Germany) interfaced to a Philips 3T Achieva scanner (Newcastle) or Philips 3T Ingenia scanner (Sheffield). MRI comprised conventional anatomical 3D 1H-MR imaging during a breath hold at maximal inhalation and 3D 19F-MRI, acquired within a breath hold following three deep wash-in inhalations of 79% PFP/21% oxygen mixture (3D SPGR, TE=1.7ms, TR=7.5ms, flip angle=45°, FOV=400x320x250mm3, resolution=10x10x10mm3, bandwidth=500Hz/pixel, averages=3, acquisition time=13.4s). Spirometry and MRI were repeated following administration of 2.5mg nebulised salbutamol. Anatomical 1H images were registered to 19F-MR ventilation images and segmented to determine lung volume and lung ventilated volume respectively, from which percent ventilated lung volume (%VV) was determined. Linear mixed effects models were used to compare %VV measurements between healthy volunteers (38 volunteers, mean age=41, range=23-67) and asthma/COPD groups and pre- and post-salbutamol measurements.Results
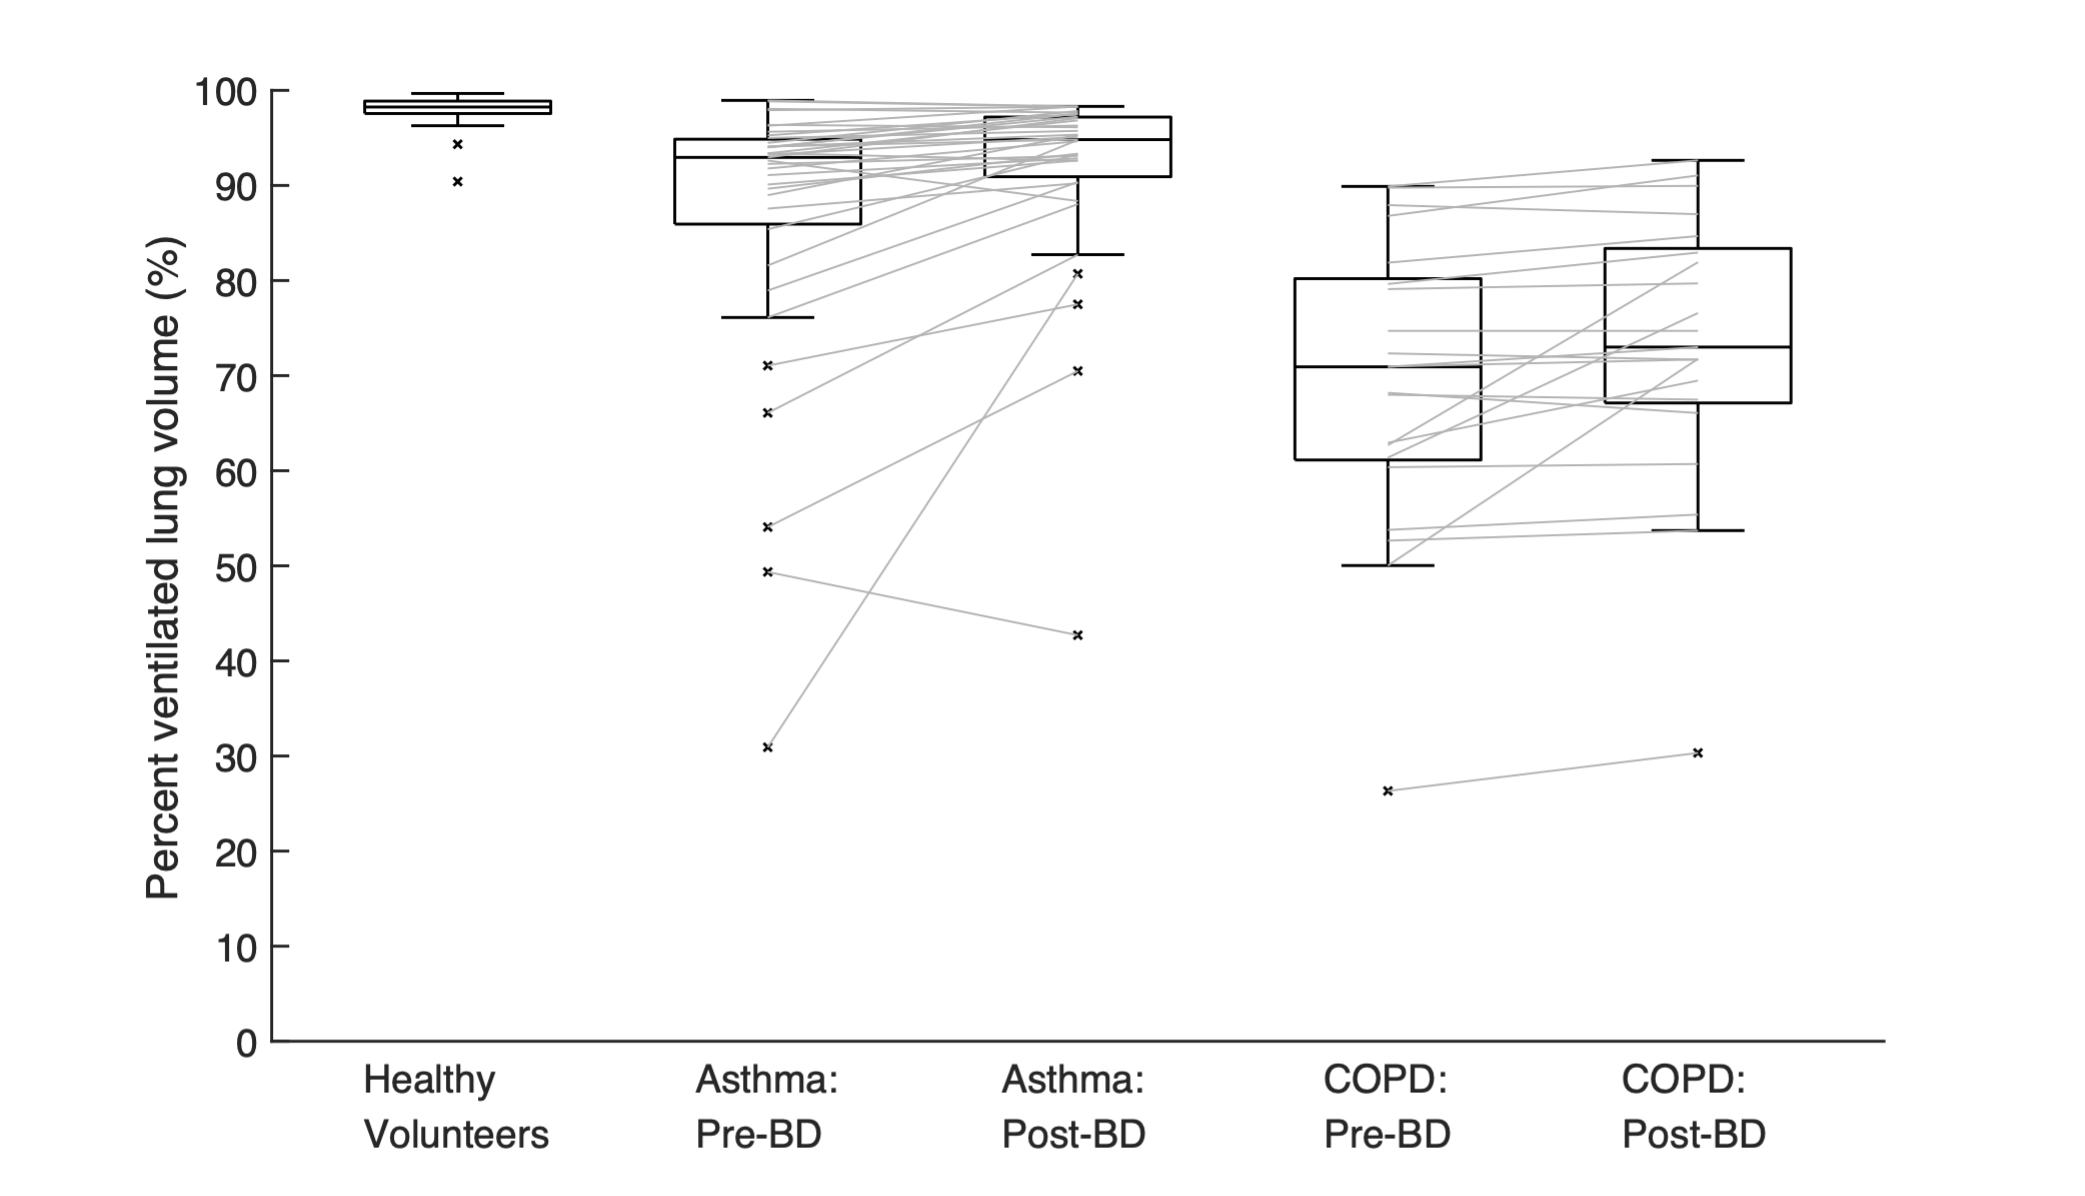
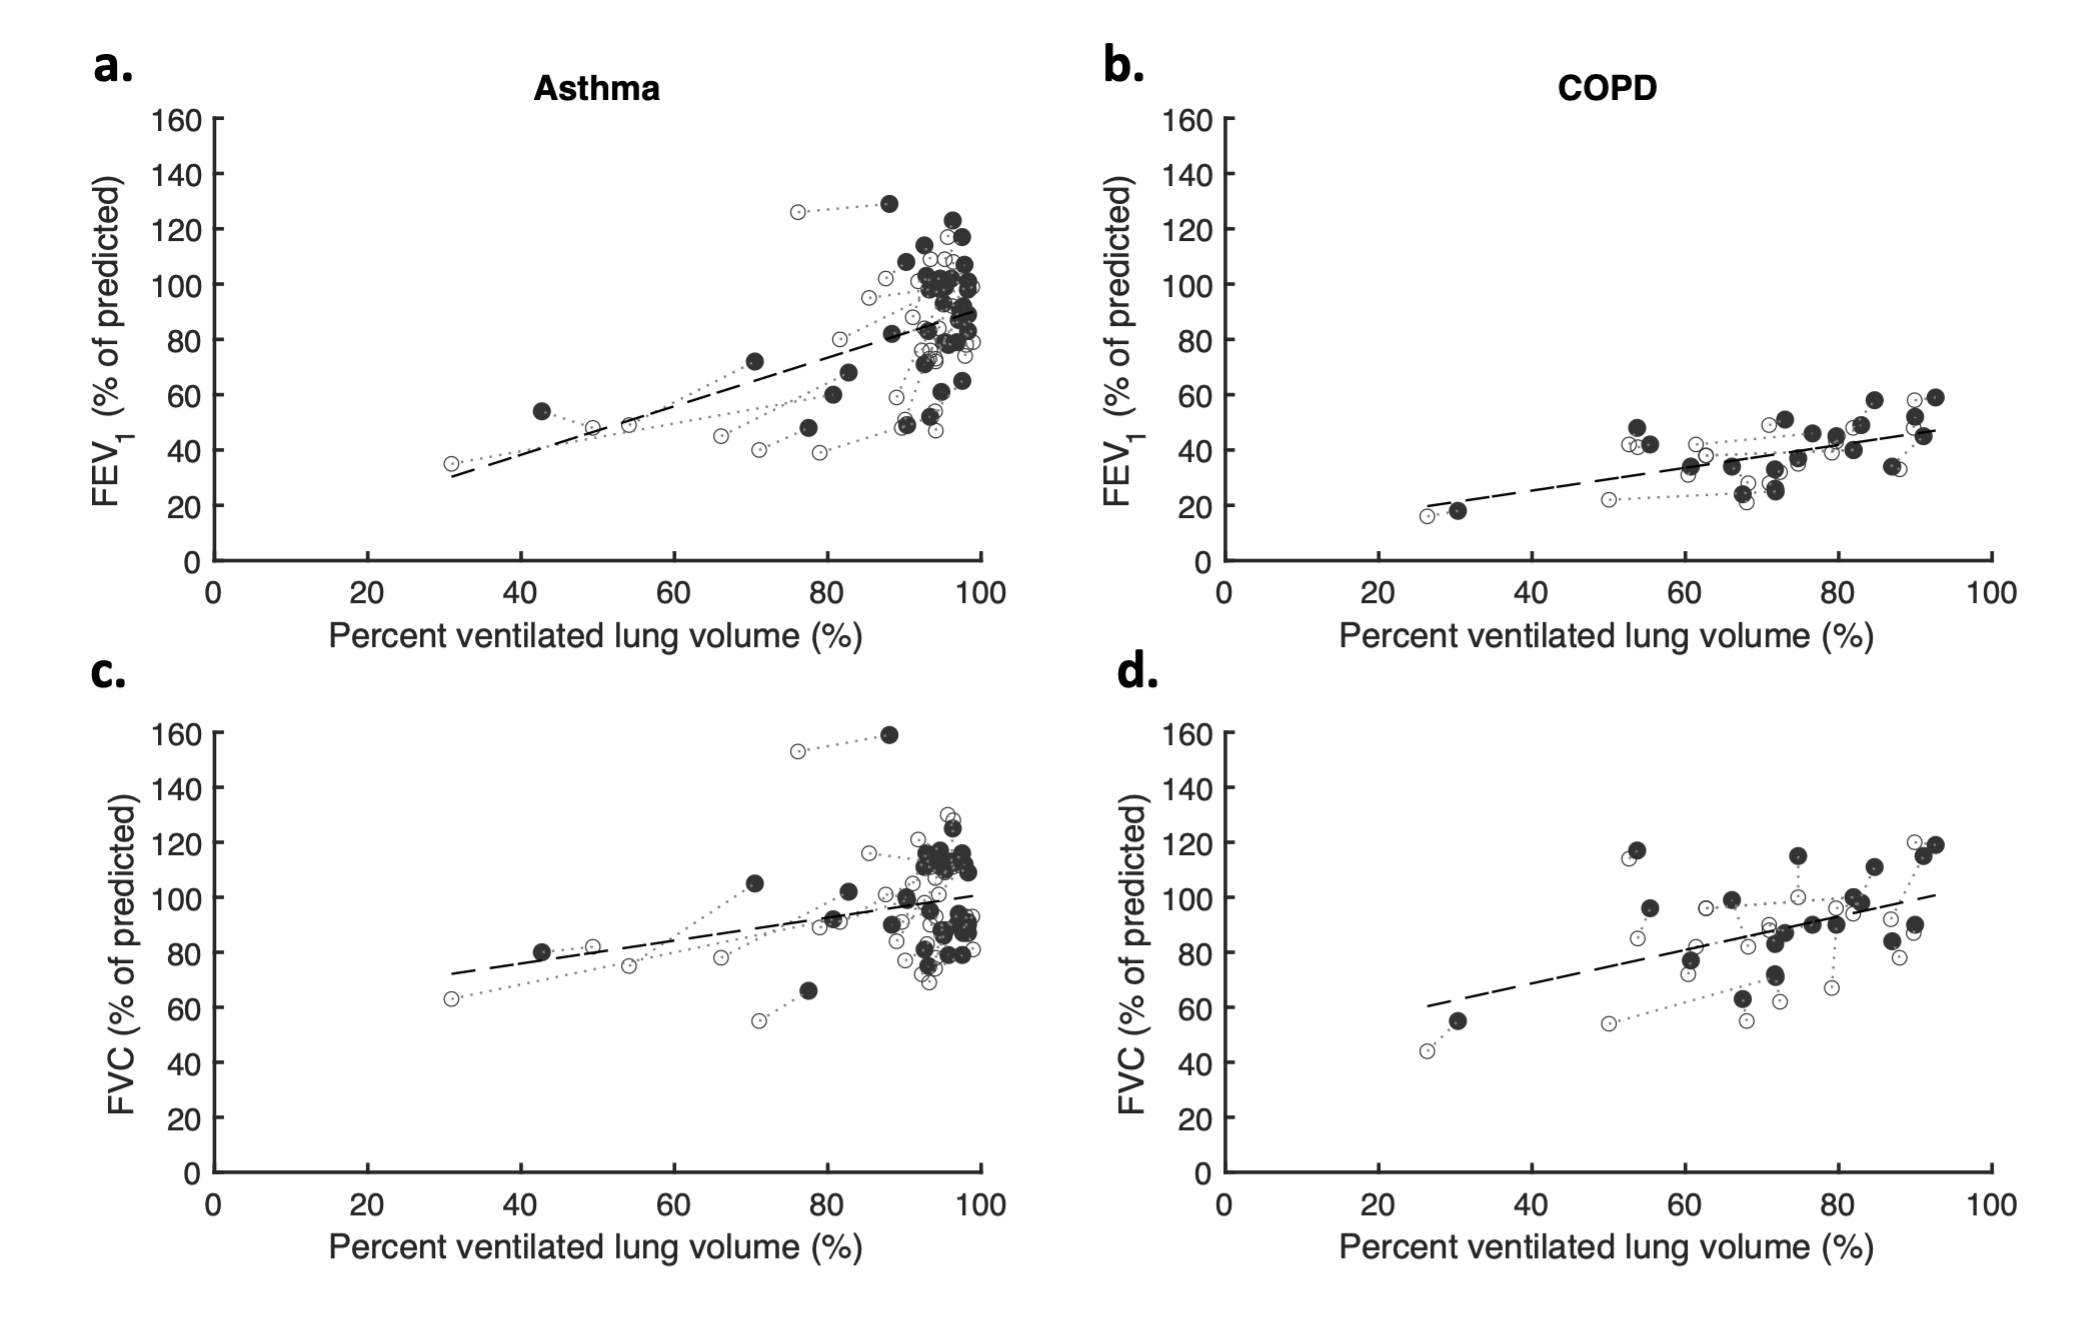
19F-lung MRI was well-tolerated with no adverse events. Eight participants were withdrawn in the interval between screening and the MRI due to a change in health, claustrophobia, or no longer wishing to participate. Three datasets were excluded from analysis due to a coil fault. Images representative of the remaining 56 patient datasets depicting PFP signal pre- and post-bronchodilator in a patient with asthma and a patient with COPD are displayed in Figure 1, adjacent to an equivalent healthy volunteer dataset collected in an earlier phase of this study.5Achieved image quality was adequate for analysis in all datasets. The difference in mean baseline %VV between patients with asthma (mean(SD)=87.2(14.3)) and healthy volunteers (97.8(1.42)) and between patients with COPD (69.1(16.6)) and healthy volunteers are both statistically significant (p<0.001 in both cases, 95% confidence intervals (CI) for difference (7.0,14.2) and (23.2,34.3), respectively). A significant increase in %VV measurements was demonstrated between pre- and post-bronchodilator in the asthma group [87.2(14.3) versus 91.5(10.6), n=35, p<0.001, 95% CI for difference (1.6,8.0)] and COPD group [69.1(16.6) versus 73.2(15.1), n=21, p<0.001, 95% CI for difference (0.6,6.9)], Figure 2. Positive correlations were observed between %VV and both the spirometric indices of forced expiratory volume in 1 second (FEV1) and forced vital capacity (FVC) in the patients with asthma (Figure 3).
Discussion
Our results demonstrate that %VV, measured within a single breath-hold, is significantly reduced in patient groups, correlates well to spirometric indices, and is sensitive to treatment response, upholding the clinical validity of this novel technique. Age-matching was not performed between healthy volunteers and patients due to a limited number of eligible patients and the healthy volunteer phase being performed first. The study protocol was implemented successfully at two research sites on different scanner systems, where the 19F-MR image quality was universally adequate for image segmentation and analysis, albeit with anterior signal drop-off noted in Figure 1, which may be partly physiological, or rectified with use of a different coil configuration (such as a 19F-transmit array coil).The measure %VV (or it’s inverse, ventilation defect percent (VDP), commonly used in the HP-MRI literature) permits quantitative validation of inhaled gas MR techniques by binarizing signal distribution following a fixed wash-in period into ‘ventilated’ and ‘non-ventilated’. This insensitivity to regions with slow wash-in makes it an imperfect metric for clinical assessment. Ongoing development of novel multi-breath dynamic 19F-MR imaging techniques6,7 (ill-suited to HP-gas MRI due to their transient T1 and substantial cost at higher gas volumes)1 in parallel with acquisition sequence optimisation,4 permit assessment of voxel-wise wash-in rates as a complementary quantitative outcome, presenting a clear route to enhance future clinical scope.
Conclusion
19F-MRI of inhaled PFP permits 3D full-lung imaging and regional visualisation of gas distribution. Here, we have performed the first study to validate its sensitivity to treatment response in patient cohorts using the quantitative metric %VV, representing methodical progress towards maturation of 19F-MRI into a functional imaging tool.Acknowledgements
The authors wish to thank the research radiographers at the Newcastle Magnetic Resonance Centre, Newcastle University and the Sheffield Teaching Hospitals NHS Foundation Trust, Sheffield.References
1) Marshall H, Stewart NJ, Chan H, et al. In vivo methods and applications of xenon-129 magnetic resonance. Prog. Nucl. Mag. Res. 2021;122:42–62.
2) Eddy RL, Parraga G. Pulmonary xenon-129 MRI: new opportunities to unravel enigmas in respiratory medicine. Eur. Respir. J. 2020;55(2):1901987.
3) Couch MJ, Ball IK, Li T, et al. 19F MRI of the lungs using inert fluorinated gases: challenges and new developments. J. Magn. Reson. Imaging. 2019;49(2):343-354.
4) , Pippard BJ, Hollingsworth, KG, et al. Optimized and accelerated 19F‐MRI of inhaled perfluoropropane to assess regional pulmonary ventilation. Magn. Reson. Med. 2019;82:1301-1311.
5) , Neal MA, Maunder AM, et al. Reproducibility of 19F-MR ventilation imaging in healthy volunteers. Magn. Reson. Med. 2021;85:3343-3352.
6) Pippard BJ, Neal MA, Simpson AJ, Thelwall PE. Assessing ventilation/perfusion properties with dynamic 19F-MRI of inhaled perfluoropropane. European Respiratory Journal. 2019;54 (suppl 63) PA3160.
7) Gutberlet M, Kaireit TF, Voskrebenzev A, et al. Free-breathing dynamic 19F gas MR imaging for mapping of regional lung ventilation in patients with COPD. Radiology. 2018;286(3):1040-1051.
Figures
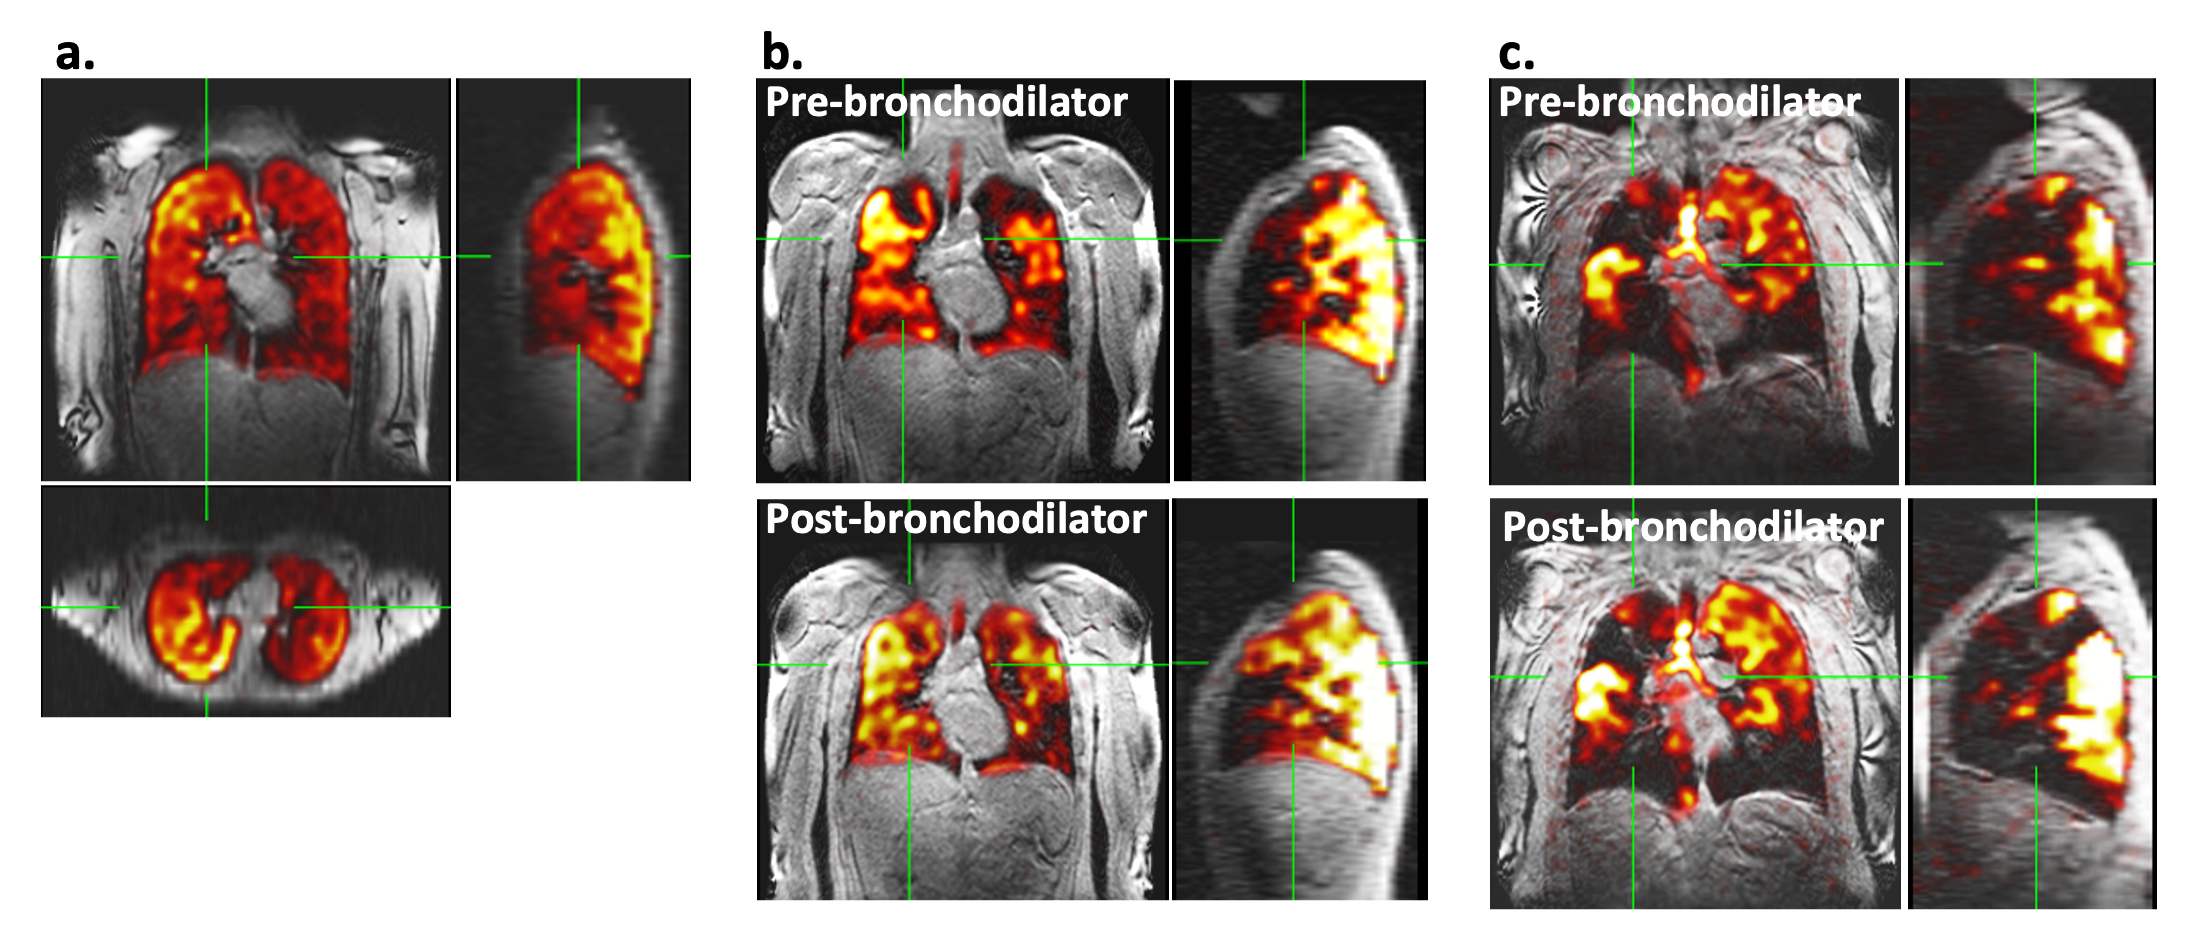
Figure 1: Orthogonal 19F-MR images of three representative participants acquired during a 13.4s breath hold (overlaid on greyscale anatomical 1H-MRI): a. Healthy volunteer (collected in earlier phase of this study), b. Patient with asthma pre- (top) and post-bronchodilator, with visibly reduced ventilation defects in the post-bronchodilator image c. Patient with COPD, with similar ventilation pattern pre- and post-bronchodilator. Nb. The anterior-posterior signal gradient is likely caused by a combination of physiology and B1 inhomogeneities.