0712
Deep learning-based stroke segmentation and patient outcome prediction1Biomedical Engineering, Duke University, Durham, NC, United States, 2Orthopaedic Surgery, Duke University School of Medicine, Durham, NC, United States, 3Radiology, Duke University School of Medicine, Durham, NC, United States, 4Neurology, Duke University School of Medicine, Durham, NC, United States, 5Brain Imaging and Analysis Center, Duke University School of Medicine, Durham, NC, United States
Synopsis
Keywords: Multimodal, Data Analysis, Deep learning; Segmentation; Lesion Load; Stroke
We compared the ability of 2D and 3D U-Net Convolutional Neural Network (CNN) architectures to segment ischemic stroke lesions and predict patient outcome using single-contrast (DWI) and dual-contrast images (T2w FLAIR and DWI). The predicted lesion segmentation metrics and location relative to corticospinal tract correlated with post-stroke patient outcome measured by National Institutes of Health Stroke Scale (NIHSS). The 2D multi-modal CNN achieved the best results with mean Dice of 0.74. The highest correlation was for weighted-lesion load with both baseline and 90-days NIHSS (80%, p<0.001). Our results support that multi-contrast MR helps automate lesion segmentation and predict post-stroke outcomes.Introduction
Magnetic resonance (MR) imaging (MRI) is commonly used to diagnose, assess and monitor stroke. Accurate and timely segmentation of stroke lesions provides the anatomico-structural information that can aid physicians in predicting prognosis, decision making and triaging rehabilitation strategies. Clinical MR protocols including diffusion-weighted imaging (DWI) and T2-weighted fluid attenuated inversion recovery (FLAIR) are often utilized in stroke evaluation1-3. These imaging sequences are usually acquired with different spatial resolutions due to time constraints, thus voxels may be anisotropic, particularly for DWI, where resolution is reduced in the slice direction. We evaluated single (DWI) and multi-modal (DWI+FLAIR) 2D and 3D U-Net-based segmentation methods to assess whether the segmentation performance of multi-modal methods outperforms that of single-modality approaches. We modeled the relationships between patient impairment/recovery in both early- and late-stages, and stroke lesion metrics and location relative to important motor white matter tracts, such as the corticospinal tract (CST). Our study addresses a need for a robust automated segmentation of acute stroke lesions from diagnostic clinical scans, and further using this information for patient recovery outcome prediction1,2.Methods
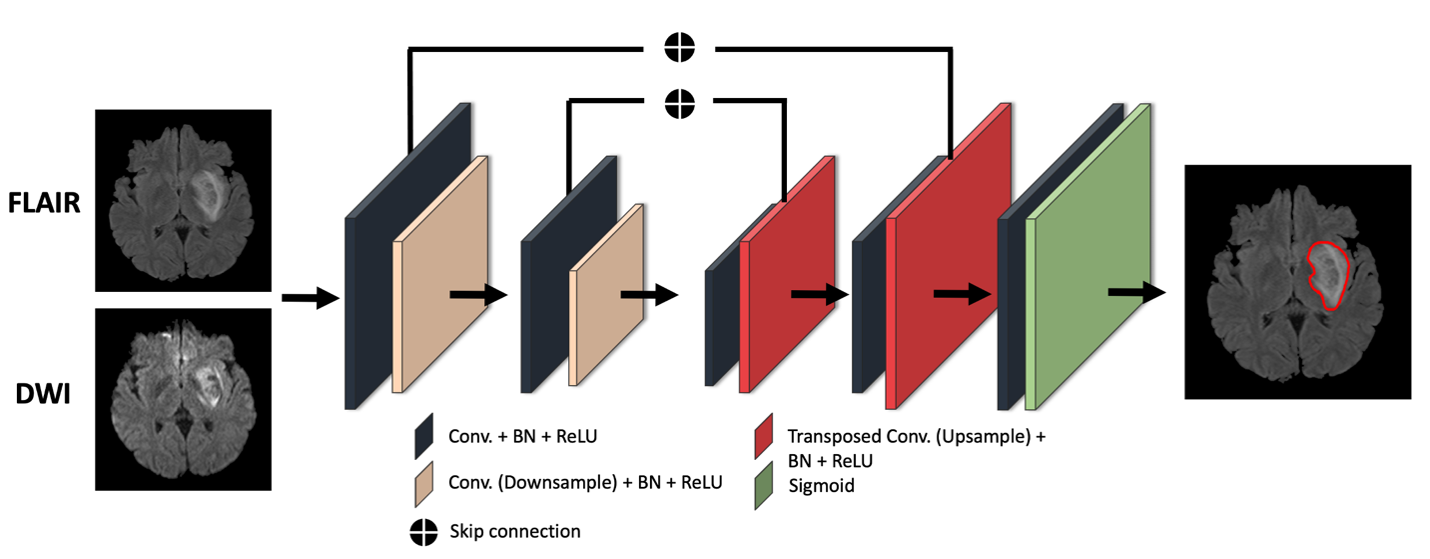
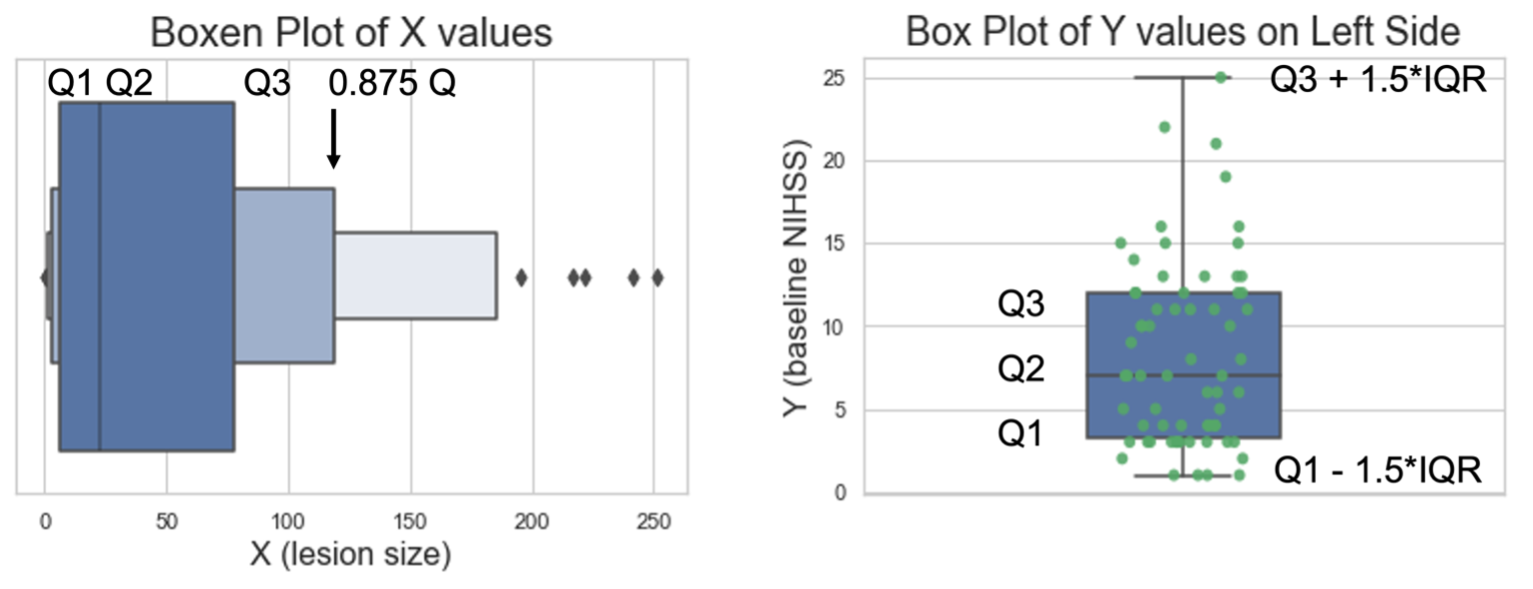
79 stroke patients were scanned using multiple MRI contrasts, including FLAIR and DWI at multiple hospitals, and had clinical evaluations that included the National Institute of Health Stroke Scale (NIHSS) at baseline and 90-days following the first session. The NIHSS is a standardized outcome measure of stroke severity in clinical and research settings3. All DWI and FLAIR images were registered to a reference FLAIR image with a matrix size of 512x512x32 with 0.43x0.43x6 mm resolution using rigid, affine and diffeomorphic transform from the Advanced Normalization Tools (ANTs)4,5. 2D multi-modal CNN, 3D multi-modal CNN, 2D CNN and 3D CNN methods were compared with mean Dice coefficient. We chose a U-Net strategy6 with experimentally optimized number of layers, batch size, kernel size and filter numbers and used early fusion method to combine DWI and FLAIR images for multi-modal methods as illustrated in Figure 1. To evaluate the impact of lesion size and position relative to white matter tracts involved in voluntary motor function, i.e., the corticospinal tract (CST) was mapped onto each subject, from the registered CST delineated in the Illinois Institute for Technology (IIT) atlas7. The IIT B0 map was registered to reference FLAIR images with rigid, affine, and diffeomorphic SyN transformations. The transformations were applied to the CST mask using B-spline interpolation to register the CST into our subject space. From the intersection of the CST with the lesion we calculated the lesion load (CST-LL), and a weighted-lesion load (wCST-LL) that accounts for the narrowing of CST tracts in the lower brain by introducing slice-based weights to lesion load8.To account for the large number of small lesions relative to large lesions, and for the presence of outliers, we applied a dynamic outlier removal strategy on the y values (NIHSS) on the left portion (small-valued x data points) and right portion (large-valued x data points). We detected outliers and removed data points that satisfy any of the following criteria: Y<Q2−w∗IQR or Y>Q2+w∗IQR; where the weight w is defined differently for the right portion and the left portion, so that the distribution of x would be balanced in terms of size, as shown in Figure 2. The weights of 0.3 and 2 were chosen for left and right portions respectively. We incorporated a monotonically increasing/decreasing constrained polynomial regression to fit lesion metrics to clinical metrics and calculated R-squared values and the corrected AIC (AICc)9.
Results
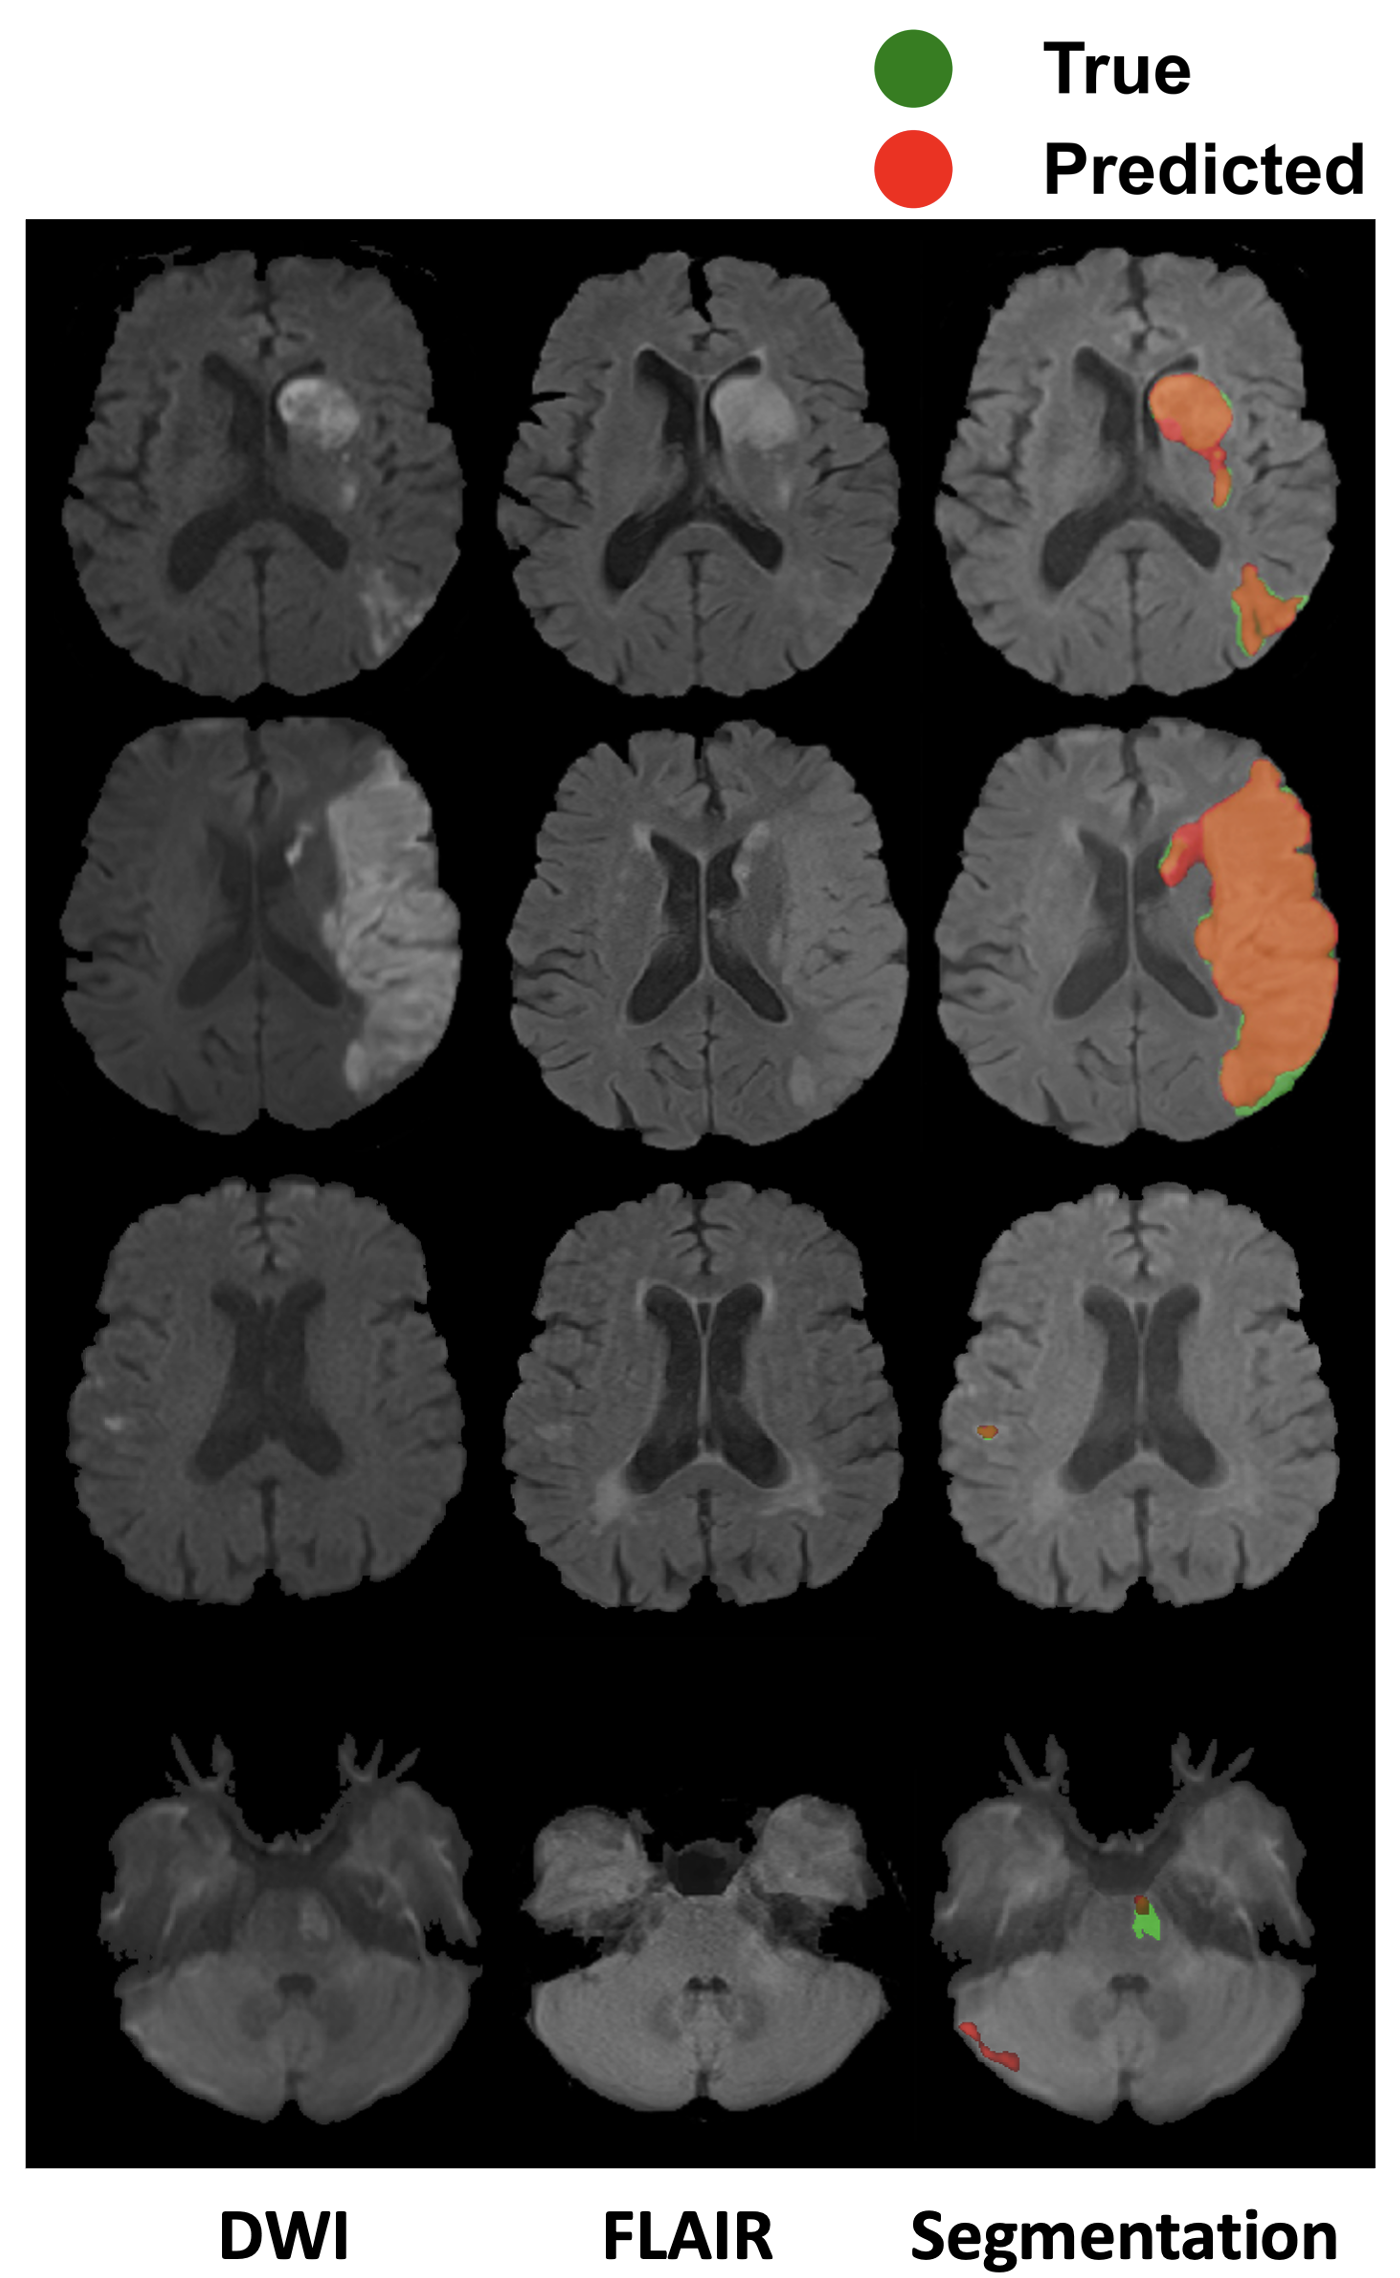
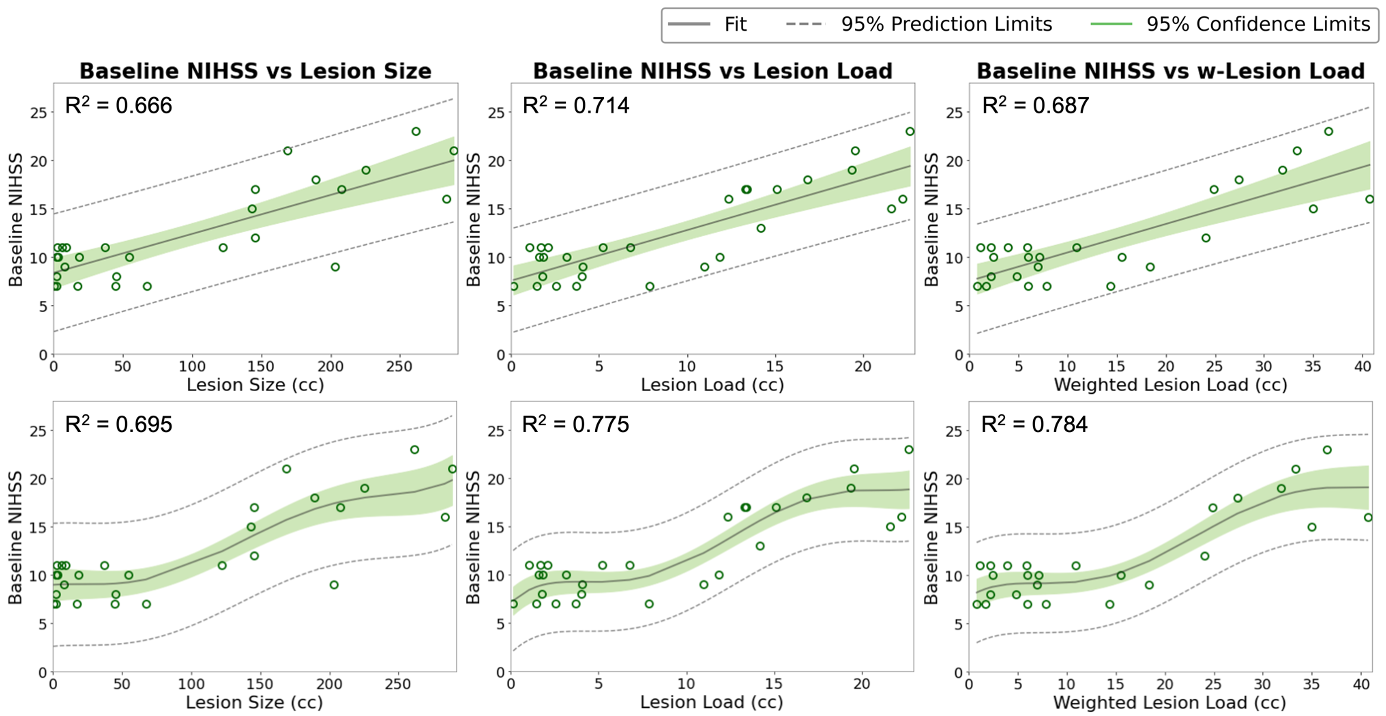
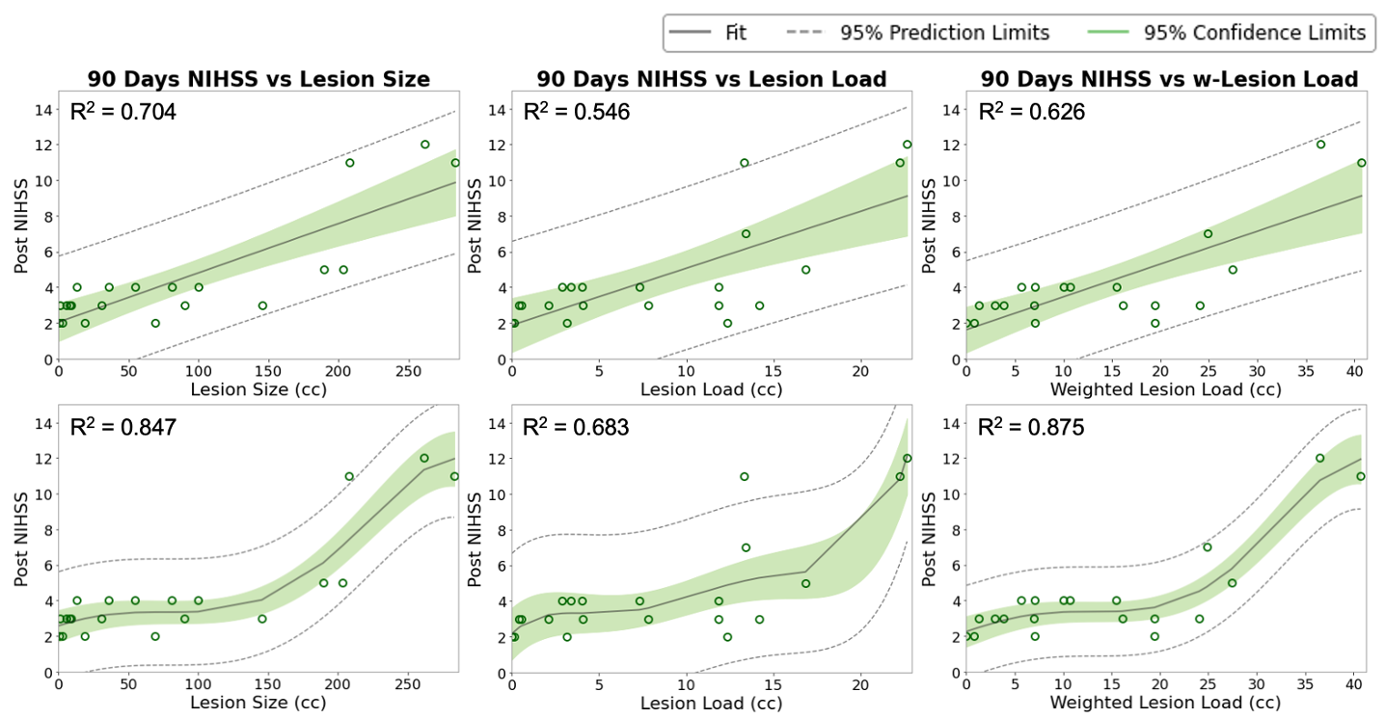
Qualitative segmentation results of 2D multi-modal CNN are shown in Figure 3. The first column shows DWI images, the second column shows FLAIR images, and the third column shows overlaid ground truth and predicted stroke lesion masks on FLAIR images. The method performed well in general, but in the last row the predicted mask in the cerebellar/brainstem region suffers in part because of T2 shine-through artifacts present in the DWI image, and the limited number of brainstem lesions in the training dataset. Training time was 24 h and segmentation time was <10 s.We tested 2D versus 3D and single-modal versus multi-modal U-Nets. 2D multi-modal U-Net achieved the best performance with mean Dice of 0.74 (95% CI: 0.71, 0.77). Thus, 2D multi-modal was chosen to calculate lesion metrics (lesion size, CST-LL and wCST-LL), and these metrics were used to predict clinical metrics. The baseline and 90-days NIHSS were compared with lesion size, CST-LL and wCST-LL calculated from segmentation results of the 2D multi-modal method. Plots of baseline NIHSS score and 90-days NIHSS score versus lesion metrics are shown in Figure 4 and Figure 5 respectively. The wCST-LL correlated significantly with baseline and 90-days NIHSS and outperformed other stroke lesion metrics in terms of R-squared values in the proposed constrained quintic polynomial regression model.
Conclusion
A pipeline that can quickly segment stroke lesions from clinical MRI scans and provide quantitative metrics can help clinicians to improve detection, decide treatment in acute stroke care, and triage neurorehabilitation strategies. We focused on building such a framework that includes pre-processing, segmentation, and outcome prediction. Our pipeline can be improved by adding more subjects and subject specific data, and can benefit from pre-training on larger data sets.Acknowledgements
This work was supported by the National Institutes of Health through RF1 AG057895, R01 AG066184, U24 CA220245, RF1 AG070149 and by the American Heart Association through 14SDG1829003.References
1. Leiva-Salinas, C. and M. Wintermark, Imaging of Acute Ischemic Stroke. Neuroimaging Clinics, 2010. 20(4): p. 455-468.
2. Feng, W., et al., Corticospinal tract lesion load: An imaging biomarker for stroke motor outcomes. Annals of Neurology, 2015. 78(6): p. 860-870.
3. Lyden, P., et al., Improved reliability of the NIH Stroke Scale using video training. NINDS TPA Stroke Study Group. Stroke, 1994. 25(11): p. 2220-2226.
4. Avants, B.B., N. Tustison, and H. Johnson, Advanced Normalization Tools (ANTS) Release 2.x. 2014.
5. Avants, B.B., et al., Symmetric diffeomorphic image registration with cross-correlation: Evaluating automated labeling of elderly and neurodegenerative brain. Medical Image Analysis, 2008. 12(1): p. 26-41.
6. Ronneberger, O., P. Fischer, and T. Brox, U-Net: Convolutional Networks for Biomedical Image Segmentation. Lecture Notes in Computer Science (including subseries Lecture Notes in Artificial Intelligence and Lecture Notes in Bioinformatics), 2015. 9351: p. 234-241.
7. Zhang, S. and K. Arfanakis, Evaluation of standardized and study-specific diffusion tensor imaging templates of the adult human brain: Template characteristics, spatial normalization accuracy, and detection of small inter-group FA differences. NeuroImage, 2018. 172: p. 40-50.
8. Zhu, L.L., et al., Lesion load of the corticospinal tract predicts motor impairment in chronic stroke. Stroke, 2010. 41(5): p. 910-915.
9. Hurvich, C.M. and C.L.L. Tsai, A CORRECTED AKAIKE INFORMATION CRITERION FOR VECTOR AUTOREGRESSIVE MODEL SELECTION. Journal of Time Series Analysis, 1993. 14(3): p. 271-279.
Figures