0704
Super-resolution neural network-driven mouse cerebrovascular mapping with MION-based MRI1Massachusetts General Hospital, Boston, MA, United States, 2University College London, London, United Kingdom, 3Massachusetts Institute of Technology, Boston, MA, United States
Synopsis
Keywords: Blood vessels, Alzheimer's Disease
High-resolution cerebrovascular mapping is crucial for the understanding of brain function. While the existing invasive imaging modalities map brain vasculature at the microscopic scale, they are mostly restricted to the cortical surface in small animals. The non-invasive penetrating cerebrovascular mapping for larger animals remains the privilege of MRI. To achieve high spatial resolution with MRI, we trained 3D U-net to super-resolve images from 75µm to 37.5µm isotropic resolution. Our results show a significantly improved segmented micro-vessel network and offer a powerful tool to identify the anatomical distribution of the microvessels in normal and degenerative brains longitudinally.Introduction
Novel ultrasound and optoacoustic imaging methodologies map the in vivo cerebrovasculature of mouse brains with ultra-high resolution 1-3. Due to the ultrasound absorption in the skull, the signal-to-noise ratio is significantly reduced when imaging larger animals, e.g., rats or marmosets, with thicker skulls. In a similar way, multi-photon imaging, either a large craniotomy or a thin skull is needed when imaging a larger animal’s brain. Although MRI presents superior penetrating capability for non-invasive brain mapping, the spatial resolution of MRI is much lower than the abovementioned methodologies. Here, we provide a proof-of-concept to implement the super-resolution neural network to improve the in vivo cerebrovascular mapping results from 75µm to 37.5µm isotropic resolution, presenting a much better segmented micro-vessel network of wild-type (WT) mice and transgenic mice with Alzheimer’s Diseases (AD).Methods
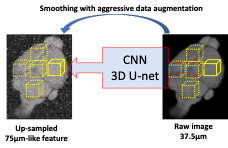
We used the 14T scanner equipped with a 1T/m gradient to acquire three sets of MION-based MRI datasets using 3D FLASH sequences (TR 200ms, TE, 4ms): (i) Ex-vivo ultra-high resolution brain image with 37.5µm isotropic resolution; (ii) in vivo WT mouse brain with 75µm isotropic resolution; and (iii) in vivo AD mouse brain with 75µm isotropic resolution. The super-resolution neural network is a 3D U-net, a type of convolutional neural network (CNN) with skip connections for dense prediction4,5. Our U-net has a lightweight architecture with three resolution levels, each with a convolutional layer with 32 features and a Leaky rectified linear unit6. The U-net was trained to super-resolve images by a factor of 2 in every dimension, from 75µ isotropic to 37.5µm isotropic (Fig 1). Specifically, it receives as input a trilinear upsampled image (i.e., living on a 37.5µm space, but with smooth, 75µm-like features), and estimates a residual that, when added to the input, produces a sharpened output. To train this CNN, we used random patches of size 64x64x64 voxels randomly cropped at every iteration from a single 37.5um isotropic scan. The patch was first downsampled by a factor of 2 to size 32x32x32 and then linearly upscaled back to 64x64x64. The upscaled path was fed as input to the U-net, and the difference between the two patches (i.e., the residual) as the target of the regression. Training used the Adam optimizer7 to minimize the sum of absolute values (i.e., L1 norm) between the target and predicted residuals. Aggressive data augmentation was used during training, to mitigate the small size of the training dataset and improve generalization ability, including noise and bias field injection; contrast, brightness, and gamma modification; and geometric augmentation including rotation, shearing, scaling, and nonlinear deformation. Trained converged in about 3 hours on an Nvidia RTX6000 GPU. The trained CNN was used to produce high-resolution images from the in vivo WT and AD mice.Results
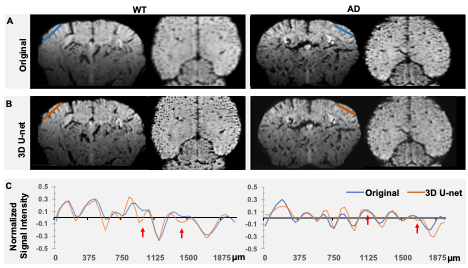
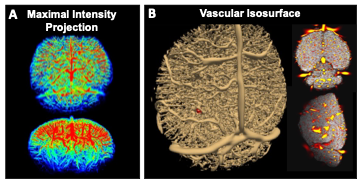
We input the in vivo MION-based MRI images from WT and AD mice to the trained CNN U-net to produce high-resolution images. Fig 2 shows two examples of original and U-net-driven datasets of WT and AD mice, presenting the improved resolution of U-net-driven images. From the line profiles covering the barrel cortex in both cases, we can detect the highly comparable localization of microvessels, as well as several smaller vessels identifiable in the U-net-driven images. Based on the inversed U-net-driven images, we can produce maximal projection intensity maps and 3D vascular isosurface maps (Fig 3).Discussion
This result shows the feasibility to improve the spatial resolution of in vivo MRI images using the CNN U-net network. We have shown that individual microvessels can be better identified in the U-net-driven images, which show high fidelity of cerebrovascular mapping. Although we only trained the U-net to super-resolve images to the factor of 2, it makes it possible to train CNN for super-resolution images with a higher factor, and eventually resolve smaller vessels toward the capillary beds. To further verify the fidelity of the U-net-driven cerebrovasculature, we can cross-examine the datasets with both low- and high-resolution images. It should be noted that the MION-based MR images highlighted vessels by T2* weighting, which amplifies the spin source based on iron susceptibility in a larger space than the real size of the vessel. When we push the resolution to single-digit micron resolution, it remains challenging to solve the capillaries if solely relying on T2* contrast.Conclusion
The CNN U-net-driven 3D vascular mapping improves vessel detection which is independent of the variability of MION dosage or TE-dependent contrasts. It offers a powerful tool to identify the anatomical distribution of the microvessels in normal and degenerative brains longitudinally. Also, the vascular isosurface volume maps can also be combined with single-vessel fMRI8-10 to study the brain-wide neurovascular coupling mechanisms in diseased brains.Acknowledgements
This research was funded by NIH funding (RF1NS113278, RF1NS124778, R01NS122904, R01NS120594, R21NS121642, R01AG070988, R21CA267315, 1RF1MH123195, 1R01EB031114, 1UM1MH130981), NSF grant 2123971, and the S10 instrument grant (S10 MH124733–01) to Martinos Center.References
1. Renaudin, N. et al. Functional ultrasound localization microscopy reveals brain-wide neurovascular activity on a microscopic scale. Nature methods 19, 1004-1012 (2022). https://doi.org:10.1038/s41592-022-01549-52
2. Zhu, X. et al. Real-time whole-brain imaging of hemodynamics and oxygenation at micro-vessel resolution with ultrafast wide-field photoacoustic microscopy. Light: Science & Applications 11, 138 (2022). https://doi.org:10.1038/s41377-022-00836-23
3. Lu, W. et al. Photoacoustic imaging of living mouse brain vasculature using hollow gold nanospheres. Biomaterials 31, 2617-2626 (2010). https://doi.org:https://doi.org/10.1016/j.biomaterials.2009.12.0074
4. Çiçek, Ö., Abdulkadir, A., Lienkamp, S. S., Brox, T. & Ronneberger, O. in Medical Image Computing and Computer-Assisted Intervention – MICCAI 2016. (eds Sebastien Ourselin et al.) 424-432 (Springer International Publishing).
5. Ronneberger, O., Fischer, P. & Brox, T. in Medical Image Computing and Computer-Assisted Intervention – MICCAI 2015. (eds Nassir Navab, Joachim Hornegger, William M. Wells, & Alejandro F. Frangi) 234-241 (Springer International Publishing).
6. Maas, A. L., Hannun, A.Y. and Ng, A.Y. in Proceedings of the 30th International Conference on Machine Learning Vol. 28 (2013).
7. Kingma, D. & Ba, J. Adam: A Method for Stochastic Optimization. International Conference on Learning Representations (2014).
8. He, Y. et al. Ultra-Slow Single-Vessel BOLD and CBV-Based fMRI Spatiotemporal Dynamics and Their Correlation with Neuronal Intracellular Calcium Signals. Neuron 97, 925-939 e925, doi:10.1016/j.neuron.2018.01.025 (2018).
9. Yu, X. et al. Sensory and optogenetically driven single-vessel fMRI. Nature methods 13, 337-340, doi:10.1038/nmeth.3765 (2016).
10. Chen, X. et al. Assessment of single-vessel cerebral blood velocity by phase contrast fMRI. PLoS Biol 19, e3000923, doi:10.1371/journal.pbio.3000923 (2021).
11. Frangi, A. F., Niessen, W. J., Vincken, K. L. & Viergever, M. A. in Medical Image Computing and Computer-Assisted Intervention — MICCAI’98. (eds William M. Wells, Alan Colchester, & Scott Delp) 130-137 (Springer Berlin Heidelberg).
Figures