0700
Machine learning-based prediction of stroke outcome in mice from MRI and behavioral testing1Klinik und Hochschulambulanz für Neurologie, Department of Experimental Neurology, Charité-Universitätsmedizin Berlin, corporate member of Freie Universität Berlin and Humboldt-Universität zu Berlin, Berlin, Germany, 2Center for Stroke Research Berlin, Charité-Universitätsmedizin Berlin, Berlin, Germany, 3NeuroCure Cluster of Excellence and Charité Core Facility 7T Experimental MRIs, Charité-Universitätsmedizin Berlin, Berlin, Germany, 4School of Life Sciences, University of Nottingham, Berlin, Germany, 5QUEST Center for Transforming Biomedical Research, Berlin Institute of Health at Charité – Universitätsmedizin Berlin, Berlin, Germany, 6Einstein Center for Neuroscience, Berlin, Germany, 7Bernstein Center for Computational Neuroscience, Berlin, Germany, 8German Center for Cardiovascular Research (DZHK), partner site Berlin, Berlin, Germany, 9NeuroCure Clinical Research Center, Charité-Universitätsmedizin Berlin, Berlin, Germany, 10German Center for Neurodegenerative Diseases (DZNE), Berlin, Germany, 11Berlin Institute of Health (BIH), Berlin, Germany
Synopsis
Keywords: Stroke, Animals, Machine learning, Mice, MCAO
Prediction of motor-functional outcome in mice could potentially guide researchers in their treatment decisions in preclinical stroke intervention studies and support outcome-dependent stratifications. We pooled 13 studies in which mice underwent identical MRI and behavioral testing protocols. In this large cohort of mice (n=148), we developed and compared machine learning-based predictors of post-stroke recovery.Introduction
Prediction of motor-functional outcome in mice could potentially guide researchers in their treatment decisions in preclinical stroke intervention studies and support outcome-dependent stratifications. In humans, magnetic resonance imaging (MRI) is used to assess stroke volume and topology [1]. Total lesion volume is broadly used to analyze stroke severity and predict functional outcome, but the prognostic value has been shown to be better when including lesion location measures [2-5]. This was also shown in an exploratory preclinical study using a porcine stroke model [6]. While mice are the most commonly used animals in preclinical stroke research, systematic analysis of outcome predictors is lacking. The goal of this study was to develop predictors of post stroke outcome in mice using machine learning on behavioral and MRI data.Methods
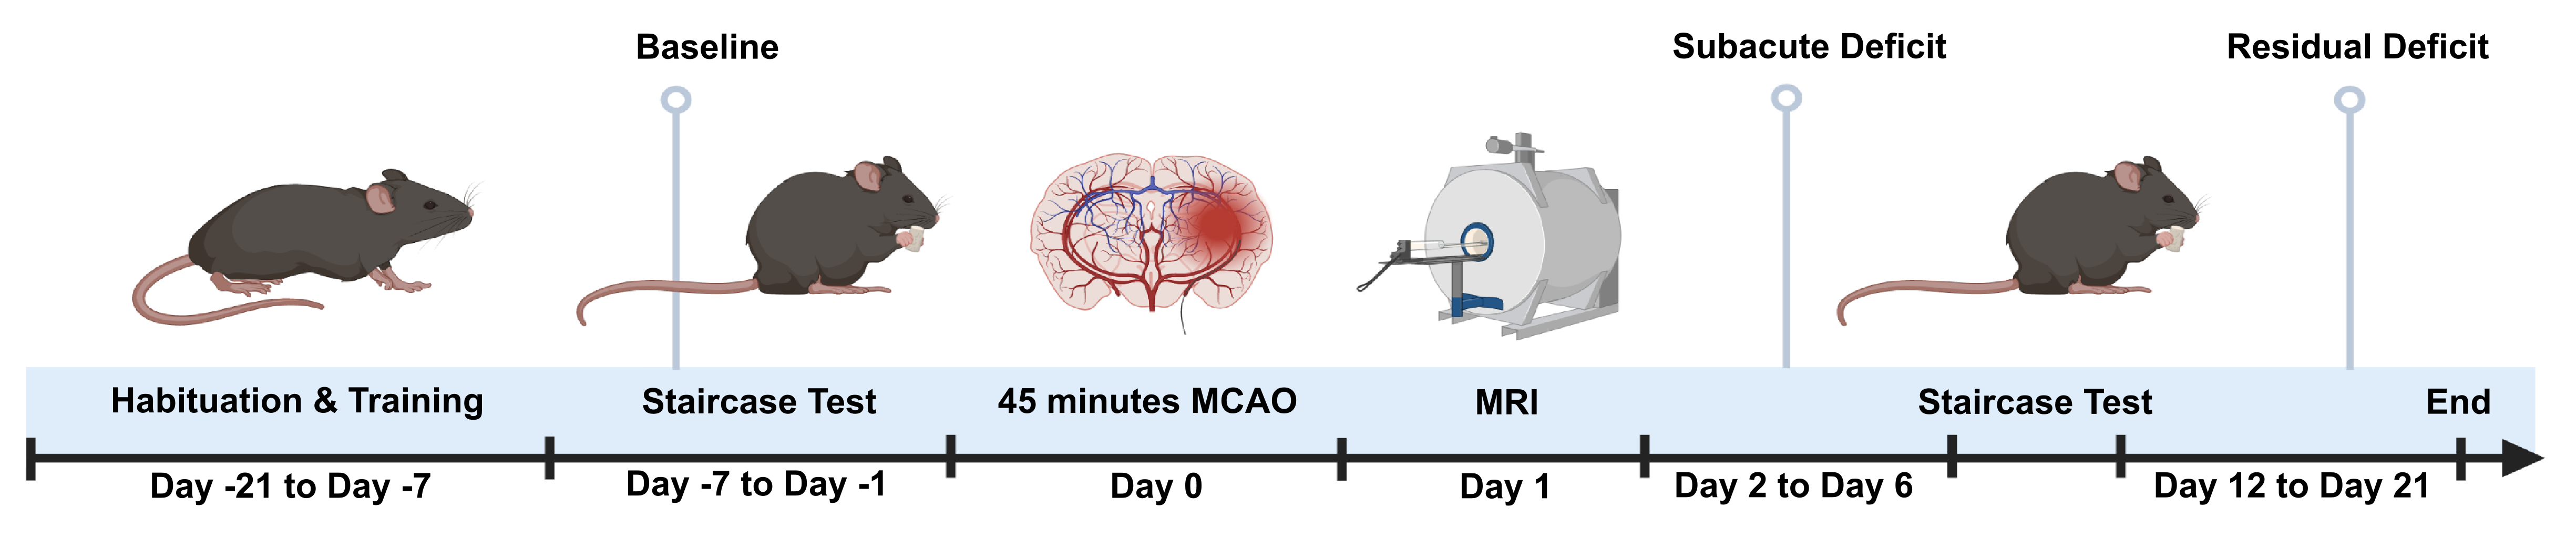
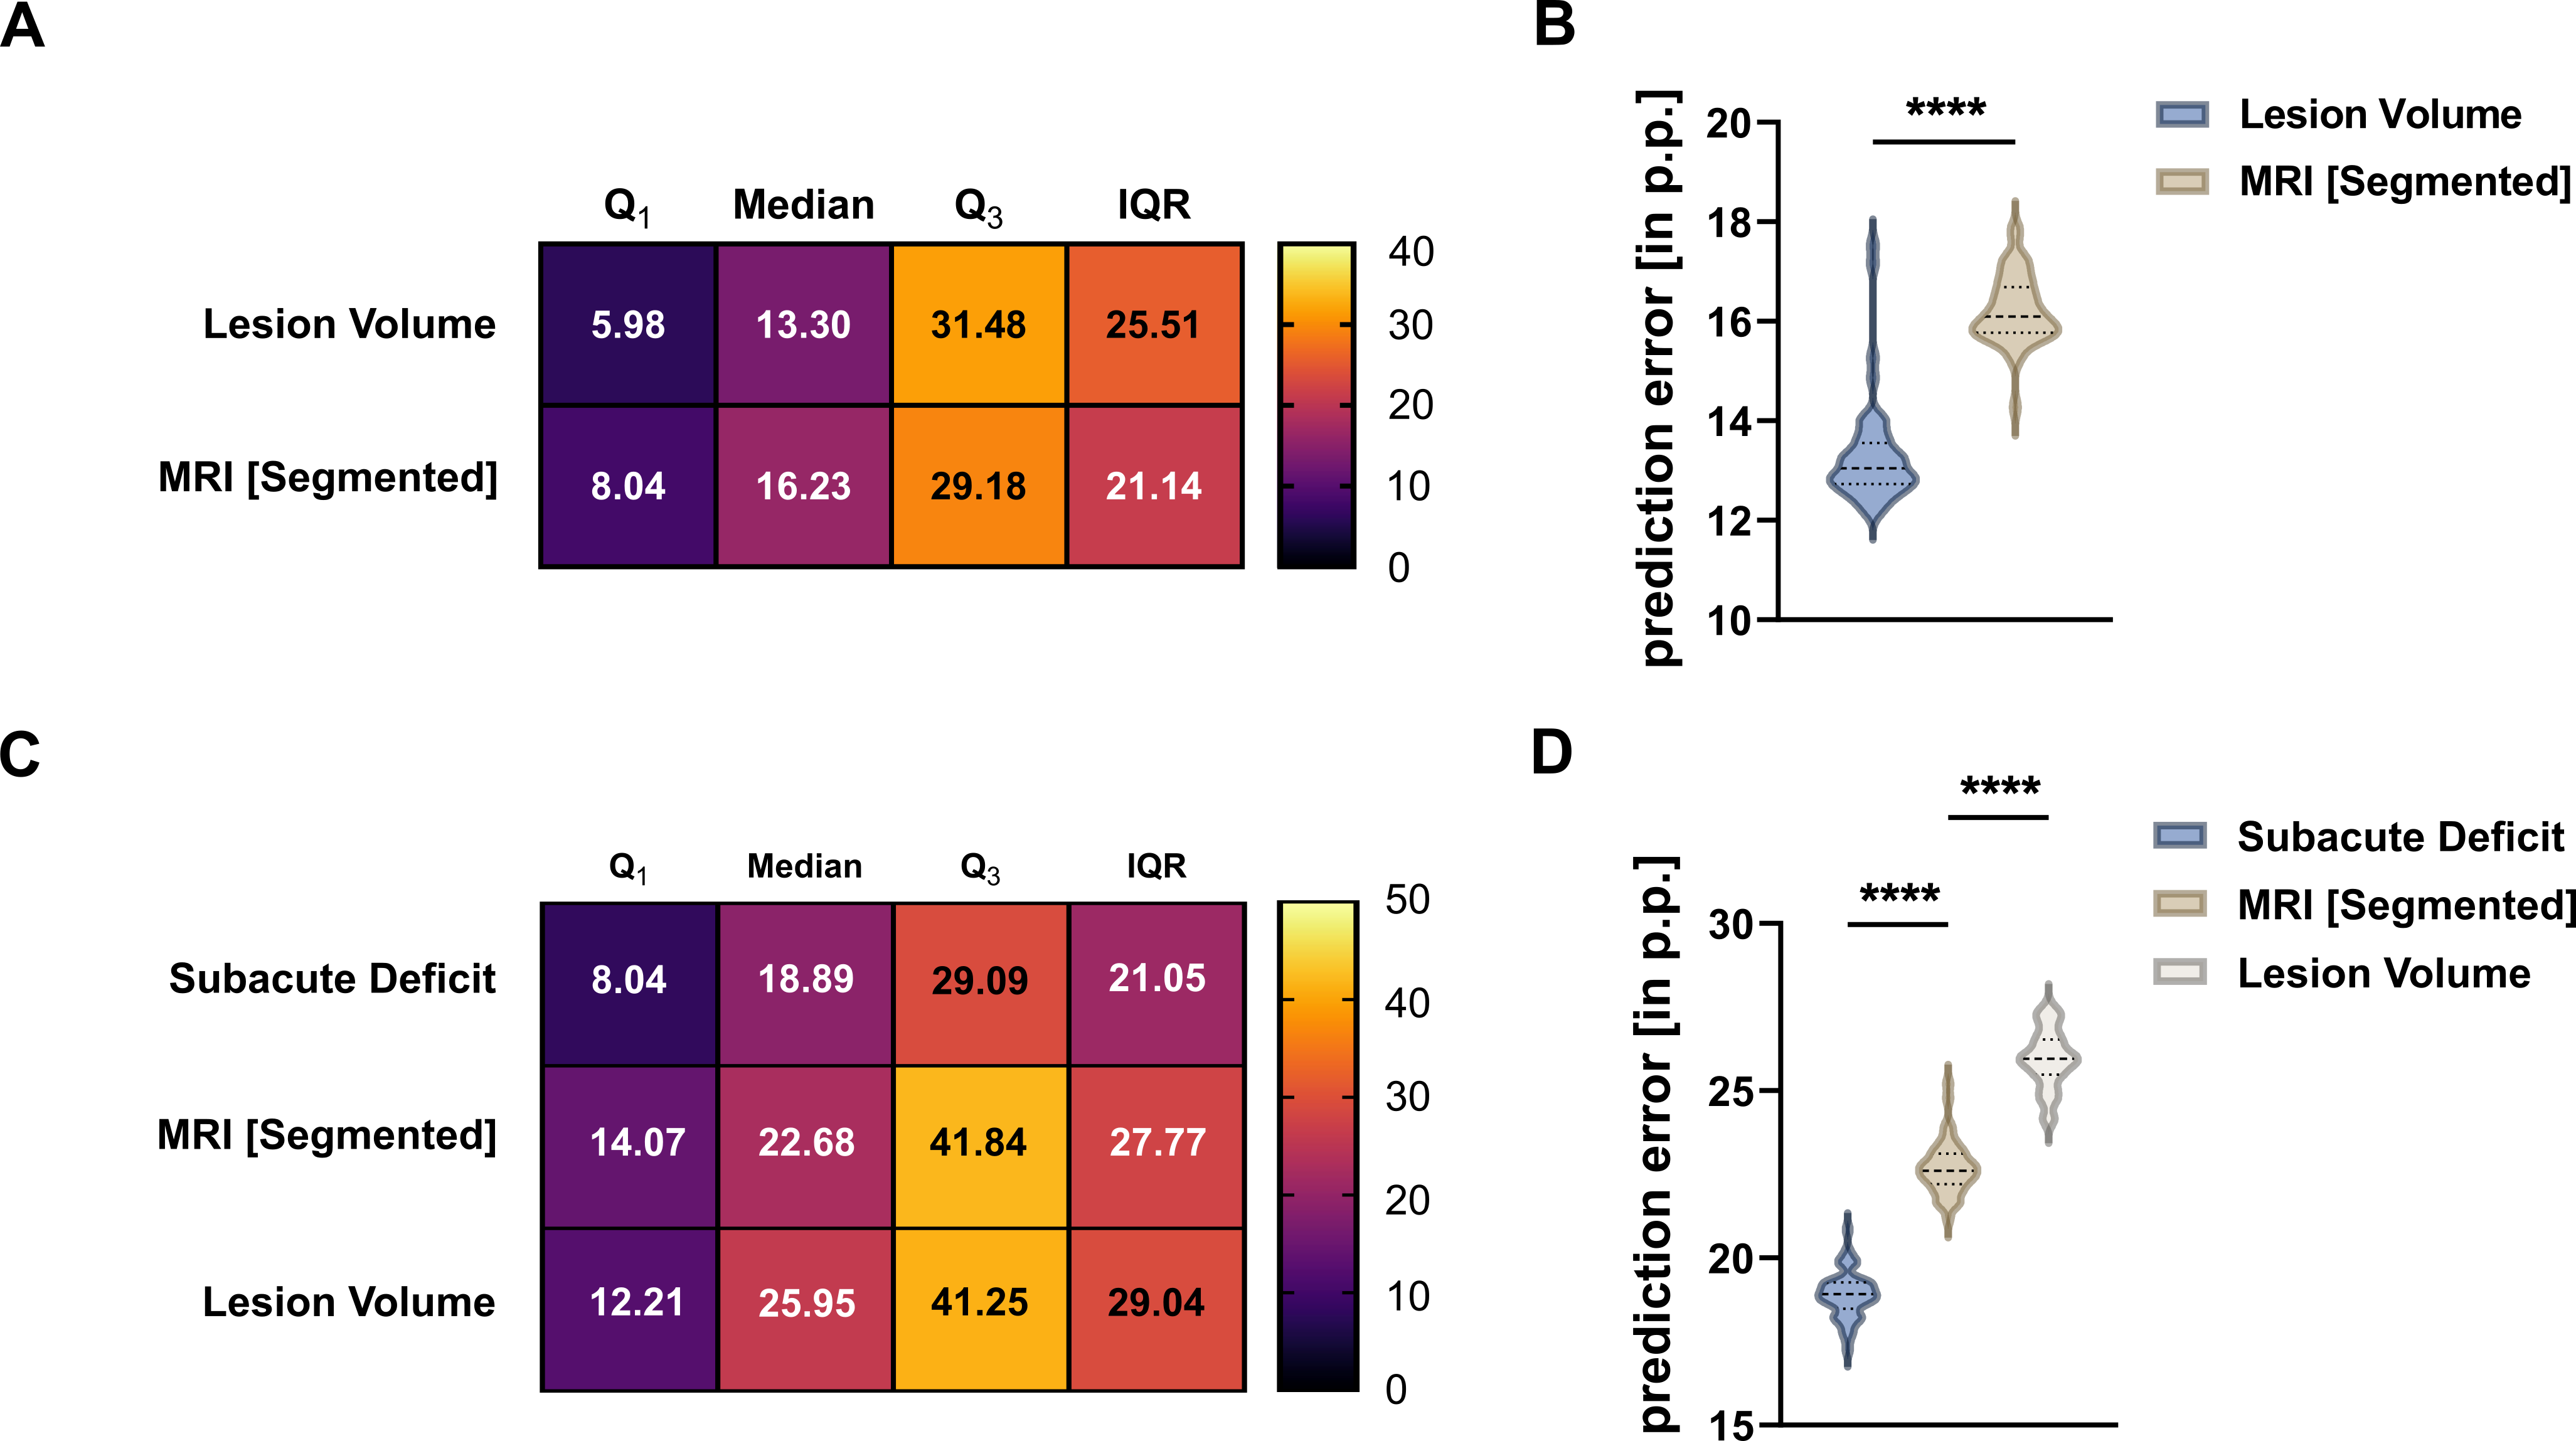
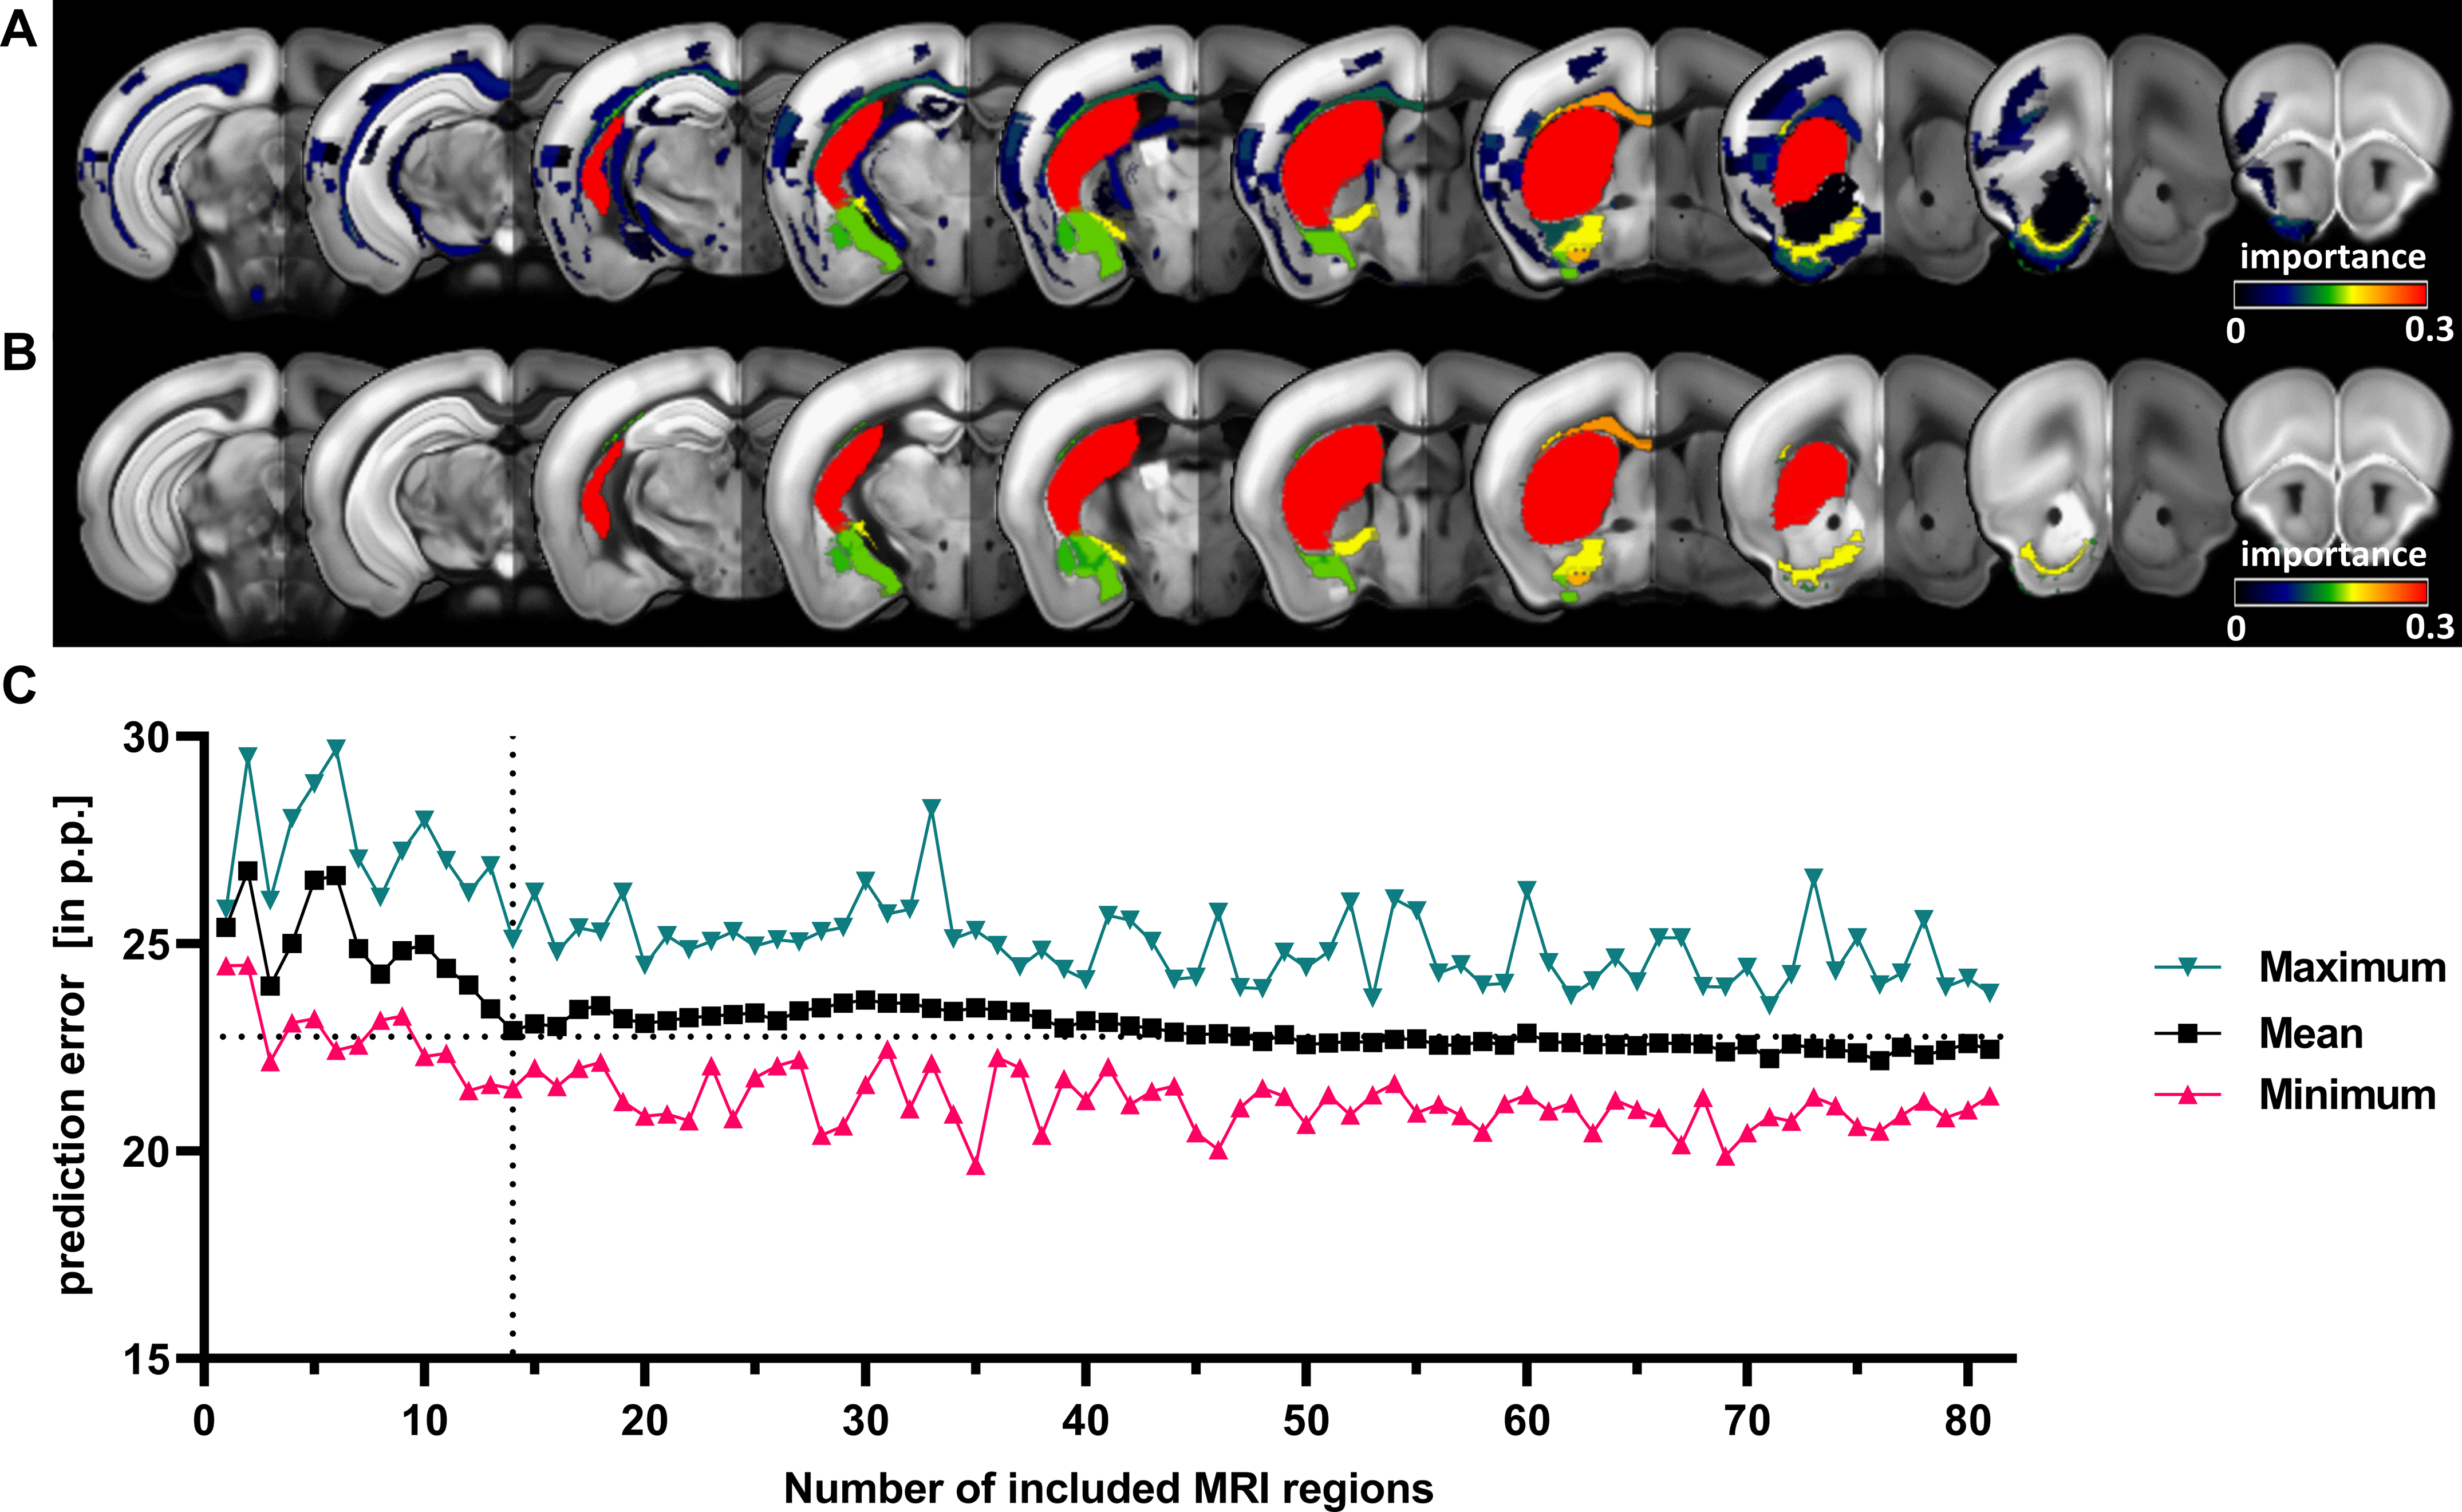
Data from a total of 13 studies with mice undergoing 45 minutes of middle cerebral artery occlusion (MCAO) were pooled and split into a training (n=98) and testing (n=50) cohort. Sham animals (n=18) were used to control behavioral testing. A replication cohort of mice from an ongoing study (n=37) was used to investigate how results translate in an independent dataset. Fig. 1 illustrates the study design. Motor function was measured using a modified protocol for the staircase test of skilled reaching. Phases of subacute and residual deficit were defined and outcome in these phases was quantified in percent of baseline performance before stroke. T2-weighted MR images were acquired 24 h post stroke, the lesion masks were segmented by an experienced researcher. To characterize stroke topology, images and masks were co-registered on the Allen Mouse Brain Atlas (AMBA) using ANTx2 (https://github.com/ChariteExpMri/antx2). Different random forest prediction models that either used motor-functional deficit or total lesion volume or lesion volume in each AMBA region (termed herein MRI [Segmented]) were generated on the training dataset to predict subacute and residual deficits. The prediction error, i.e. the difference between predicted and measured motor-functional deficit, was used to rate and compare the accuracy of models.Results
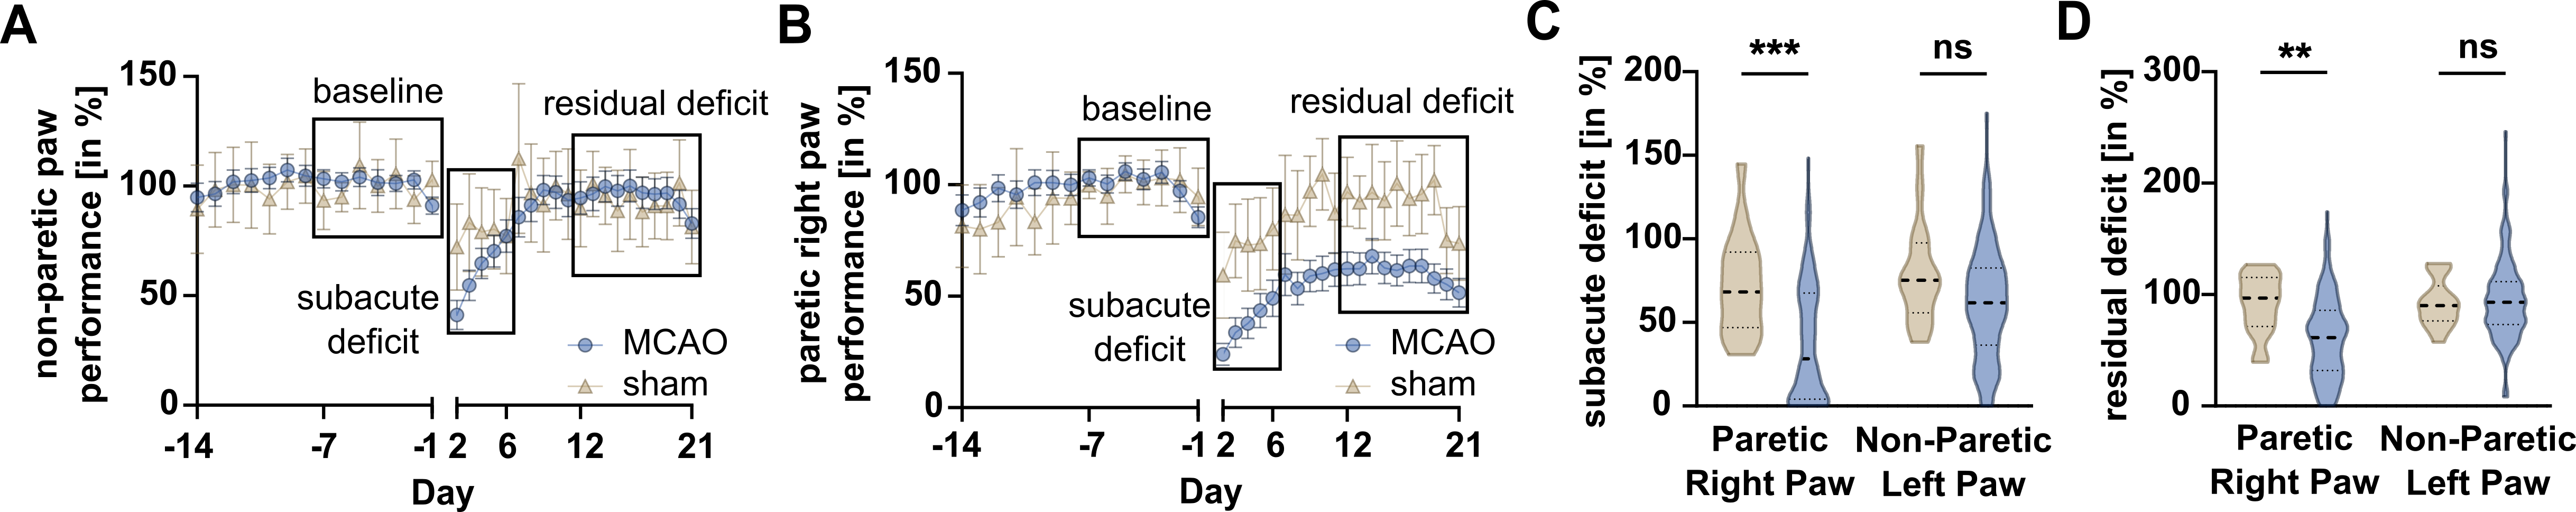
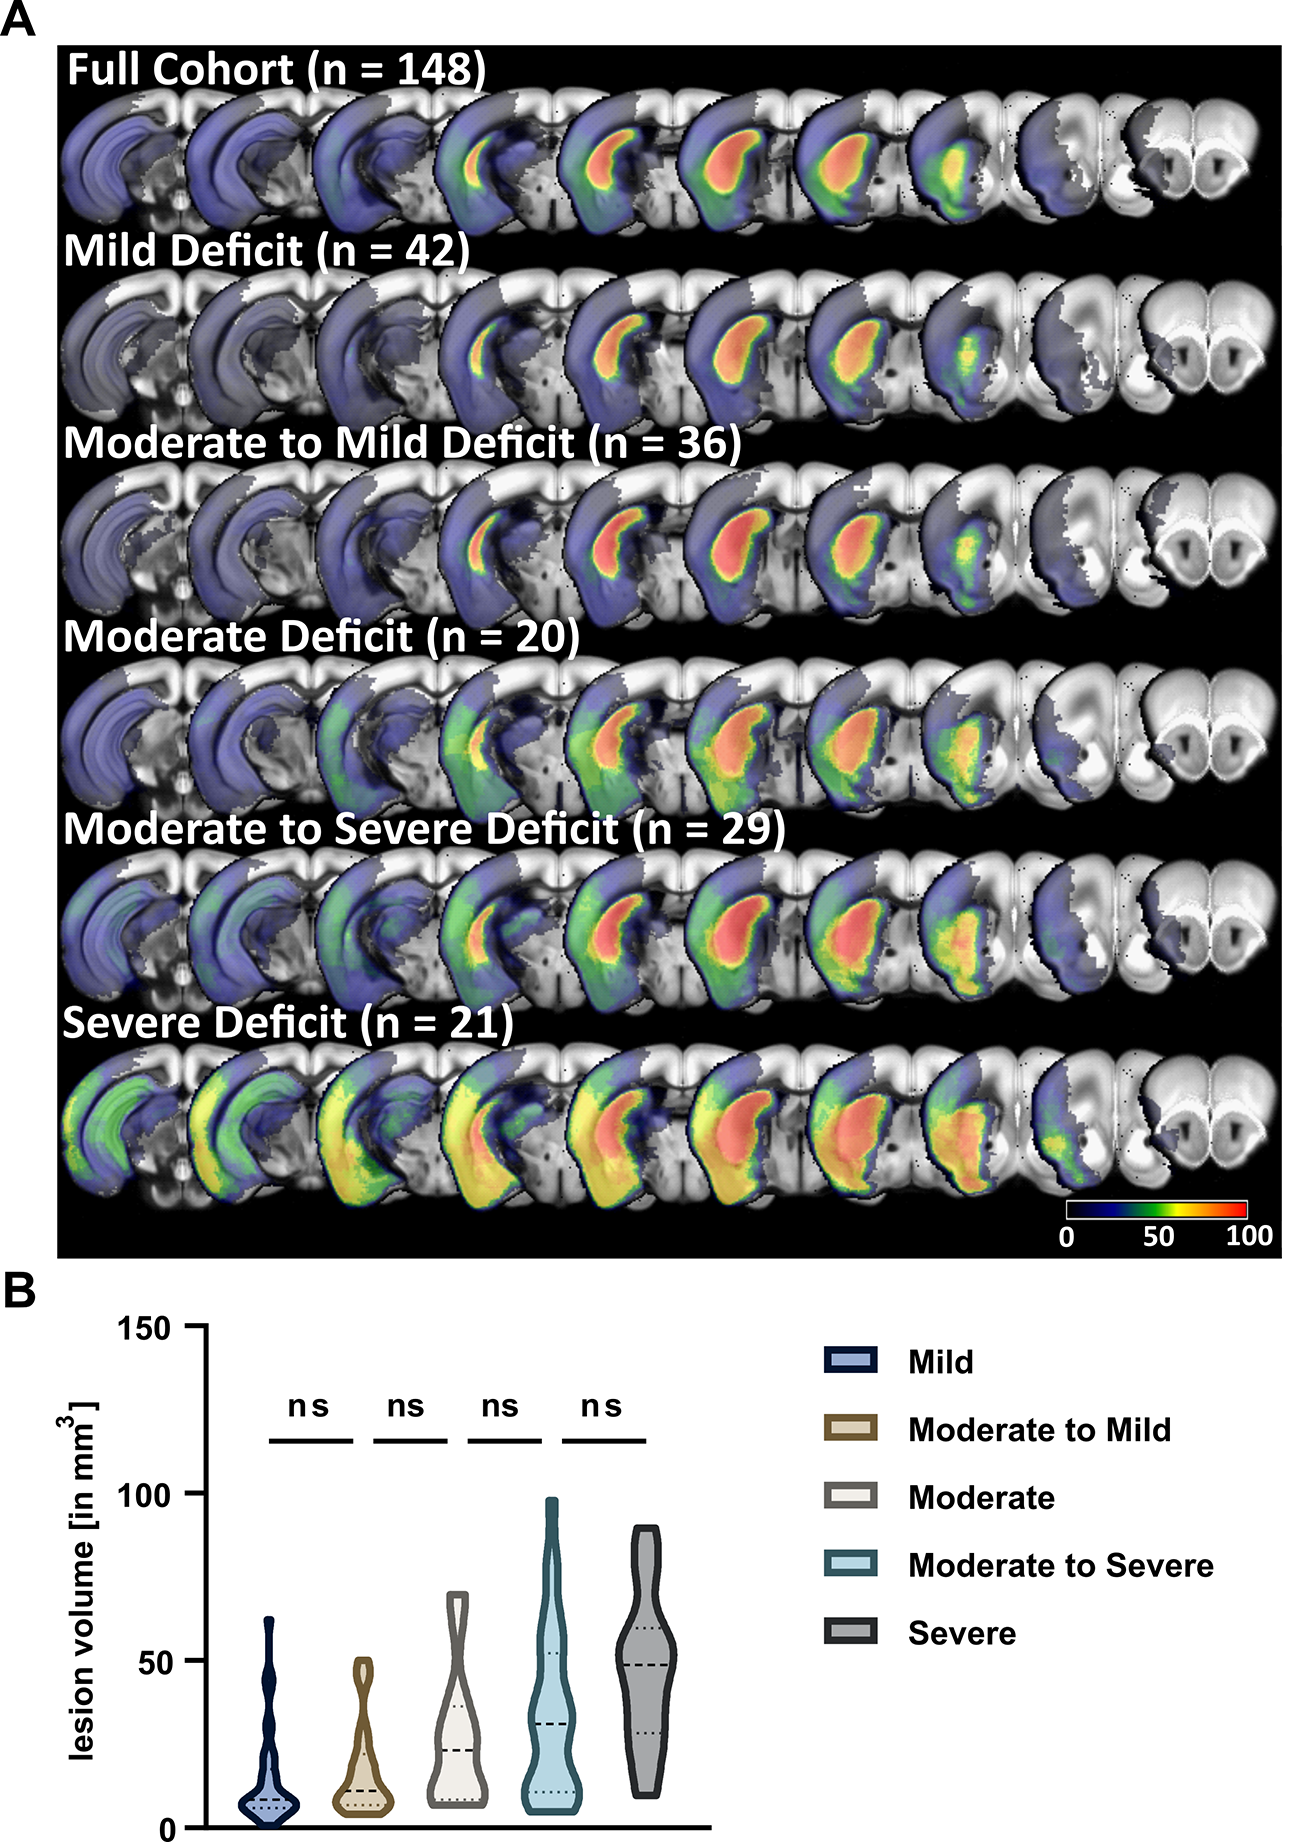
We detected both a subacute and residual motor-functional deficit after stroke in mice with different functional severity grades and recovery trajectories (Fig. 2). Total lesion volume increased with increasing severity grade (Fig. 3) and was a better predictor of the subacute deficit than lesion topology (Fig. 4A). The residual deficit could be predicted most accurately by the degree of the subacute deficit. When investigating predictive value of MRI for the residual deficit, including information about the lesion topology increased accuracy compared to total lesion volume (Fig. 4B). Random forest modeling was used to sort brain regions according to how import damage in these regions was for outcome prediction. This process yielded 14 anatomical regions, adding information from more regions did not significantly increase model accuracy (Fig. 5). These results were reproduced in the replication cohort.Discussion
We identified and characterized machine learning-based predictors of post-stroke outcome in a large cohort of mice and found strong concordance with clinical data. A subset of regions was identified whose damage is particularly important for sensorimotor outcome and could potentially be used to develop a scoring system in mice mirroring e.g. the ASPECT score in humans [7]. Outcome prediction modeling based on large data from this and other resources such as the ongoing SPAN study [8] will improve the design of preclinical studies and guide intervention decisions.Acknowledgements
Funding was provided by the Deutsche Forschungsgemeinschaft (DFG, German ResearchFoundation) to C.J.H. and C.H. (Project number 417284923), to P.B.S. (Project number 428869206), to N.W., M.E., and C.H. (Project number 424778381–TRR 295) and NeuroCure (EXC-2049–390688087) and the German Federal Ministry of Education and Research (BMBF, Center for Stroke Research Berlin 01EO1301) to U.D., P.B.S., and C.H., and to P.B.S. by the BMBF under the ERA-NET NEURON scheme (01EW1811). This work was supported by Charité3R | Replace - Reduce – Refine and partly by the Fondation Leducq to M.E., and C.H.. F.K. and M.Eg. received a scholarship from the Berlin Institute of Health, Berlin. P.E., N.W., and C.J.H. are participants in the Charité Clinical Scientist Program funded by the Charité –Universitätsmedizin Berlin and the Berlin Institute of Health and N.W. is a Freigeist Fellow with support from the Volkswagen Foundation. J.P.D. is supported by DFG (Project number 73500270 and 413848220) and ERA-NET NEURON EBio2 (BMBF 01EW2004).References
[1] Albers GW et al. Magnetic resonance imaging profiles predict clinical response to early reperfusion: The diffusion and perfusion imaging evaluation for understanding stroke evolution (DEFUSE) study. Ann. Neurol. 2006;60:508–517. doi:10.1002/ana.20976
[2] Cheng B et al. Influence of stroke infarct location on functional outcome measured by the modified rankin scale. Stroke. 2014;45:1695–1702. doi:10.1161/STROKEAHA.114.005152
[3] Borich MR et al. Understanding the role of the primary somatosensory cortex: Opportunities for rehabilitation. Neuropsychologia. 2015;79:246–255.
[4] Munsch F et al. Stroke location is an independent predictor of cognitive outcome. Stroke. 2016;47:66–73.
[5] Menezes NM et al. The real estate factor: Quantifying the impact of infarct location on stroke severity. Stroke. 2007;38:194–197.
[6] Scheulin KM et al. Exploring the predictive value of lesion topology on motor function outcomes in a porcine ischemic stroke model. Sci. Rep. 2021;11:1–15.
[7] Barber et al. Validity and reliability of a quantitative computed tomography score in predicting outcome of hyperacute stroke before thrombolytic therapy: ASPECTS Study Group - Alberta Stroke Programme Early CT Score. Lancet 2000;355(9216):1670-1674.
[8] Lyden PD et al. The Stroke Preclinical Assessment Network: Rationale, Design, Feasibility, and Stage 1 Results. Stroke. 2022 May;53(5):1802-1812. Epub 2022.
Figures