0698
Denoising 4D-Flow using Self-Supervised Deep Learning and its effect on test-rest reproducibility1Medical Physics, University of Wisconsin-Madison, Madison, WI, United States, 2Radiology, University of Wisconsin-Madison, Madison, WI, United States
Synopsis
Keywords: Flow, Blood vessels, Machine Learning/Artificial Intelligence
Through a self-supervised deep learning denoising algorithm, more precise cerebrovascular measurements of flow, maximum fluid velocity, and vessel cross-sectional area were obtained from undersampled neurovascular 4D-Flow MRI data. This algorithm was applied to back-to-back scans to illustrate its effectiveness in reducing measurement variance.Introduction
Methods to quantify blood flow and structure of the brain's vessels are needed to improve characterization of neurovascular disease and identify early hemodynamic changes. Quantitative neurovascular imaging biomarkers are especially needed to study neurodegenerative diseases, such as Alzheimer’s where disease is spatially diffuse and has a long preclinical phase requiring longitudinal imaging and biomarker tracking. 4D-Flow MRI can be used to study cerebrovascular hemodynamics1,2 in the context of disease, with previous studies identifying alterations in flow, pulsatility, pulse wave velocity, and low frequency oscillations in Alzheimer's. However, neurovascular 4D-Flow can be challenging to acquire due to demands for both high spatial and temporal resolution and the associated loss in velocity-to-noise ratio when using accelerated methods. Recently, a number of groups have proposed deep learning (DL) as a method to both improve spatial resolution, improve conformity to fluid physics, and reduce noise in the velocity fields3,4,5. These past techniques typically rely on ground truth, either from higher quality scans or derived from computational fluid dynamics (CFD). This leads to challenges in applications where a ground truth is difficult to obtain and/or errors are introduced from synthetic training with CFD. In this study, we investigate 4D-Flow denoising using a self-supervised deep learning approach. To evaluate its effectiveness, we compare the efficacy in reducing variation between back-to-back scans.Methods
The DL denoising was trained using self-supervised/noise-to-noise training approach6 based on 3D radially sampled data. Radial projections were randomly split in k-space by subsampling the projections and reconstructing a highly sampled image (7/8ths of the data) and a low sampled image (1/8th of the data). A block-wise 3D UNet was trained to estimate the highly sampled complex images from the low sampled sampled images. All training was performed on raw complex images with velocity estimation following a standard pipeline of denoised images, including background phase and velocity aliasing corrected7. Training data was from 290 quality controlled neurovascular 4D-Flow scans acquired with a similar protocol as past of aging and dementia studies (0.7mm isotropic resolution, whole brain coverage, TE/TR=2.7/7.8ms, 426s scan time, Venc=80cm/s). The network did not include temporal components and assumes the random temporal sampling of projections averages temporal flow. DL denoising can then be performed on individual time frame images. DL Evaluation: The low sampled images (0.7 minute scan) of 10 additional subjects from the same cohort before and after the denoising algorithm were evaluated with a Quantitative Velocity Tool (QVT)8,9 to measure flow, maximum velocity, and vessel cross sectional area in the the superior sagittal sinus, straight sinus, left and right MCA, and left and right PCA. These measurements were then compared to the results from a 5.6 minute scan to show the self-supervised algorithms’ effectiveness. Test-Retest: To determine the test-retest reproducibility, back-to-back 4D-Flow data was captured for five participants. Data was acquired on 3.0T scanners using an identical protocol to the training data. The test-retest data were analyzed through the QVT tool using the same six vessels used for evaluation, with and without DL. Pixel Wise velocity correlation of the scans was also evaluated by using registered velocity images with thresholding to only include vessels.Results
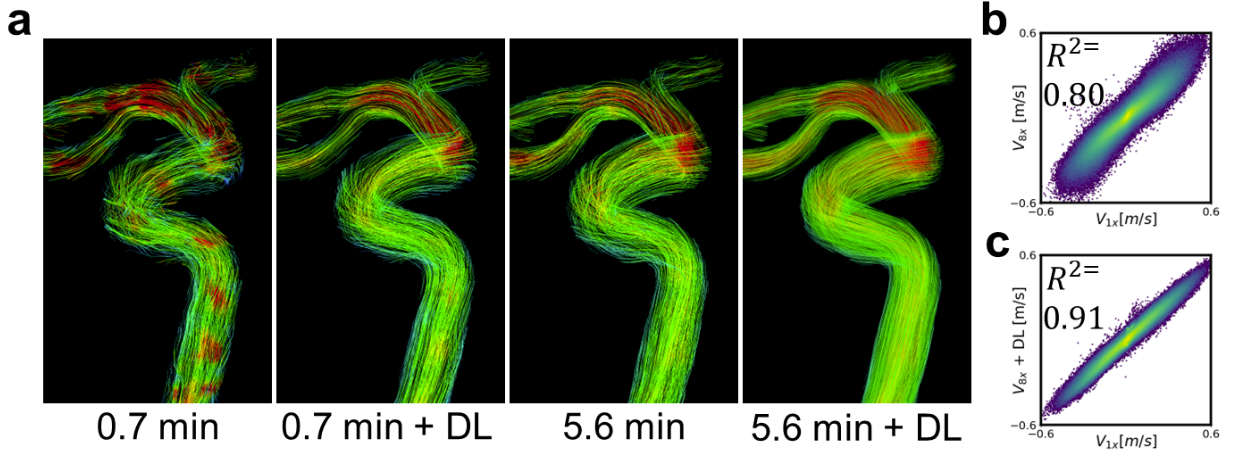
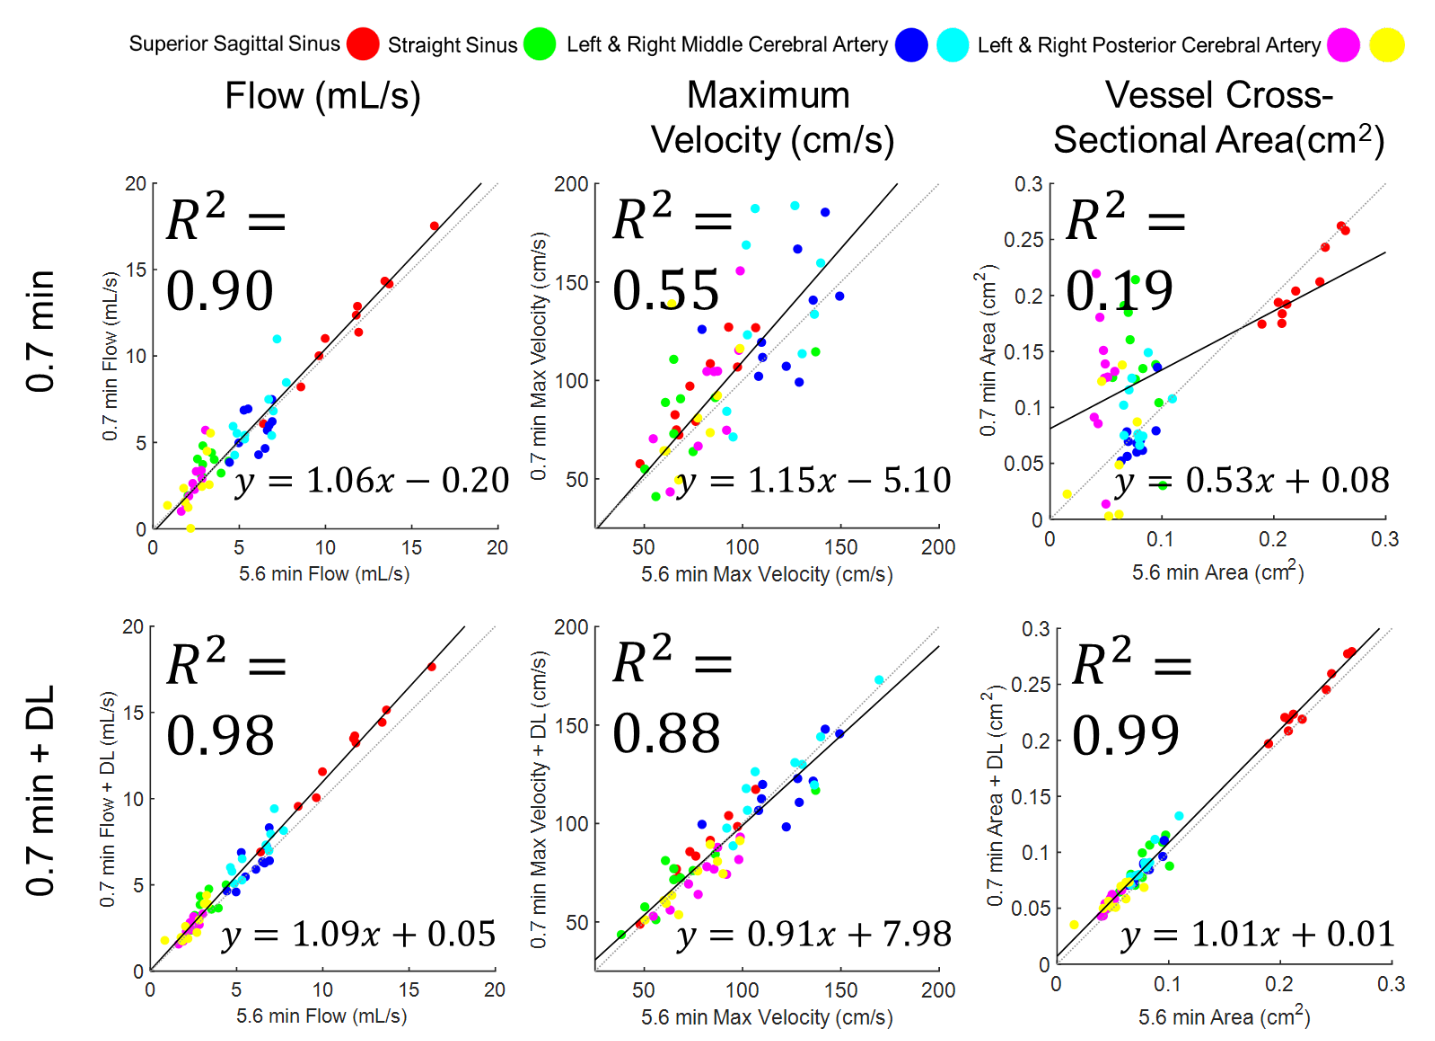
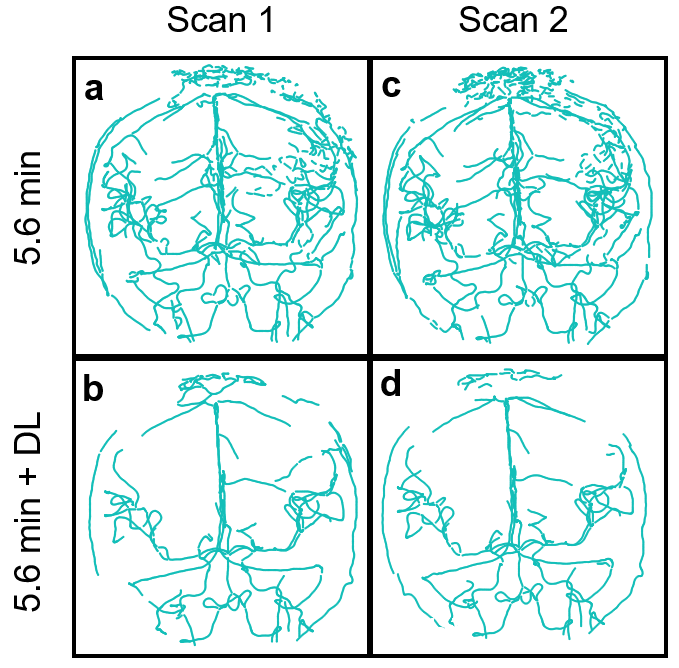
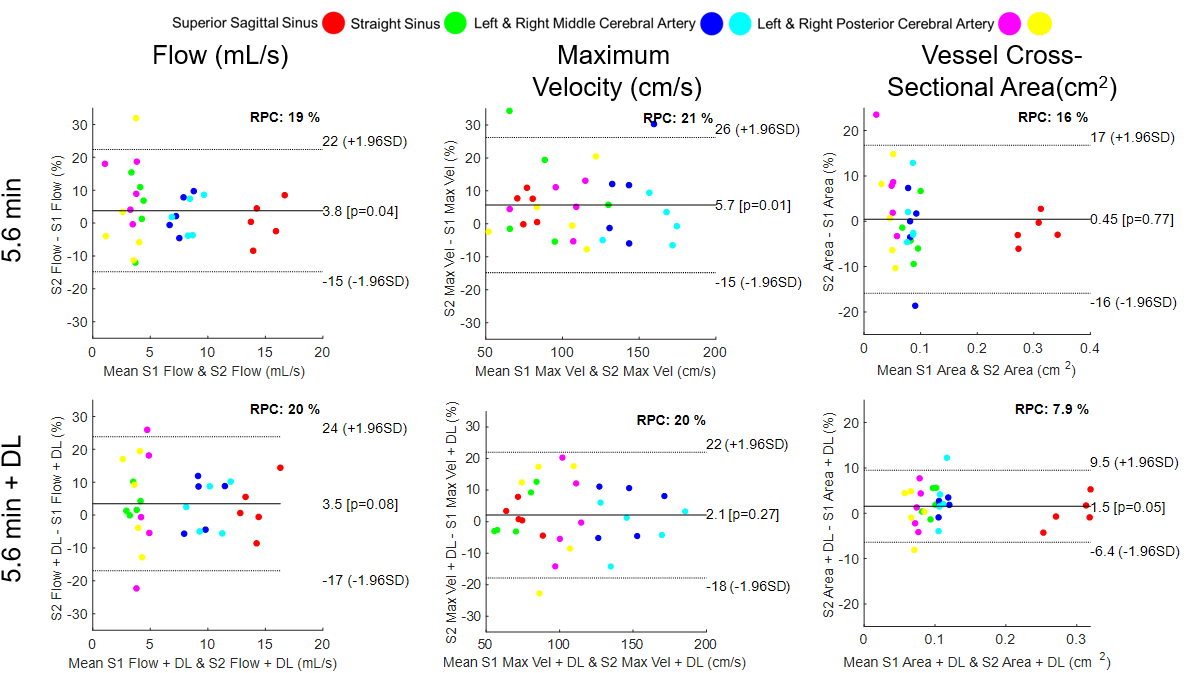
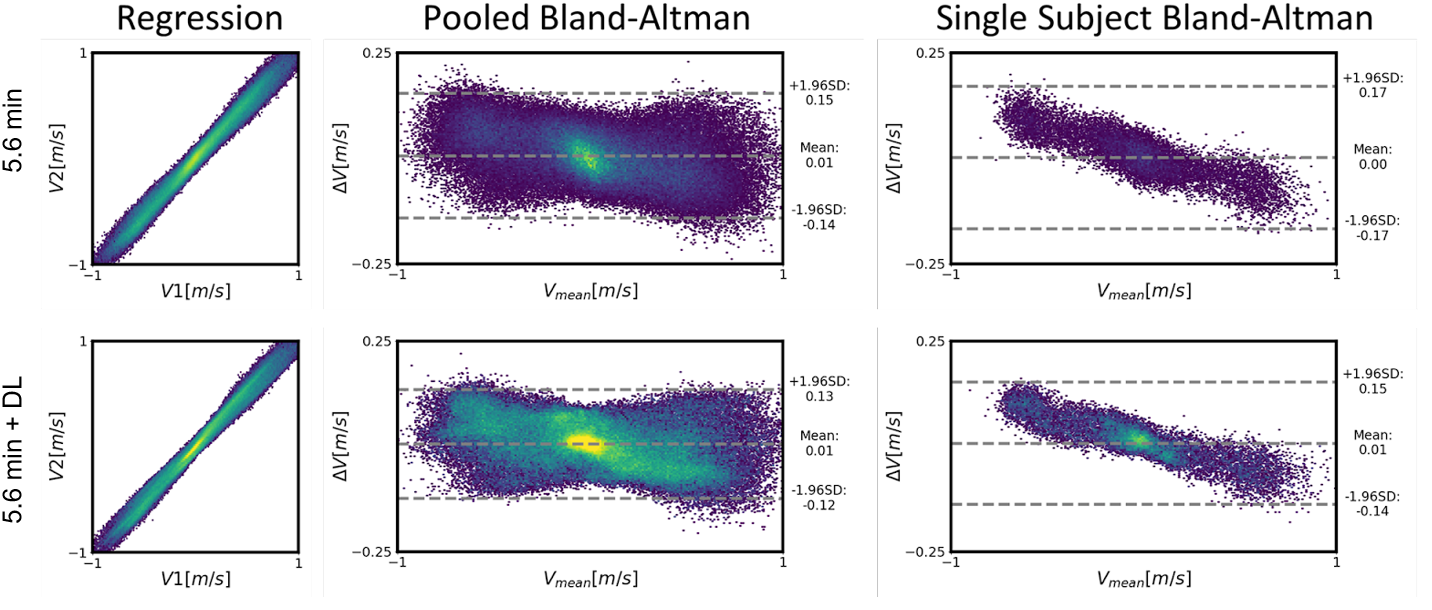
DL Evaluation: Streamline flow plots illustrate the self-supervised DL effectiveness of improving 0.7 minute scan flow to more accurately resemble the flow of the 5.6 minute scan (Fig. 1). Pixelwise velocity regression plots of 0.7 minute scans compared with their 5.6 minute scans show an increase in correlation from R2=0.80 to 0.91 with the application of deep learning. Pooled analysis of all vessels revealed an increase in R2 values for flow (0.90 to 0.98), maximum velocity (0.55 to 0.88), and vessel cross sectional area (0.19 to 0.99) with the application of DL denoising (Fig. 2). DL reduced background noise and improved visualization of large vessels; however, this resulted in loss of some small vessels (Fig. 3). DL Evaluation: Despite substantial apparent reduction in velocity noise, DL did not change the reproducibility in flow and maximum velocity measurements (Fig. 4). The vessel cross section was significantly improved with a decrease in the reproducibility coefficient from 16% to 7.9%( Fig. 4). Further, pixelwise velocity analysis pooling all subjects (Fig. 5) confirmed this with only an 8% reduction in the limits for agreement in Bland-Altman analysis. Examining individual subjects revealed shifts in the velocity correlation, presumably due to baseline changes in flow.Discussion and Conclusions
This study illustrates the training and characterization of DL denoising and its effect on obtaining accurate quantitative cerebrovascular measurements. In testing subjects where data was randomly undersampled temporally, the DL denoising significantly reduced measurement variability and improved concordance to the ground truth. Yet, in test-retest evaluation, only minor improvements in the limits of agreement were observed for flow values despite improvements in cross sectional area. This data suggests the measures of time-averaged flow and max velocity in arterial segments may be dominated by physiologic changes in flow and uncorrected bulk motion. Further work is required to fully evaluate the improvement variation for time resolved parameters (e.g. pulsatility), derived metrics (e.g. pressure losses), and measures in slow flow venous structures.Acknowledgements
We gratefully acknowledge research support from GE Healthcare, and funding support from the Alzheimer's Association (AARFD-20-678095) and from NIH grants R01AG075788, R21AG077337, R01AG021155, P30AG062715, F31AG071183, UL1TR002373, and KL2TR002374.References
1. Rivera-Rivera LA, Turski P, Johnson KM, Hoffman C, Berman SE, Kilgas P, Rowley HA, Carlsson CM, Johnson SC, Wieben O. 4D flow MRI for intracranial hemodynamics assessment in Alzheimer's disease. J Cereb Blood Flow Metab. 2016 Oct;36(10):1718-1730. doi: 10.1177/0271678X15617171. Epub 2015 Nov 25. PMID: 26661239; PMCID: PMC5076787.
2. Rivera-Rivera LA, Cody KA, Rutkowski D, Cary P, Eisenmenger L, Rowley HA, Carlsson CM, Johnson SC, Johnson KM. Intracranial vascular flow oscillations in Alzheimer's disease from 4D flow MRI. Neuroimage Clin. 2020;28:102379. doi: 10.1016/j.nicl.2020.102379. Epub 2020 Aug 12. PMID: 32871386; PMCID: PMC7476069.
3. Shit S, Zimmermann J, Ezhov I, Paetzold JC, Sanches AF, Pirkl C, Menze BH. SRflow: Deep learning based super-resolution of 4D-flow MRI data. Front Artif Intell. 2022 Aug 12;5:928181. doi: 10.3389/frai.2022.928181. PMID: 36034591; PMCID: PMC9411720.
4. Rutkowski, D.R., Roldán-Alzate, A. & Johnson, K.M. Enhancement of cerebrovascular 4D flow MRI velocity fields using machine learning and computational fluid dynamics simulation data. Sci Rep 11, 10240 (2021). https://doi.org/10.1038/s41598-021-89636-z.
5. Ferdian, Edward & Suinesiaputra, Avan & Dubowitz, David & Zhao, Debbie & Wang, Alan & Cowan, Brett & Young, Alistair. (2020). 4DFlowNet: Super-Resolution 4D Flow MRI using Deep Learning and Computational Fluid Dynamics.
6. Lehtinenn et al. arxiv:1803.04189.
7. Loecher M, Schrauben E, Johnson KM, et al. Phase unwrapping in 4D MR flow with a 4D single-step laplacian algorithm. J Magn Reson Imaging 2016; 43: 833–842.
8. Hoffman C, Roberts GS, Berman SE, et al. Towards Automated Cranial 4D Flow Cranial Analysis. Society for Magnetic Resonance Angiography (2019) p.80.
9. Roberts GS, Peret A, Jonaitis EM, et al. Defining Normative Cerebral Hemodynamics in Cognitively Healthy Older Adults with 4D flow MRI. Proc. Intl. Soc. Mag. Reson. Med. 30 (2022) #0007.
Figures