0693
Establishing a Correlation between Diffusion Heterogeneity and Tissue Structural Heterogeneity Using Stereotactic Biopsies on Brain Tumors1University of Illinois College of Medicine at Chicago, Chicago, IL, United States
Synopsis
Keywords: Diffusion/other diffusion imaging techniques, Brain, Tissue heterogeneity
Non-Gaussian diffusion MRI with a continuous-time random-walk (CTRW) model offers a unique avenue to probing tissue microstructural heterogeneity. The CTRW parameters, α and β, corresponding to temporal and spatial intravoxel diffusion heterogeneities, have empirically been linked to tumor tissue heterogeneity in clinical studies. This study aims at directly establishing the correlation between the CTRW parameters from patients suspected of glioma and tissue microstructural heterogeneity revealed by histology on stereotactic brain biopsies. We developed a practical protocol that integrates quantitative imaging techniques and surgical procedures to perform MR-histology correlation, and demonstrated that lower CTRW parameters correspond to increased tissue microstructural heterogeneity.Introduction
Tissue microstructural heterogeneity can reveal valuable information on cellular heterogeneity, genetic heterogeneity, epigenetic heterogeneity, etc.1, hence, has been increasingly used for the diagnosis and treatment evaluation of tumors2-4. The main challenge in assessing tissue microstructural heterogeneity using conventional MRI is the difference in spatial scales between an MRI voxel (e.g., ~1 mm3) and the microscopic tissue structural dimensions (e.g., micrometers) for histopathologic heterogeneity assessment. Probing tissue microstructural heterogeneity has been the main motivation of a number of recent diffusion-weighted MRI (DWI) studies5-11. Among these, the continuous-time random-walk (CTRW) model7,8 characterizes temporal and spatial intravoxel diffusion heterogeneities with two new parameters, α and β, respectively. In this study, we demonstrate a practical protocol for establishing correlation between the imaging-based diffusion heterogeneity and histology-based tissue microstructural heterogeneity on patients suspected of glioma who underwent image-guided stereotactic biopsy. Specifically, we (1) derived the CTRW model parameters from pre-surgical multi-high-b-value DWI data, (2) developed a machine-learning classifier to determine the level of microscopic tissue heterogeneity based on histology from the biopsies, and (3) performed a comparison of imaging- and histology-based metrics on surgical biopsies with different diagnosis.Methods
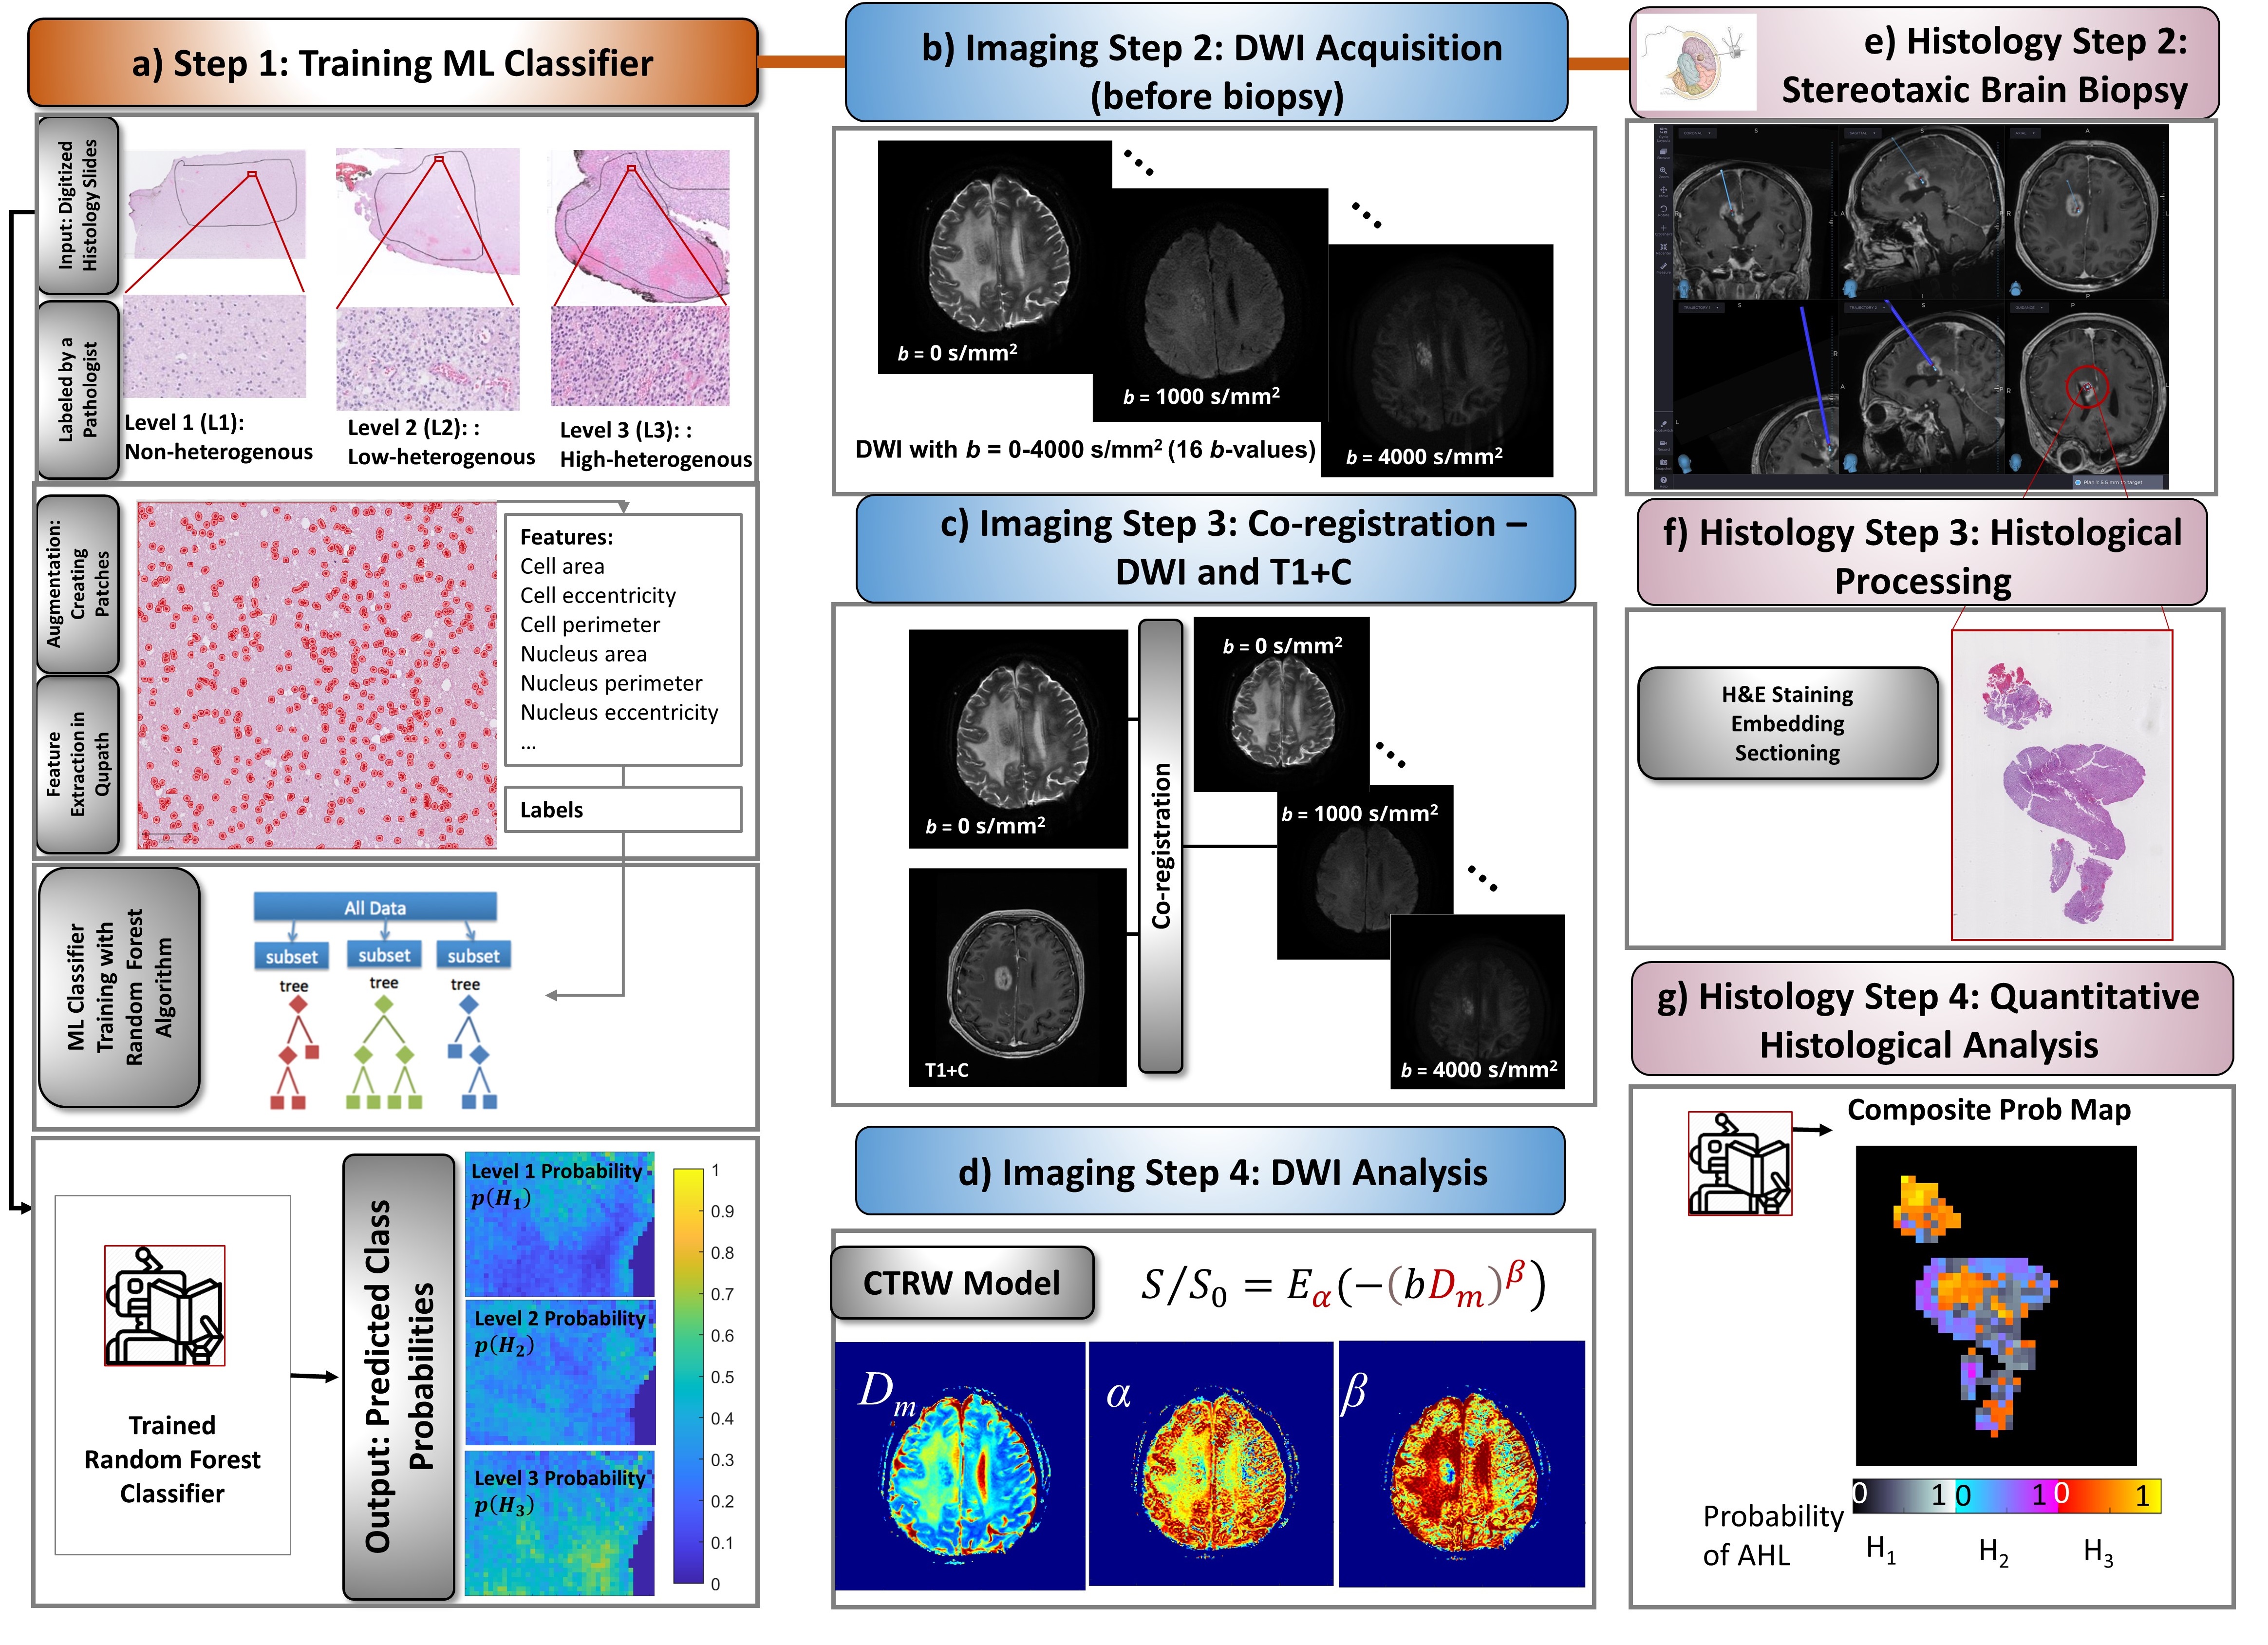
Machine-Learning Classifier Training (Fig.1a): To determine histology-based microscopic tissue heterogeneity, 30 digitized histology slides from 7 normal and 9 glioma brain samples were labeled with three levels of microscopic heterogeneities: H1-H3. For each level, 50 prototype image patches were used for data augmentation, followed by identifying 33 statistical features related to heterogeneity in Qupath. The split ratio was 80:20 for training over test sets. A random forest algorithm was trained to determine the probability of a given pixel having a heterogeneity level of H1, H2, or H3 ($$$p(H_i), i=1,2,3$$$; and $$$\sum_{i=1}^{3}p(H_i)=1$$$) in Python's Scikit-Learn. Model performance was validated with 10-fold cross-validation; and evaluated using accuracy, sensitivity, specificity, precision, F1-Score, and Kappa-score.Imaging Steps (Figs.1b-1d): Five adult patients with suspected glioma were recruited under an approved IRB protocol. Pre-surgical brain DWI was performed at 3T with 12 b-values (0-4000 s/mm2) (Fig.1b). The diffusion-weighted images were co-registered to post-contrast T1-weighted images (T1+C) which were used for neurosurgical guidance during stereotactic brain biopsy. A linear affine transformation was used to perform co-registration in AFNI12 (Fig.1c). Trace-weighted diffusion images were analyzed using the CTRW model8, $$S/S_0=E_\alpha \left ( -\left ( bD_m \right ) ^{\beta }\right )$$ where Eα is a Mittag-Leffler function, Dm is an anomalous diffusion coefficient, and α and β are temporal and spatial diffusion heterogeneity parameters, respectively. The CTRW parameters were obtained by nonlinear least-squares fitting (Fig.1d).
Biopsy & Histology Steps (Figs.1e-1g): 3-9 surgical biopsies were obtained from locations identified on the T1+C images using a Medtronic StealthStation neuro-navigation system (Fig.1e). During the procedure, the biopsy locations were recorded using the tools on StealthStation with a precision of less than 1 mm. The biopsy specimens were H&E stained, embedded, and sectioned (Fig.1f). After feature extraction, p(Hi)s were predicted for each pixel (0.25×0.25 mm2) by the trained machine-learning classifier (Fig.1a). For each pixel, an “assigned” heterogeneity level (AHL) was determined as the level with the highest probability. A single “composite” probability map (CPM) was created by displaying the probability value of each pixel’s AHL with a specific color palette (Fig.1g). Finally, the biopsy coordinates were mapped to the diffusion-weighted images by using the co-registered T1+C images as an intermediary, enabling correlation between the CTRW parameter maps and histology-based CPMs.
Results
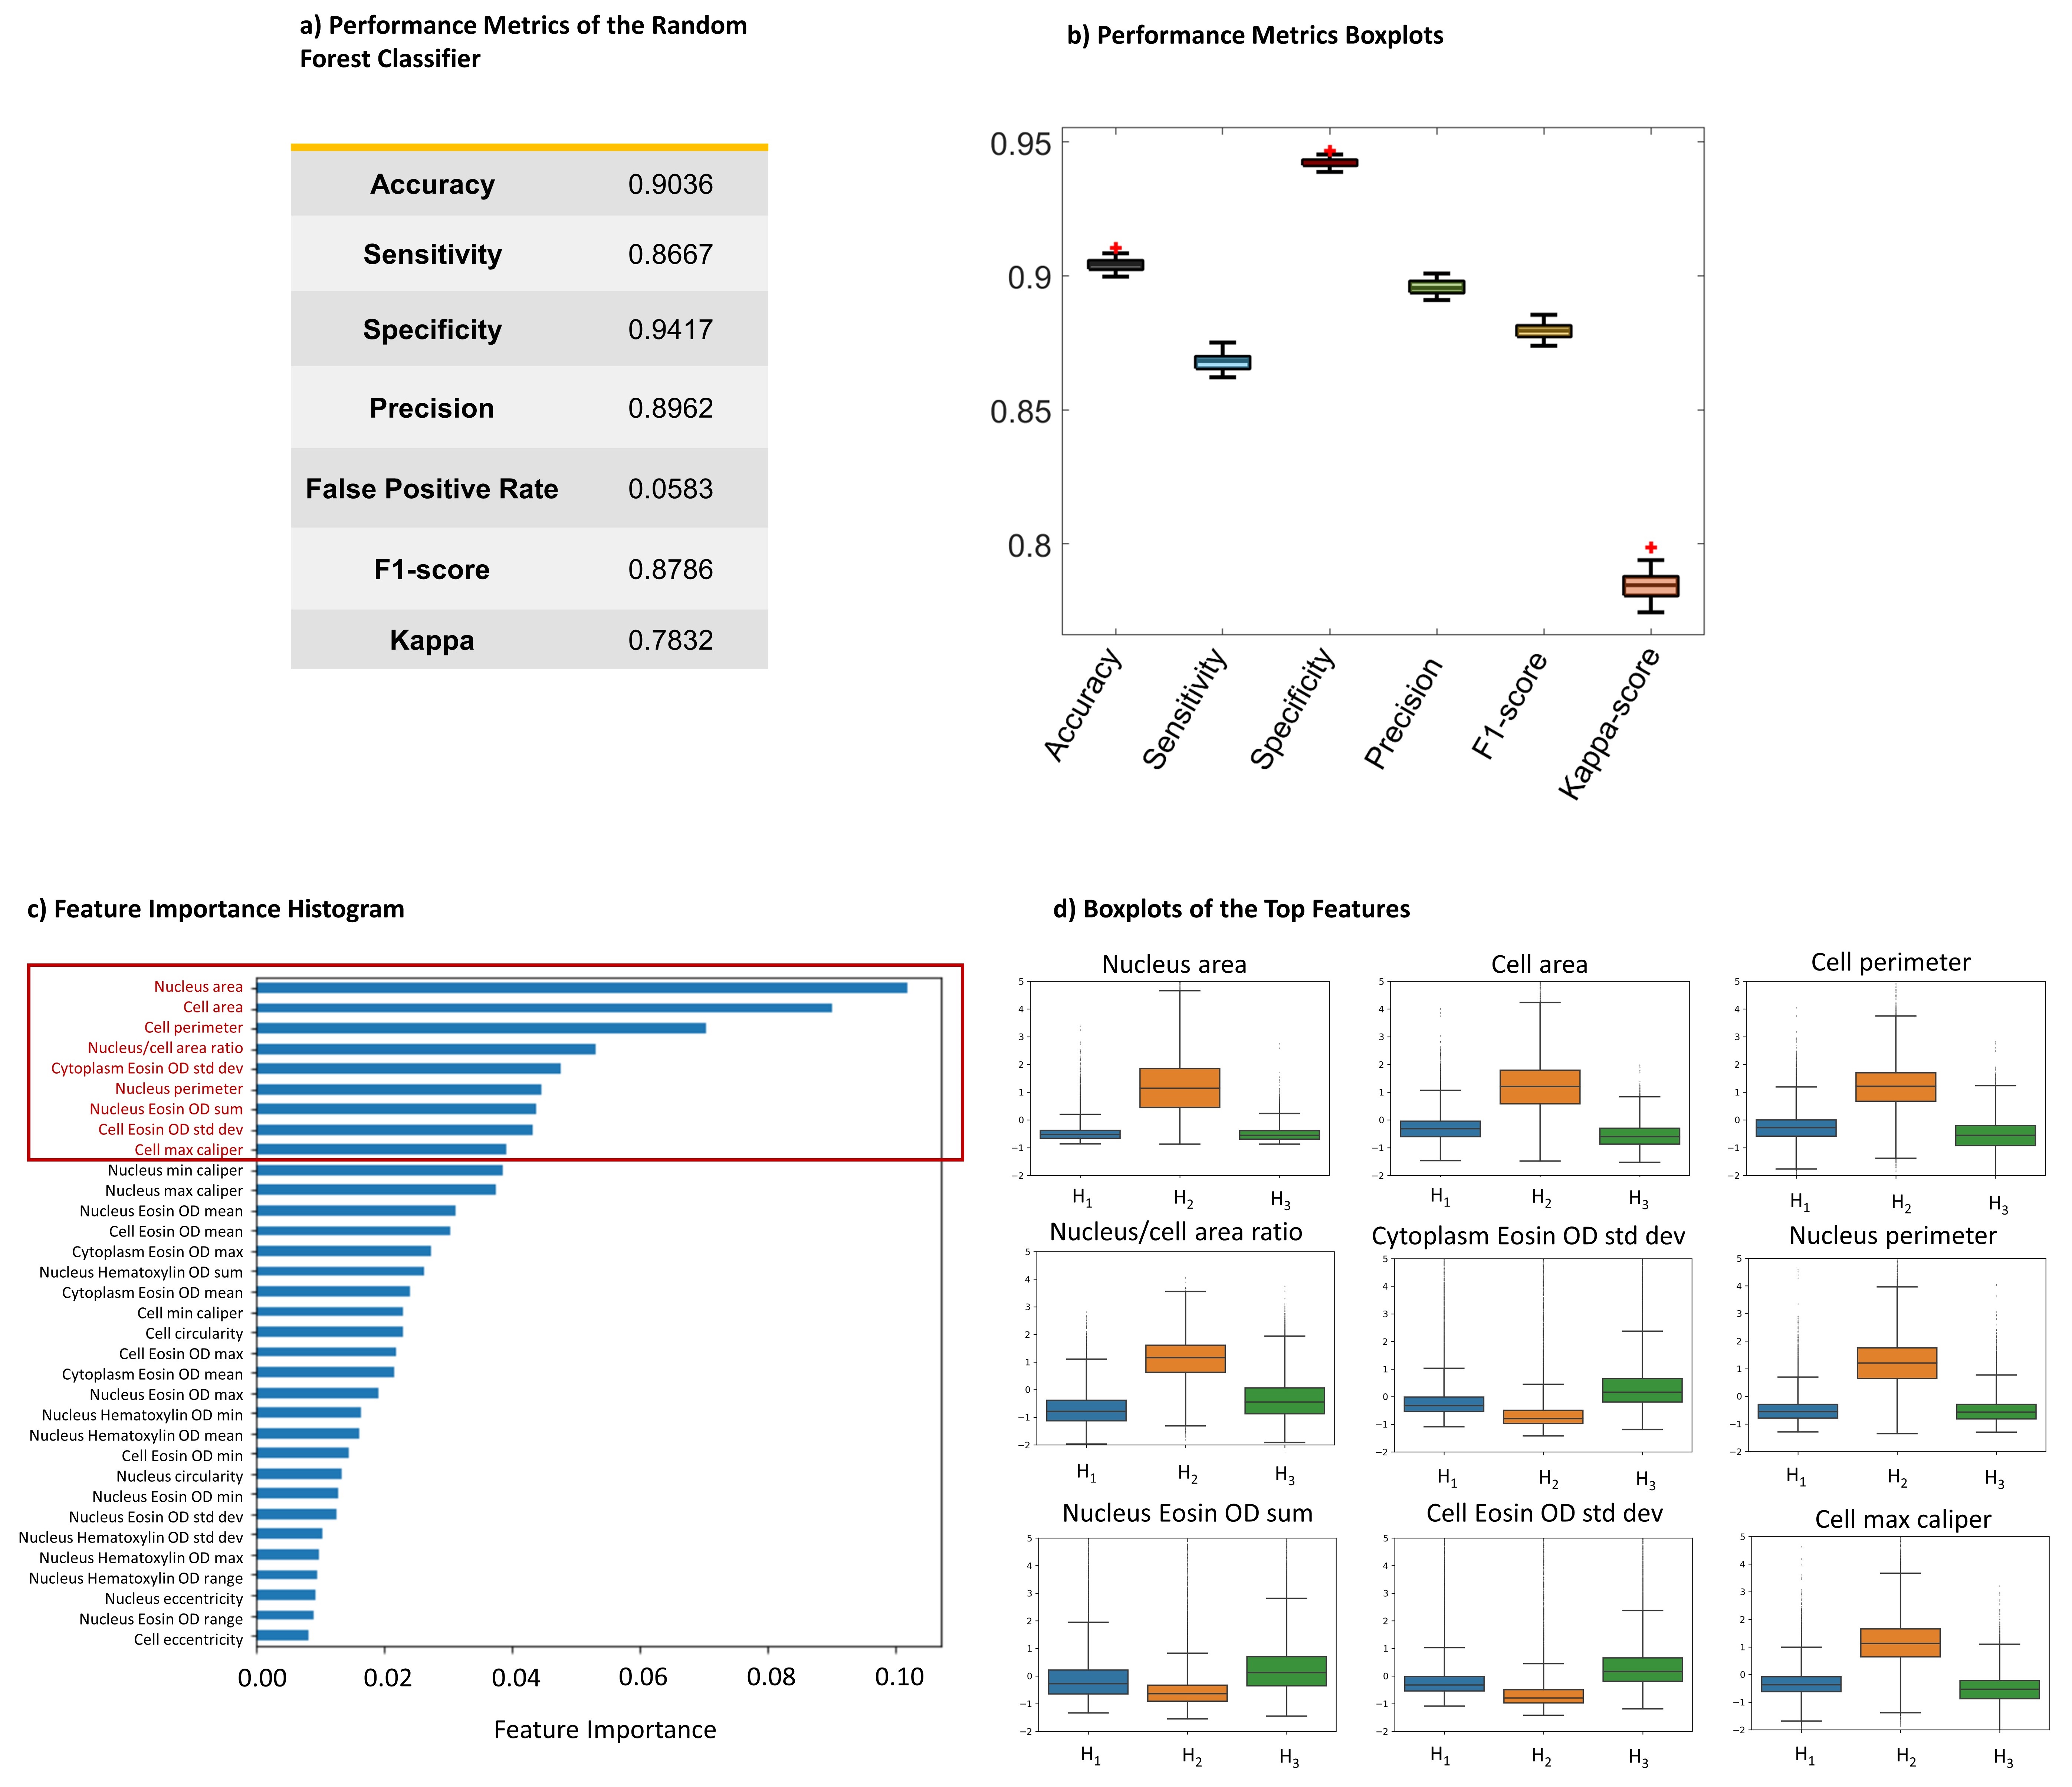
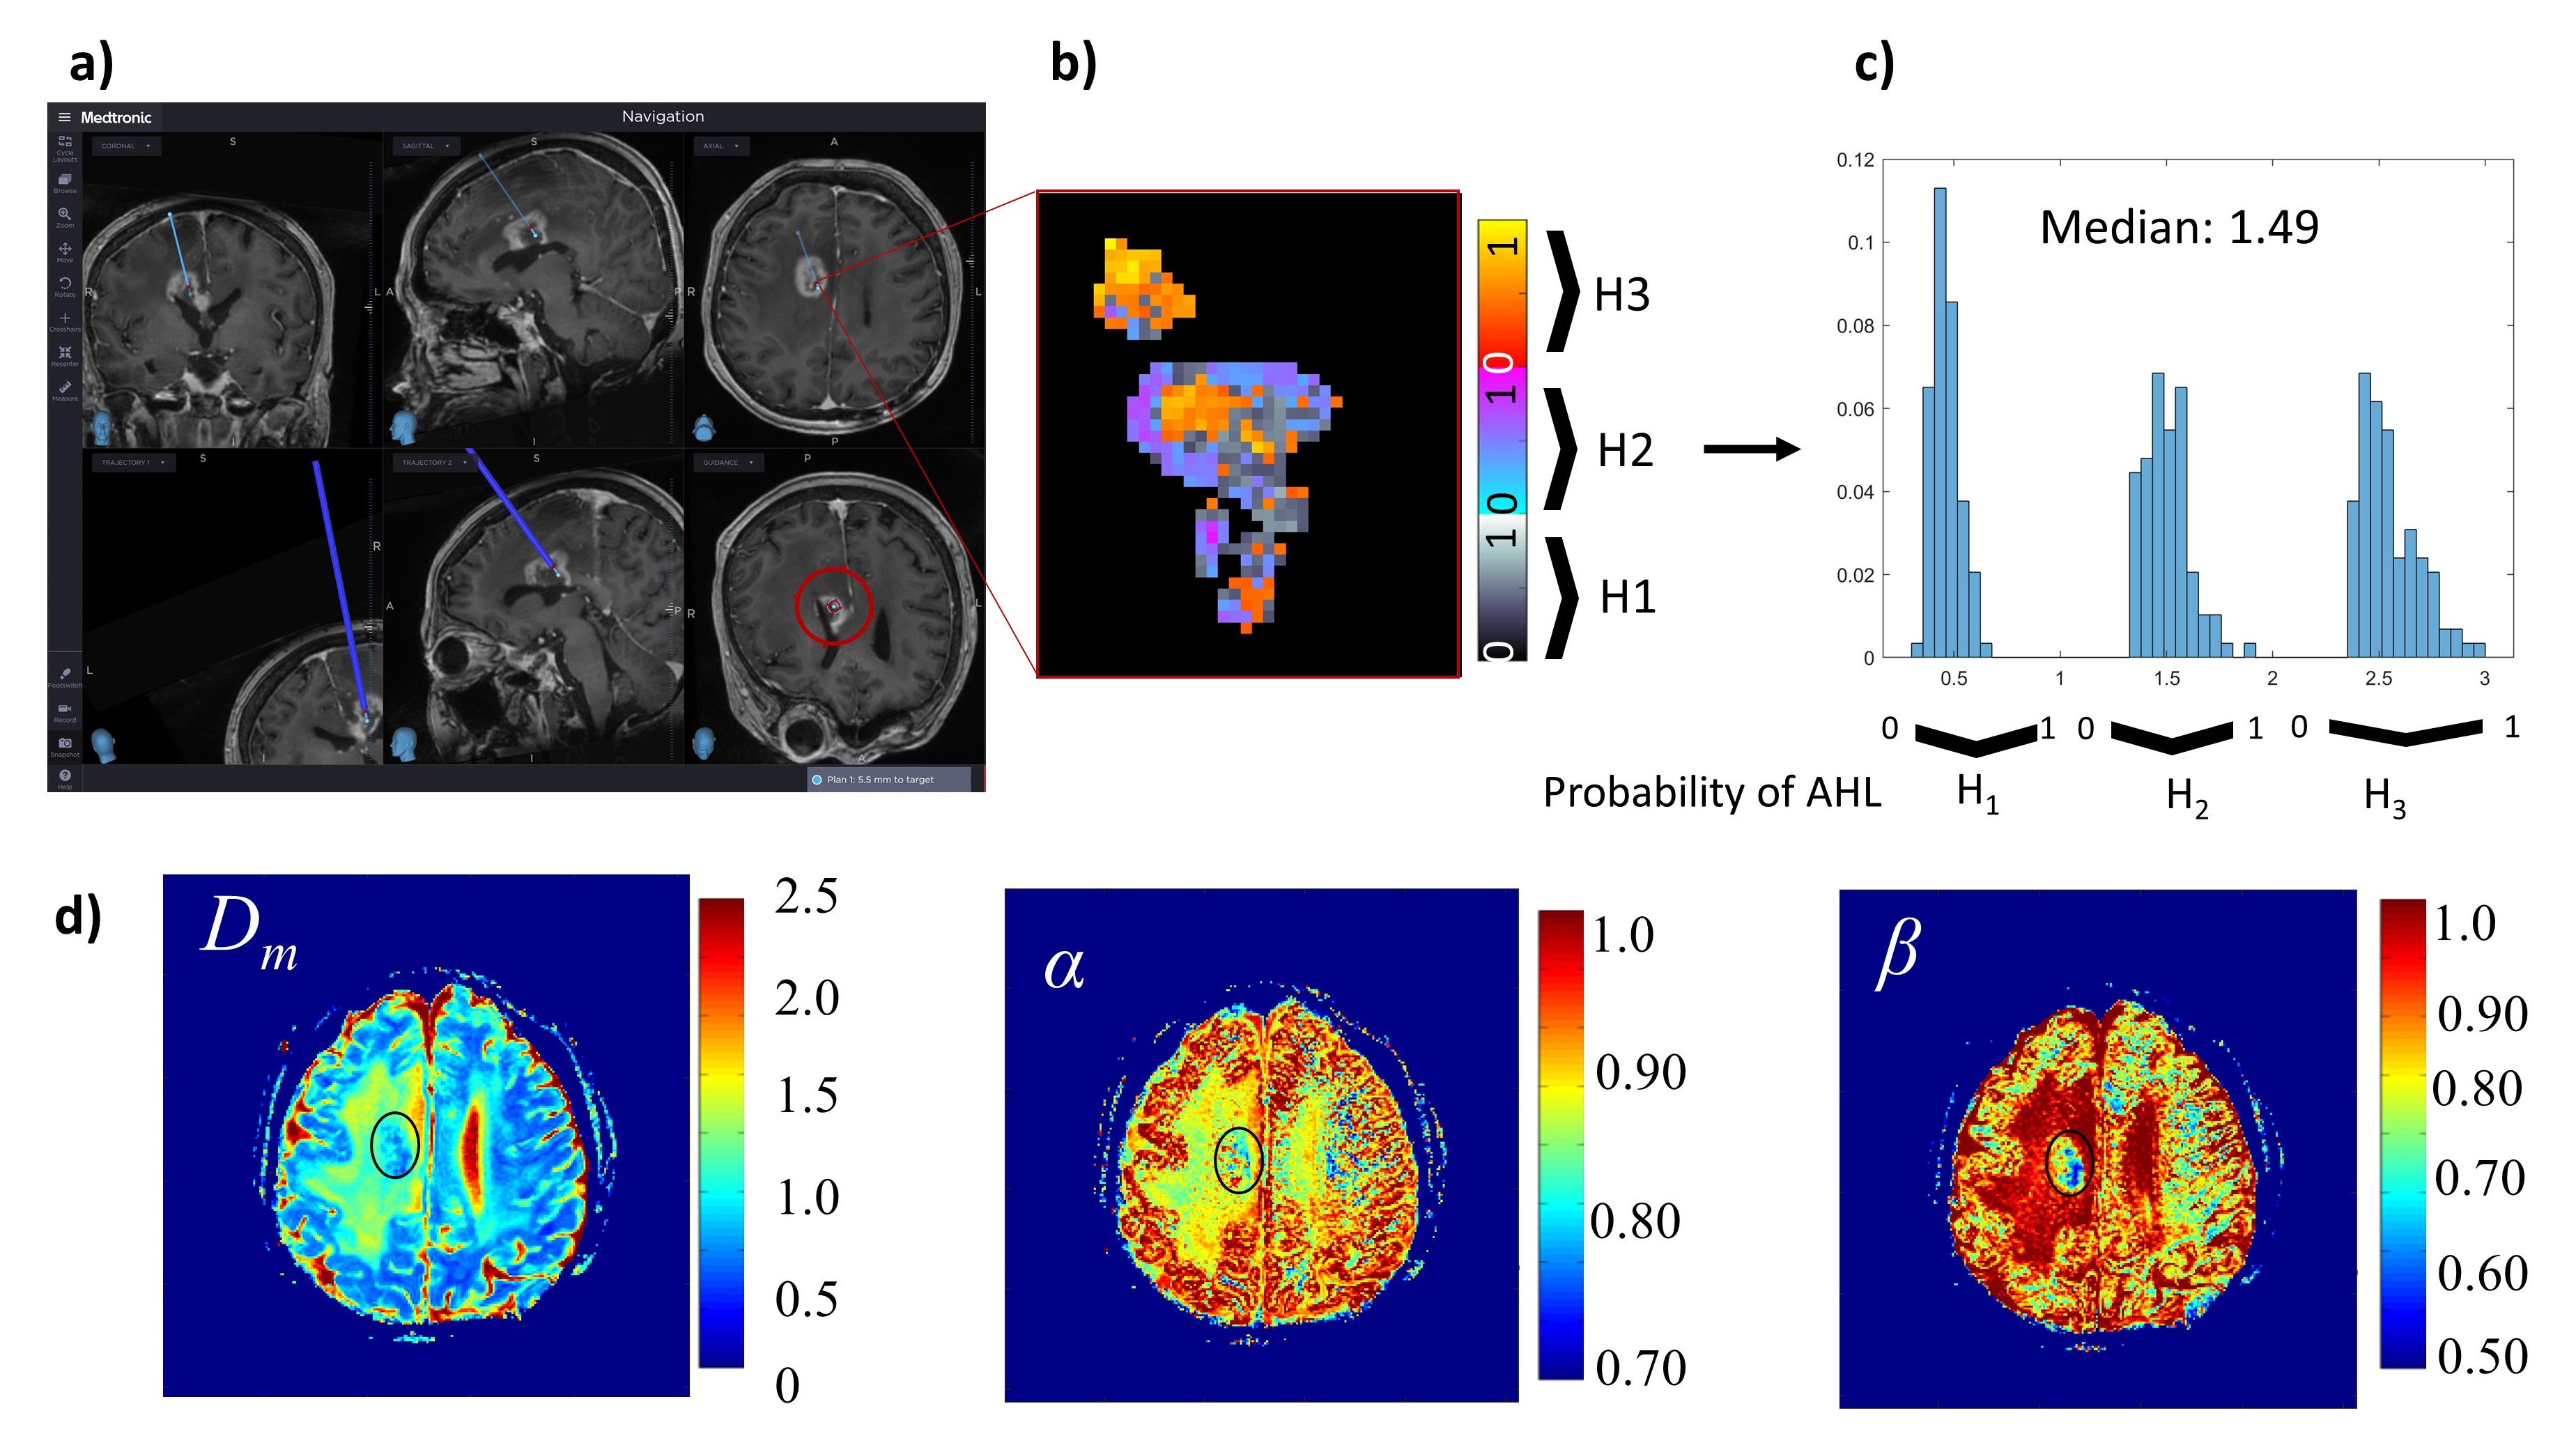
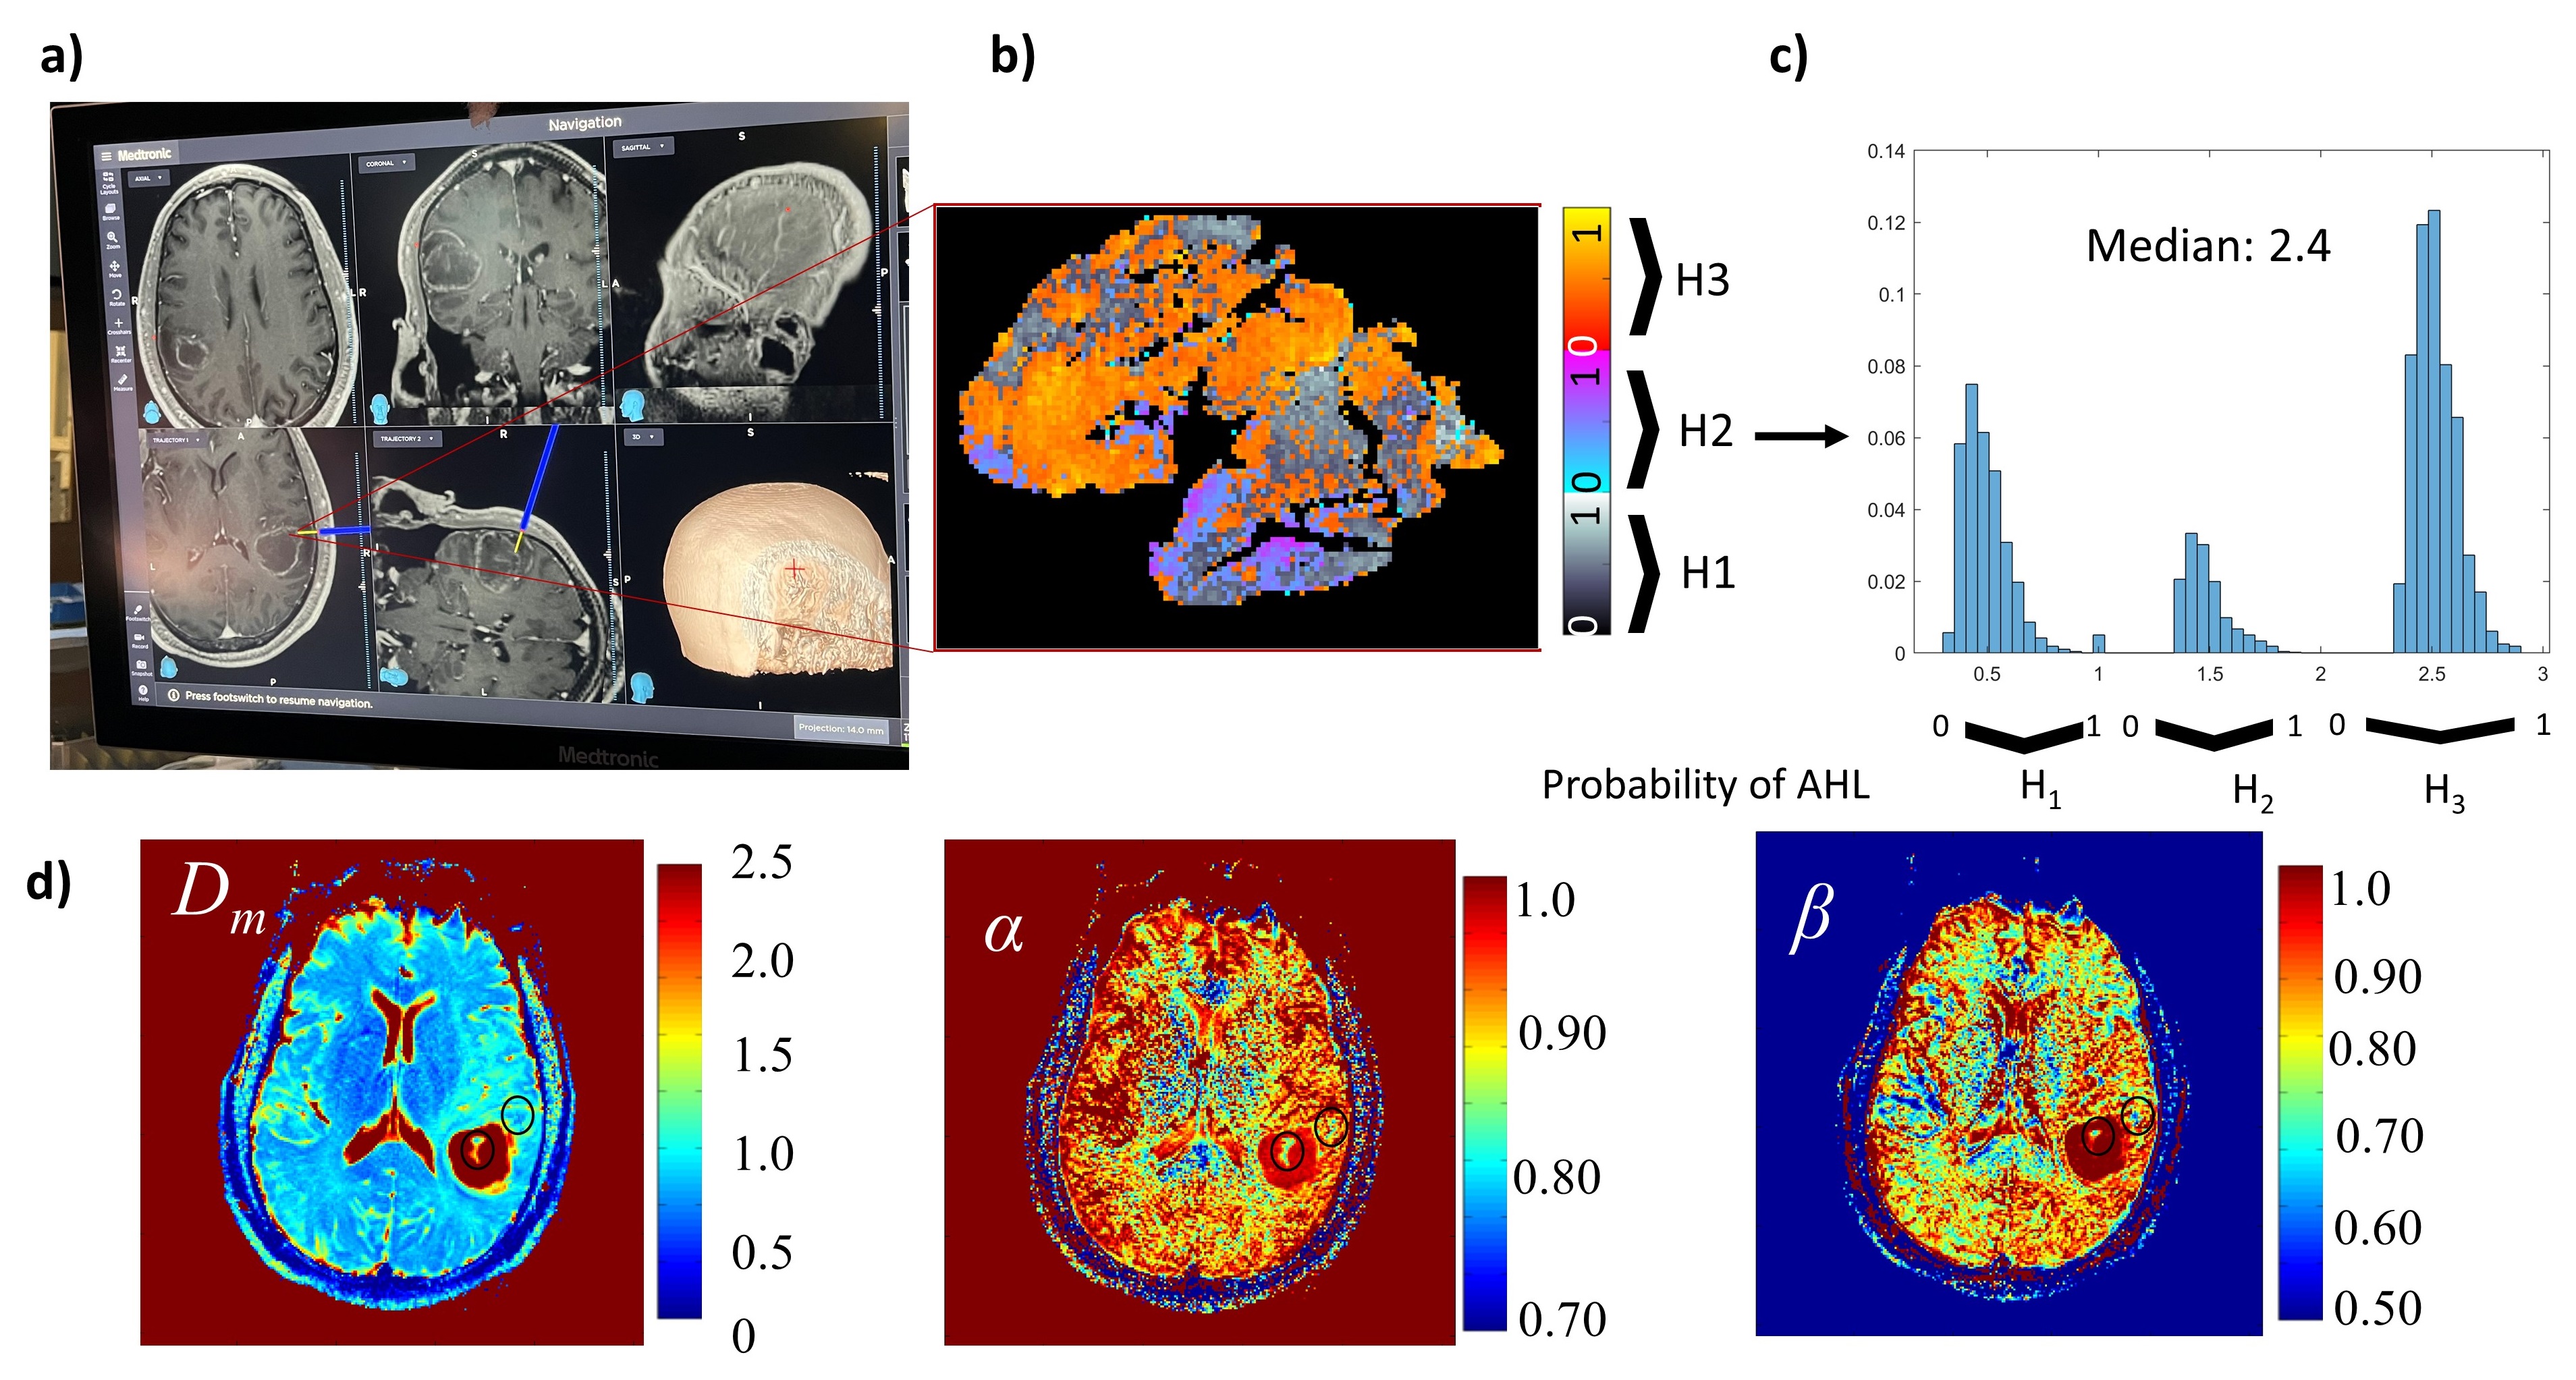
The machine-learning classifier that determines histology-based heterogeneity achieved an accuracy of 90% and specificity of 94% (Figs.2a, 2b) with its feature importance diagram and the boxplots of the top features shown in Figs. 2c and 2d. Figures 3 and 4 display results from a patient diagnosed with radiation necrosis (RN) and another patient with glioblastoma (GB; Fig.4). In the RN case, Dm and α yielded values mostly similar to the brain parenchyma in the vicinity of the biopsy site, while β produced smaller values in some areas (Fig.3d). The corresponding CPM (Fig. 3b) produced more pixels with H1 (Fig.3c), with an overall median value of 1.49 (0: lowest, 3: highest). In the GB case, all CTRW parameters were found to have low values in the biopsy ROI (Fig. 4a) and the solid tumor region surrounded by edema (Fig.4d). Unlike the RN case, the corresponding CPM (Fig.4b) contained more pixels with H3 (Fig.4c), with an overall median value of 2.4.Discussion and Conclusion
We have demonstrated that the tissue microstructural heterogeneity probed by the CTRW parameters is well-correlated to the degree of microscopic heterogeneity revealed by histology. There are two major contributions of this study. First, we have established an interdisciplinary yet practical approach that integrates quantitative imaging techniques (i.e. machine-learning, advanced modeling) and surgical procedures to perform MR-histology correlation on patients. This gives us a valuable tool to directly validate previous clinical studies7-11 utilizing diffusion MRI to probe intravoxel tissue heterogeneity. Second, the results of this direct correlation study support our explanation for a number of observational studies showing that lower CTRW parameters correspond to increased tissue heterogeneity7-11. With further validation on a large number of biopsies, the ability of probing microscopic tissue heterogeneity using advanced DWI is expected to become more evident and increasingly contribute to cancer diagnosis and treatment evaluation.Acknowledgements
This work was supported in part by the National Institutes of Health (5R01EB026716-01 and 1S10RR028898-01). The content is solely the responsibility of the authors and does not necessarily represent the official views of the National Institutes of Health.References
[1] Dentro SC, Leshchiner I, Haase K, et al. Characterizing genetic intra-tumor heterogeneity across 2,658 human cancer genomes. Cell. 2021;184(8):2239-2254.
[2] Meacham CE, Morrison SJ. Tumour heterogeneity and cancer cell plasticity. Nature. 2013;501(7467):328–337.
[3] Bedard PL, Hansen AR, Ratain MJ, et al. Tumour heterogeneity in the clinic. Nature. 2013;501(7467):355–364.
[4] Fletcher CDM. The evolving classificiation of soft tissue tumors – an update based on the new 2013 WHO classification. Histopathology. 2014;64(1):2-11.
[5] Kwee TC, Galban CJ, Tsien C, et al. Intravoxel water diffusion heterogeneity imaging of human high-grade gliomas. NMR Biomed. 2010;23(2):179–187.
[6] Szczepankiewicz F, van Westen D, Englund E, et al. The link between diffusion MRI and tumor heterogeneity: Mapping cell eccentricity and density by diffusional variance decomposition (DIVIDE). Neuroimage. 2016;142:522-532.
[7] Ingo C, Magin RL, Colon-Perez L, Triplett W, Mareci TH. On random walks and entropy in diffusion‐weighted magnetic resonance imaging studies of neural tissue. Magn Reson Med. 2014;71:617–627.
[8] Karaman MM, Sui Y, Wang H, et al. Differentiating low- and high-grade pediatric brain tumors using a continuous-time random-walk diffusion model at high b-values. Magn Reson Med. 2015;76:1149-1157.
[9] Sui Y, He W, Damen FW, et al. Differentiation of low- and high- grade pediatric brain tumors with high b-value diffusion weighted MR imaging and a fractional order calculus model. Radiology. 2015;277(2):489–496.
[10] Sui Y, Xiong Y, Xie KL, et al. Differentiation of low- and high-grade gliomas using high b-value diffusion imaging with a non-Gaussian diffusion model. Am J Neuroradiol. 2016;37:1643-1649.
[11] Tang L, Sui Y, Zhong Z, et al. Non-Gaussian diffusion imaging with a fractional order calculus model to predict response of gastrointestinal stromal tumor to second-line sunitinib therapy. Magn Reson Med. 2018;79(3):1399-1406.
[12] Cox. AFNI: Software for analysis and visualization of functional magnetic resonance neuroimages. Computers and Biomedical Research. 1996;29:162-173.
Figures