0692
Towards whole-brain, quantitative characterisation of microscopy-derived microstructure in the BigMac dataset
Amy FD Howard1, Istvan N Huszar1, Silei Zhu1, Daniel ZL Kor1, Lea Roumazeilles2, Saad Jbabdi1, and Karla L Miller1
1Wellcome Centre for Integrative Neuroimaging (FMRIB Centre), Nuffield Department of Clinical Neurosciences, University of Oxford, Oxford, United Kingdom, 2Wellcome Centre for Integrative Neuroimaging, Experimental Psychology, Medical Sciences Division, University of Oxford, Oxford, United Kingdom
1Wellcome Centre for Integrative Neuroimaging (FMRIB Centre), Nuffield Department of Clinical Neurosciences, University of Oxford, Oxford, United Kingdom, 2Wellcome Centre for Integrative Neuroimaging, Experimental Psychology, Medical Sciences Division, University of Oxford, Oxford, United Kingdom
Synopsis
Keywords: Validation, Diffusion/other diffusion imaging techniques, Microstructure characterisation, microscopy
The BigMac dataset is an open access resource combining in vivo MRI, postmortem MRI and multi-contrast microscopy data in a single, whole macaque brain. Here we perform data-driven segmentation of the BigMac histology slides to extract quantitative microscopy metrics for myelin, cell density, and cellular morphology (e.g. soma size and packing). Utilising high-quality MRI-microscopy registrations, we work towards building 3D volumes of quantitative microscopy derived metrics obtained at high resolution. This “ground truth” atlas of how cellular distributions vary across the brain is then directly related to co-registered diffusion MRI acquired in the same tissue.Introduction
Understanding how MRI signals relate to tissue microstructure can be greatly advanced by investigating the covariance of MRI signals with microstructural features across the brain. However, our ability to characterise whole-brain variations in cellular distributions is often limited by microscopy constraints. Micron-scale whole-brain microscopy can be achieved in small animals (e.g. using micro-CT1,2). However, these methods are restricted to small tissue samples, precluding whole-brain characterisation of cellular distributions in larger human or primate brains. Consequently, the microscopy of larger brains is typically restricted to serial imaging of thin tissue sections. This has so far been achieved on very few human or primate brains3,4, most of which do not have corresponding MRI.The BigMac dataset5 provides an opportunity for relating whole-brain microscopy-derived microstructural metrics to MRI acquired in the same tissue. The BigMac dataset is an open access resource combining invivo and postmortem MRI with densely-sampled, whole-brain multi-contrast microscopy (polarised light imaging6, myelin- and Nissl-stained histology) for multimodal characterisation of a single whole macaque brain. So far, MRI-microscopy comparisons have mostly focused on fibre orientations/distributions. Here we segment myelinated fibres and cell bodies from the histology-stained slides and extract quantitative metrics for myelin, cell density and cellular morphology (e.g. soma size and circularity). The slides are registered to a common 3D space defined by the MRI to build a 3D volume of quantitative microscopy derived metrics obtained at high resolution. This will allow us to define a “ground truth” atlas of how microstructural parameters vary across different scales – across brain regions, tissue types, white matter tracts, or cortical columns. These microscopy volumes can then be directly compared to MRI metrics within the same brain. Similar data does not yet exist in other macaque or human brains with in vivo and postmortem MRI acquired in the same tissue. Consequently, these data can open new avenues for multi-scale, multi-modal neuroscientific research.
Methods
After sacrifice, the BigMac brain was first scanned with MRI (structural, diffusion MRI, and relaxometry). It was then sectioned along the anterior-posterior axis with consecutive slides assigned to one of six microscopy contrasts. Specific to the data presented here, two sets of sections were stained for myelin (Gallyas silver) and Nissl bodies (Cresyl violet) and digitised with 0.28μm/pixel. Slides stained with the same contrast are repeated every 350μm across the whole brain. From these slides, we quantified two categories of metrics, stained area fraction and cell-based measures, and related them to dMRI-derived measures.Stained area fraction: Stain segmentation was performed using data-driven thresholds based on a weighted-Otsu method7. Whole-slide thresholds for myelin-stained sections were derived from 100 randomly-sampled patches. Local thresholds for Nissl-stained slides were derived using a sliding window to account for variations in background staining. The stained area fraction was then calculated over a 40x40μm neighbourhood.
Cell-based measures: Individual cells were identified from the Nissl-stained slides using a watershed transform of the stain density8. We subsequently derived morphological metrics including cell area, circularity, eccentricity, equivalent radius (calculated from cell area) and distance to nearest neighbour for each cell. An estimate of cell volume was calculated from the number and radii of cells.
MRI-microscopy analyses: Co-registration was achieved using an updated TIRL9 method and the structural MRI. White matter and pial surfaces were derived using an adapted Freesurfer pipeline10,11. Cortical profiles were sampled across matched vertices between the white/pial surfaces. We report dMRI-microscopy correlations using data across all reconstructed microscopy slides. Outliers from either MRI or microscopy were removed (defined as datapoints more than 3 std from the mean) prior to correlation.
Results
Figures 1 and 2 show segmentation outputs for myelin and Nissl-stained slides, respectively. We observe a pattern of lower myelin density in sulci compared to the gyral crowns (Figure 1). This is quantified by comparing myelin SAF with Freesurfer curvature values. Cell segmentation in Figure 2 follows visible cell boundaries.In Figure 3 (left), microscopy metrics from multiple slides across the brain have been warped to the MRI. Metrics vary smoothly across slides, suggesting robustness to variations in staining density. Each slide comprises of multiple microscopy metrics (Figure 3 right) where the maps look clean and follow expected cellular variations.
Figure 4 demonstrates multi-scale analyses afforded by these data. At the macro-scale (top), we observe an increase in cell bodies in anterior white matter, and decreased myelin in more superior white matter. At the meso-scale (middle), we quantify distributions of cell size across three regions, with large Betz cells evident in the motor cortex and small glia in the white matter. At the micro-scale, microscopy-derived cortical profiles act as a faithful description of the underlying microstructure.
Figure 5 describes MRI sensitivity to the microstructural metrics. The rich MRI facilitates extraction of DTI, DKI and metrics from spherical tensor encoding12,13. Though many of the microscopy metrics are somewhat correlated, they show subtly different sensitivities to MRI.
Future work
Once complete, the microscopy-derived metrics will be used to establish how microstructural parameters both vary and co-vary across tissue. When combined with microstructure-informed simulations, we aim to identify signatures in the MR signal that are able to detect subtle variations any single, or specific combination of, microstructural parameters.Acknowledgements
AFDH, INH, SJ and KLM were supported by the Wellcome Trust [WT202788/Z/16/A, WT221933/Z/20/Z and WT215573/Z/19/Z]. SZ was supported by the Chinese Government Scholarship and the Nuffield Department of Clinical Neurosciences studentship. DZLK is supported by the Hrothgar Singaporean Clarendon Scholarship and the Nuffield Department of Clinical Neurosciences studentship. LR was supported by funding from the Biotechnology and Biological Sciences Research Council (BBSRC) [BB/M011224/1]. The Wellcome Centre for Integrative Neuroimaging is supported by core funding from the Wellcome Trust [203139/Z/16/Z]. SJ and KM contributed equally to this work.References
1. Foxley S, et al. Multi-modal imaging of a single mouse brain over five orders of magnitude of resolution. Neuroimage. (2021)2. Trinkle S, et al. Synchrotron X-ray micro-CT as a validation dataset for diffusion MRI in whole mouse brain. Magn Reson Med. (2021)
3. Amunts K, et al. BigBrain: an ultrahigh-resolution 3D human brain model. Science. (2013)
4. Alkemade A, et al. A unified 3D map of microscopic architecture and MRI of the human brain. Sci Adv. (2022)
5. Howard AFD, et al. “The BigMac dataset: an open resource combining multi-contrast MRI and microscopy in the macaque brain”, bioRxiv. (2022)
6. Axer H, et al. Quantitative estimation of 3-D fiber course in gross histological sections of the human brain using polarized light. J Neurosci Methods. (2001)
7. Yuan X, Wu L and Peng Q, An improved Otsu method using the weighted object variance for defect detection, Applied Surface Science. (2015)
8. Meyer, Fernand, "Topographic distance and watershed lines,” Signal Processing. (1994)
9. Huszar IN, et al. Tensor Image Registration Library: Automated Deformable Registration of Stand-Alone Histology Images to Whole-Brain Post-Mortem MRI Data. bioRxiv. (2022)
10. Benn, RA, et al. Precon_all: a preclinical cortical surface generation pipeline for animal brains, in preparation https://github.com/neurabenn/precon_all.
11. Fischl B. Freesurfer, Neuroimage. (2012)
12. Lasic S, et al. Microanisotropy imaging: quantification of microscopic diffusion anisotropy and orientational order parameter by diffusion MRI with magic-angle spinning of the q-vector, Front. Phys. (2014)
13. Lampinen B, et al. Neurite density imaging versus imaging of microscopic anisotropy in diffusion MRI: A model comparison using spherical tensor encoding. Neuroimage. (2017)
Figures
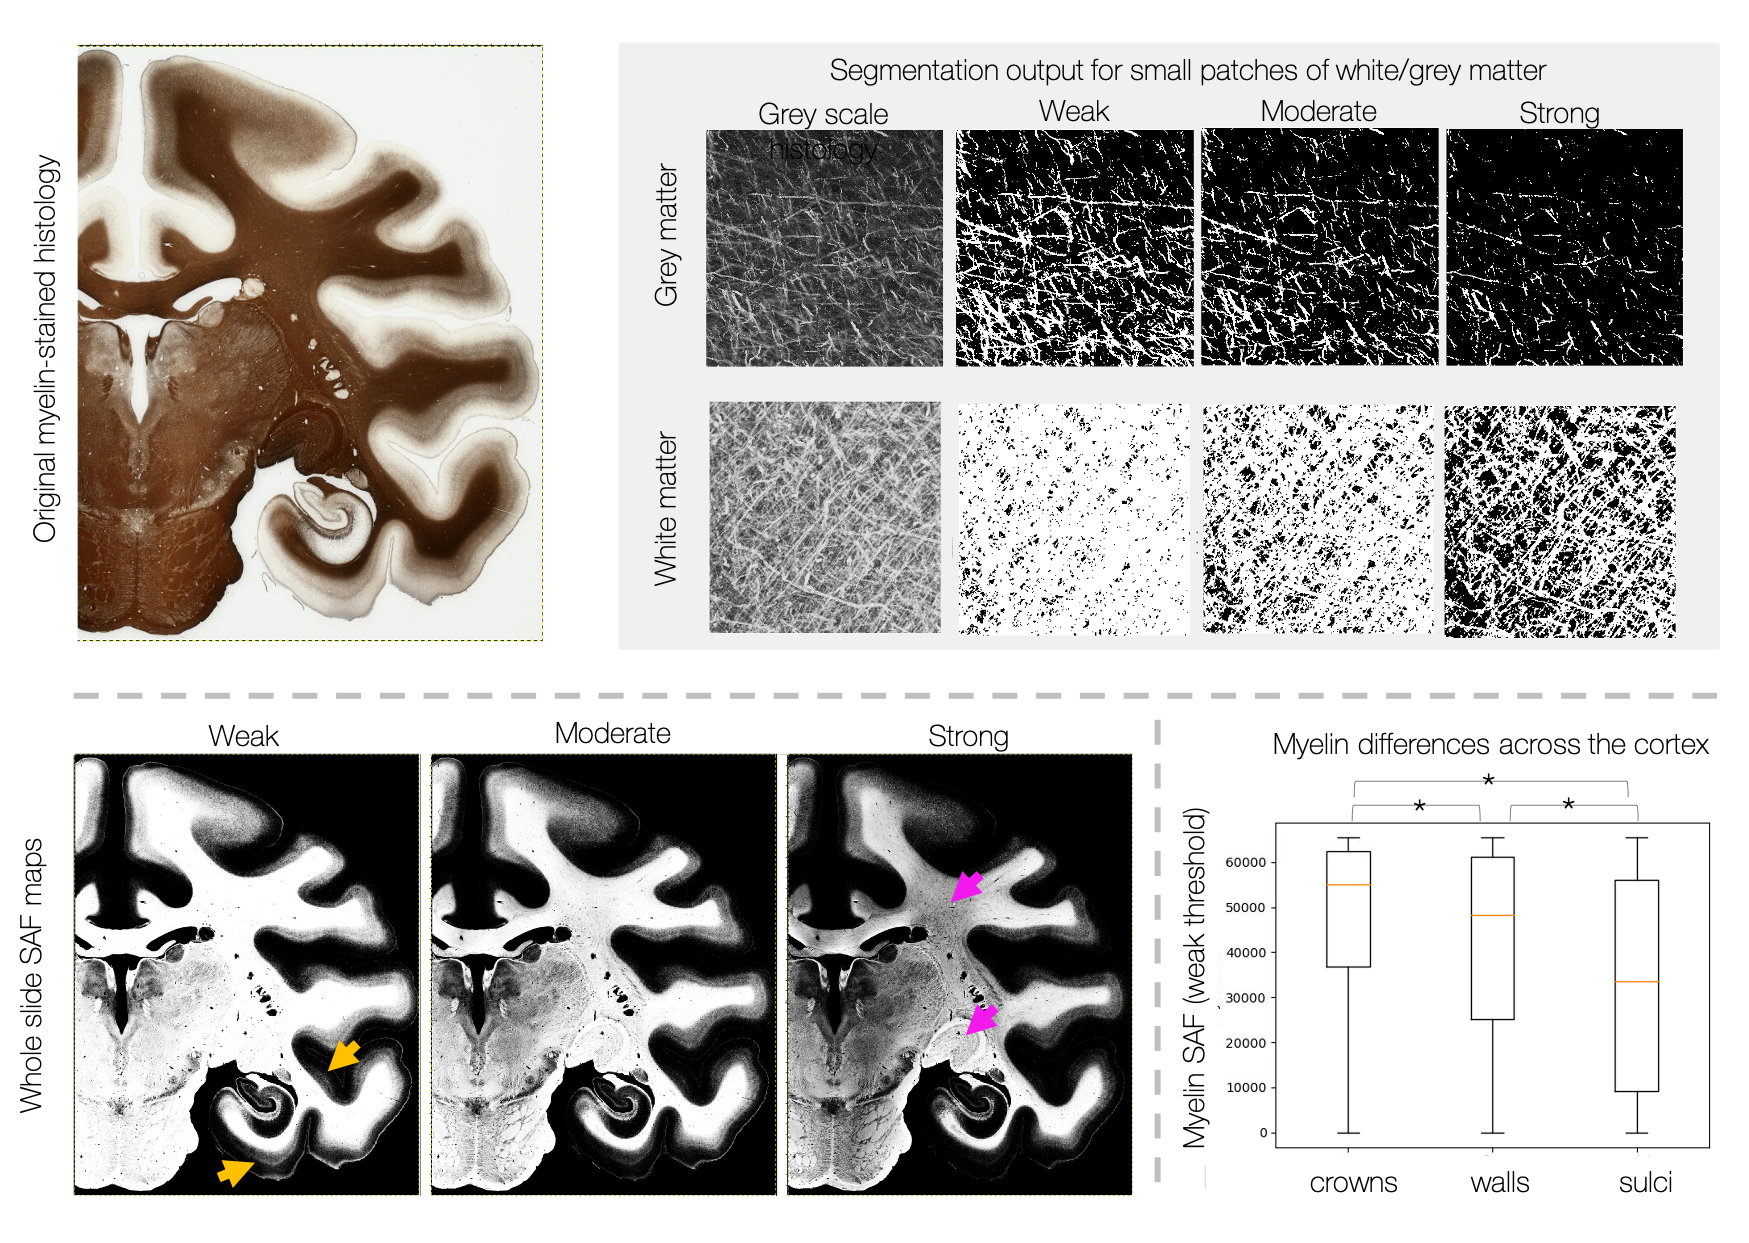
Figure 1: Segmentation of myelin-stained slides. The stained area fraction (SAF) is calculated for three data-driven thresholds. The “weak” threshold provides a better description of weakly stained fibres within the cortex (yellow arrows), whilst the “strong” threshold captures variations in myelin density across the densely stained white matter (pink arrows). We observe increased myelin density at the gyral crowns (defined by Freesufer estimates of cortical curvatures C<-0.1) compared to gyral walls (-0.1<C<0.1) and sulci (C>0.1).
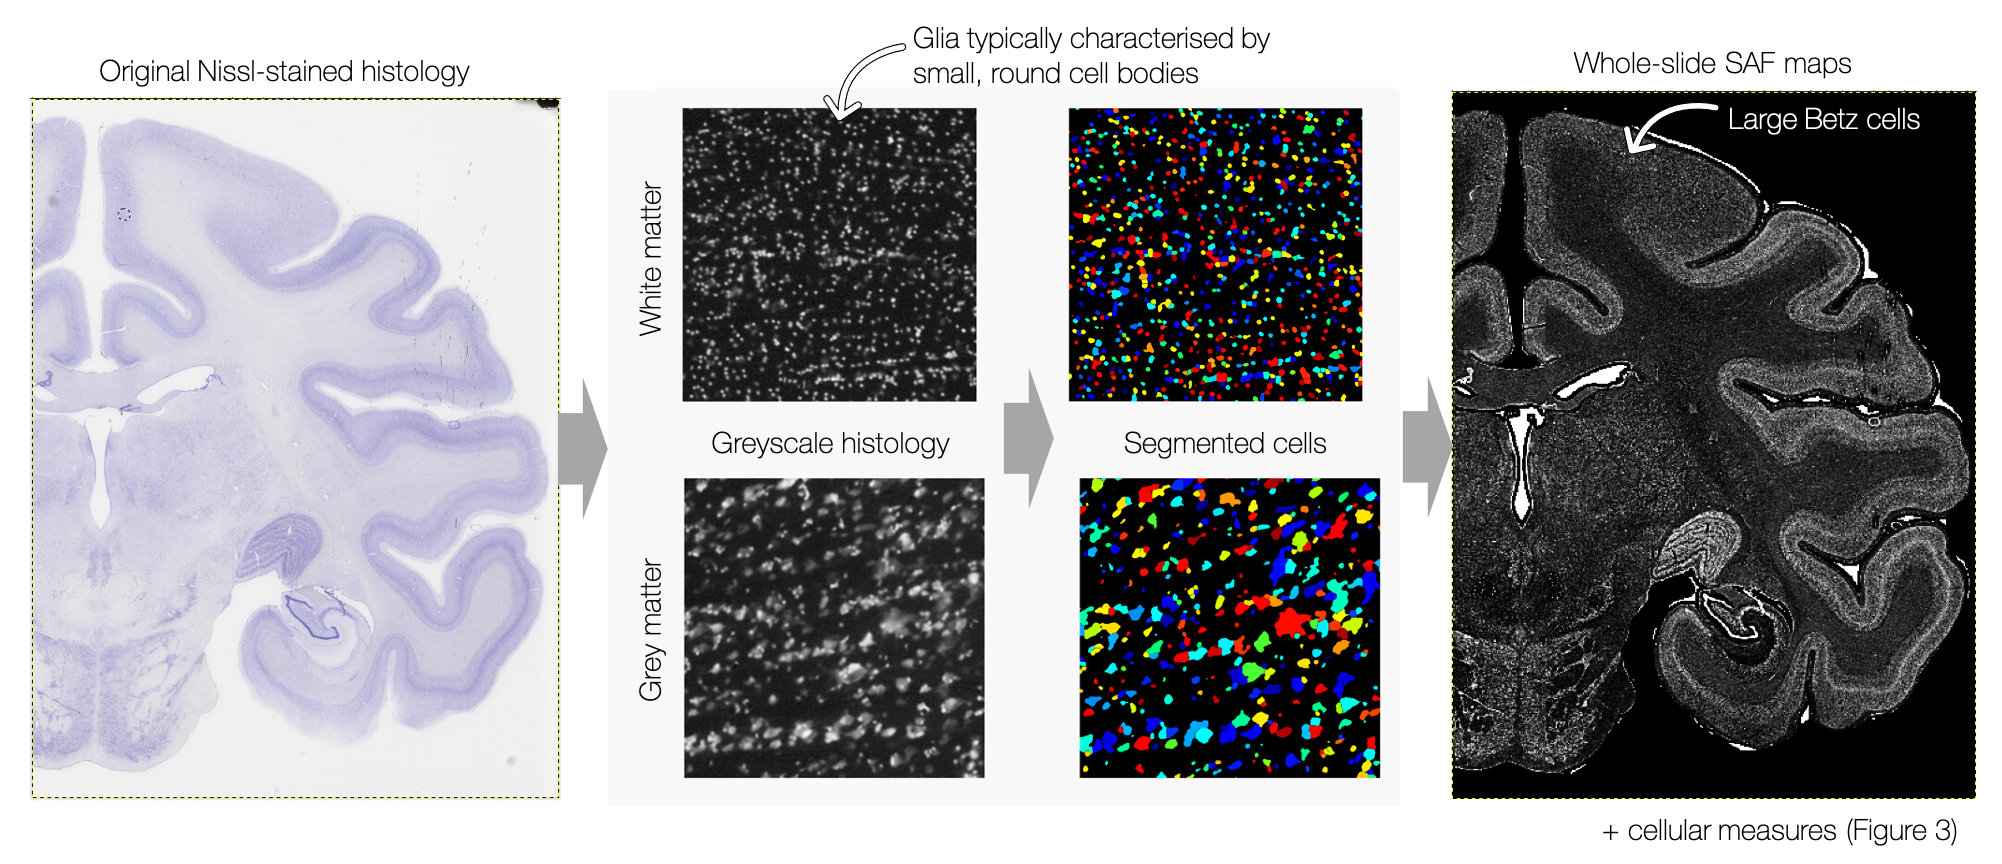
Figure 2: Cell segmentation in Nissl-stained slides. The tissue was first segmented, after which a watershed transform was applied to the stain density to estimate single cells. Morphological metrics such as cell area, circularity, radius and distance to nearest neighbour were extracted. The Nissl SAF faithfully describes variations in cell density across cortical layers, and captures large Betz cells in the motor cortex.
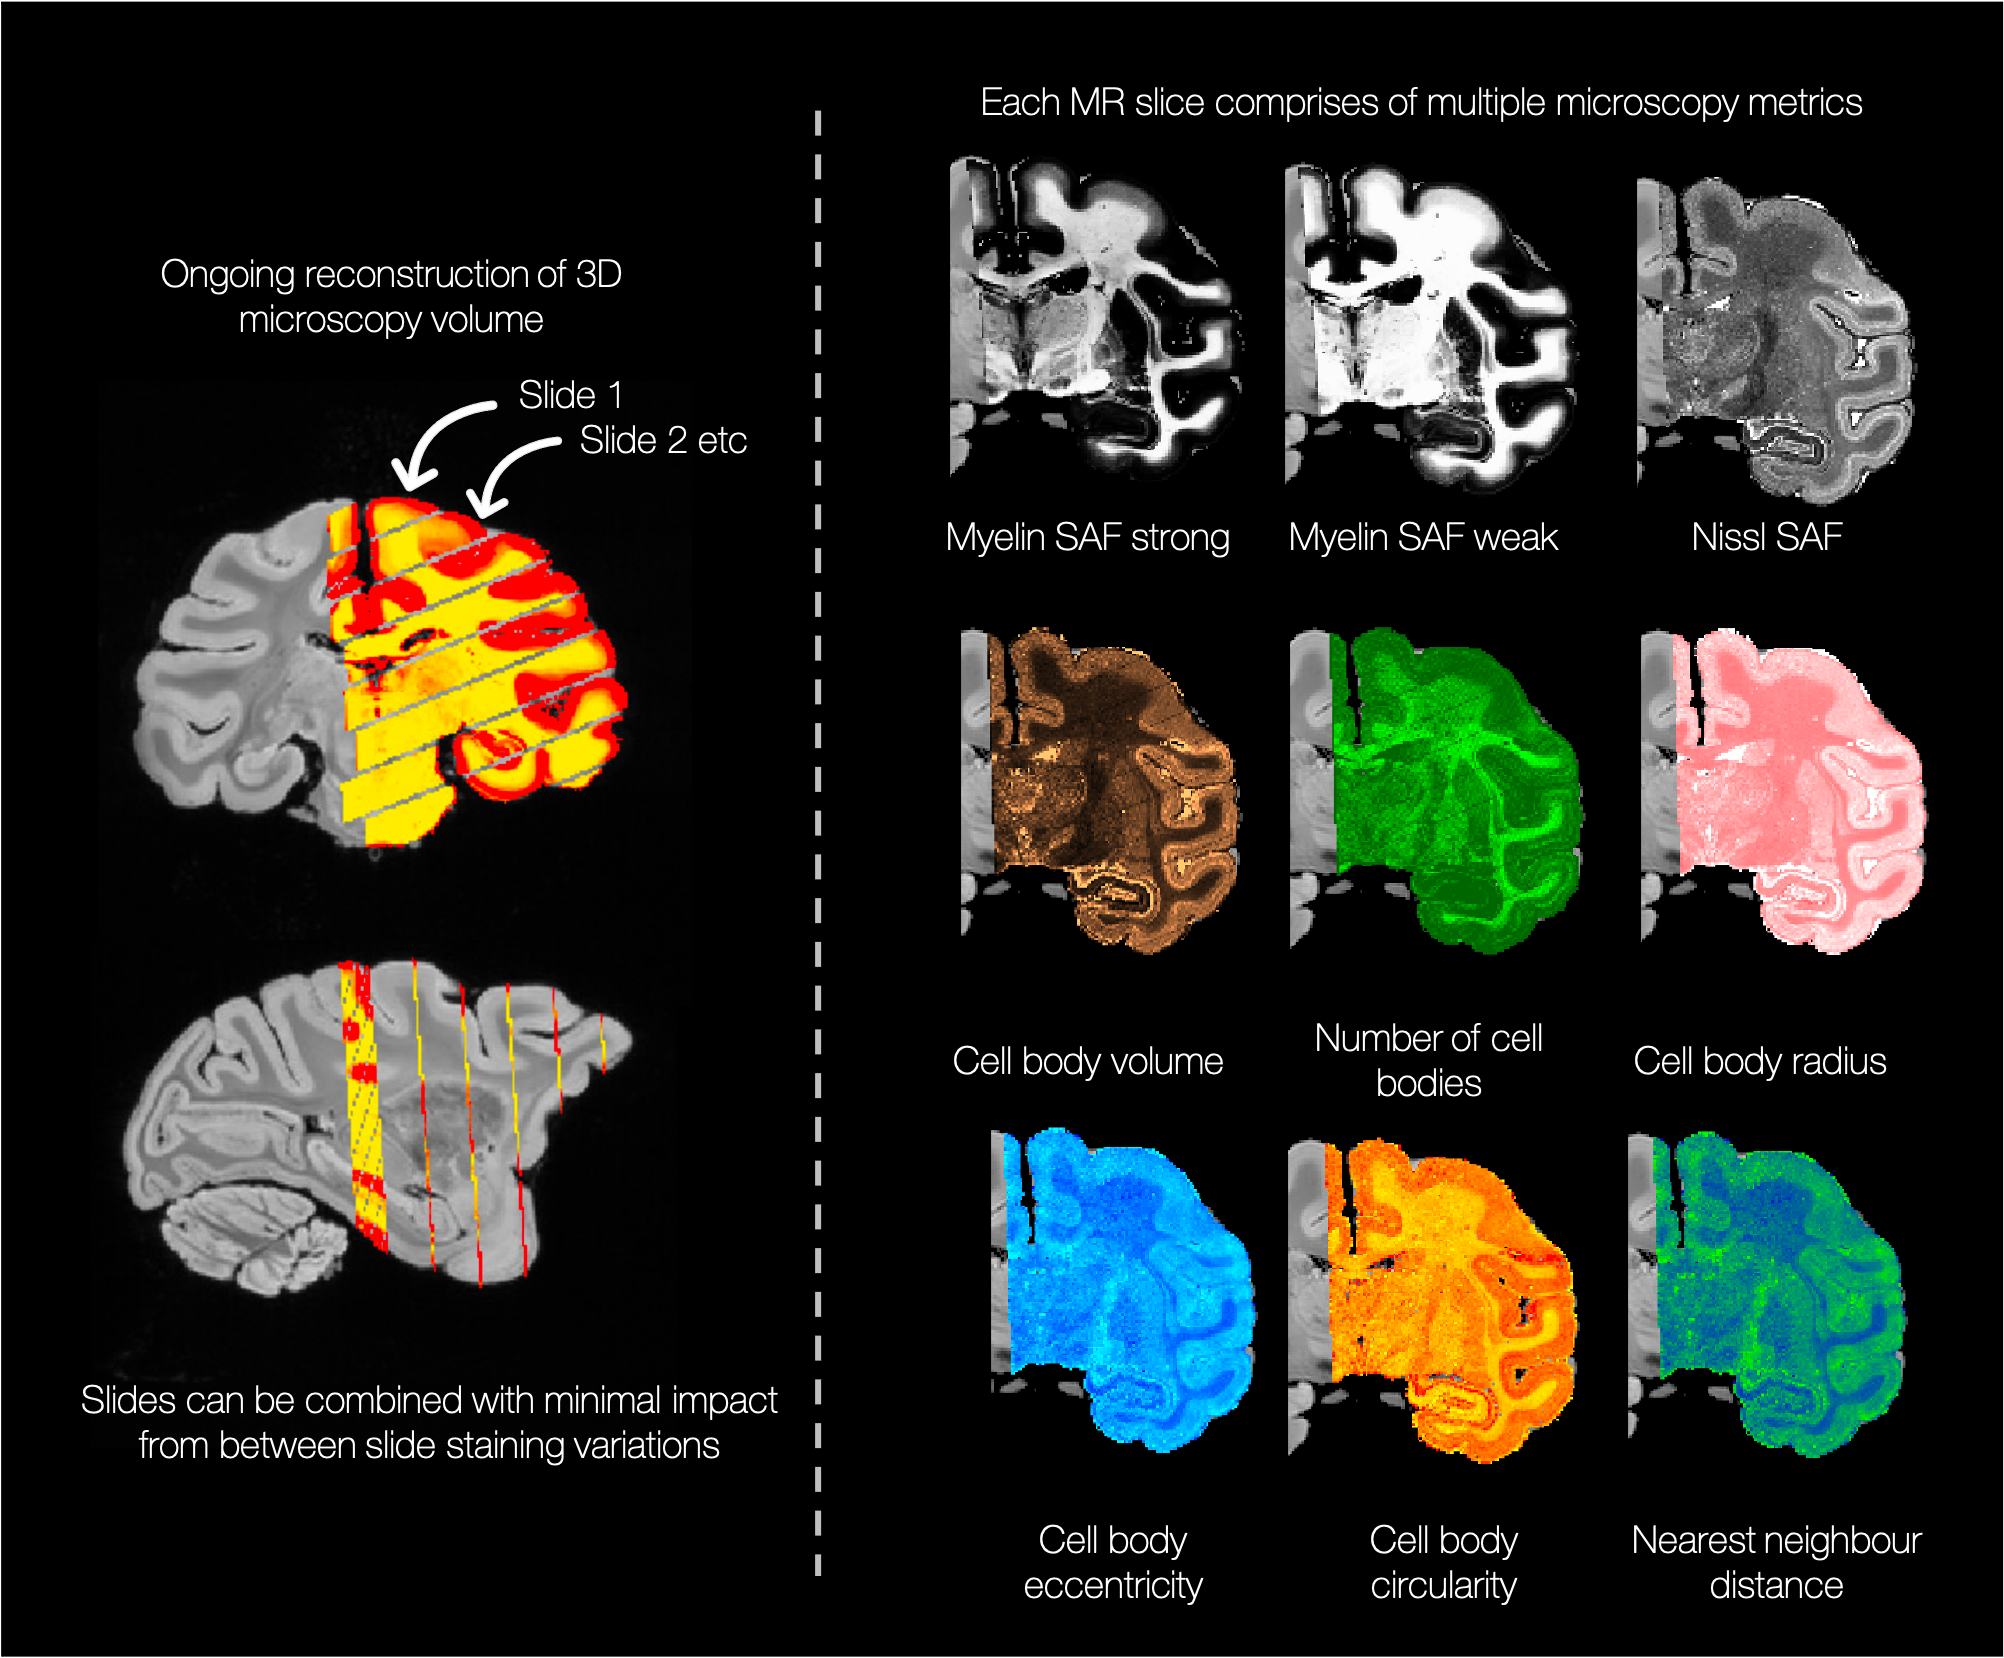
Figure 3 left: Microscopy maps were reconstructed into a 3D volume aligned with the structural MRI. We obtain comparable metrics across slides (where each slide warps through multiple MRI planes) validating our method as being agnostic to between-slide staining variations. Right: Maps of the extracted microscopy metrics show subtly different sensitivity to specific aspects of the tissue microstructure (e.g. the number of cell bodies appears to be a strong descriptor of differences in cortical layers).
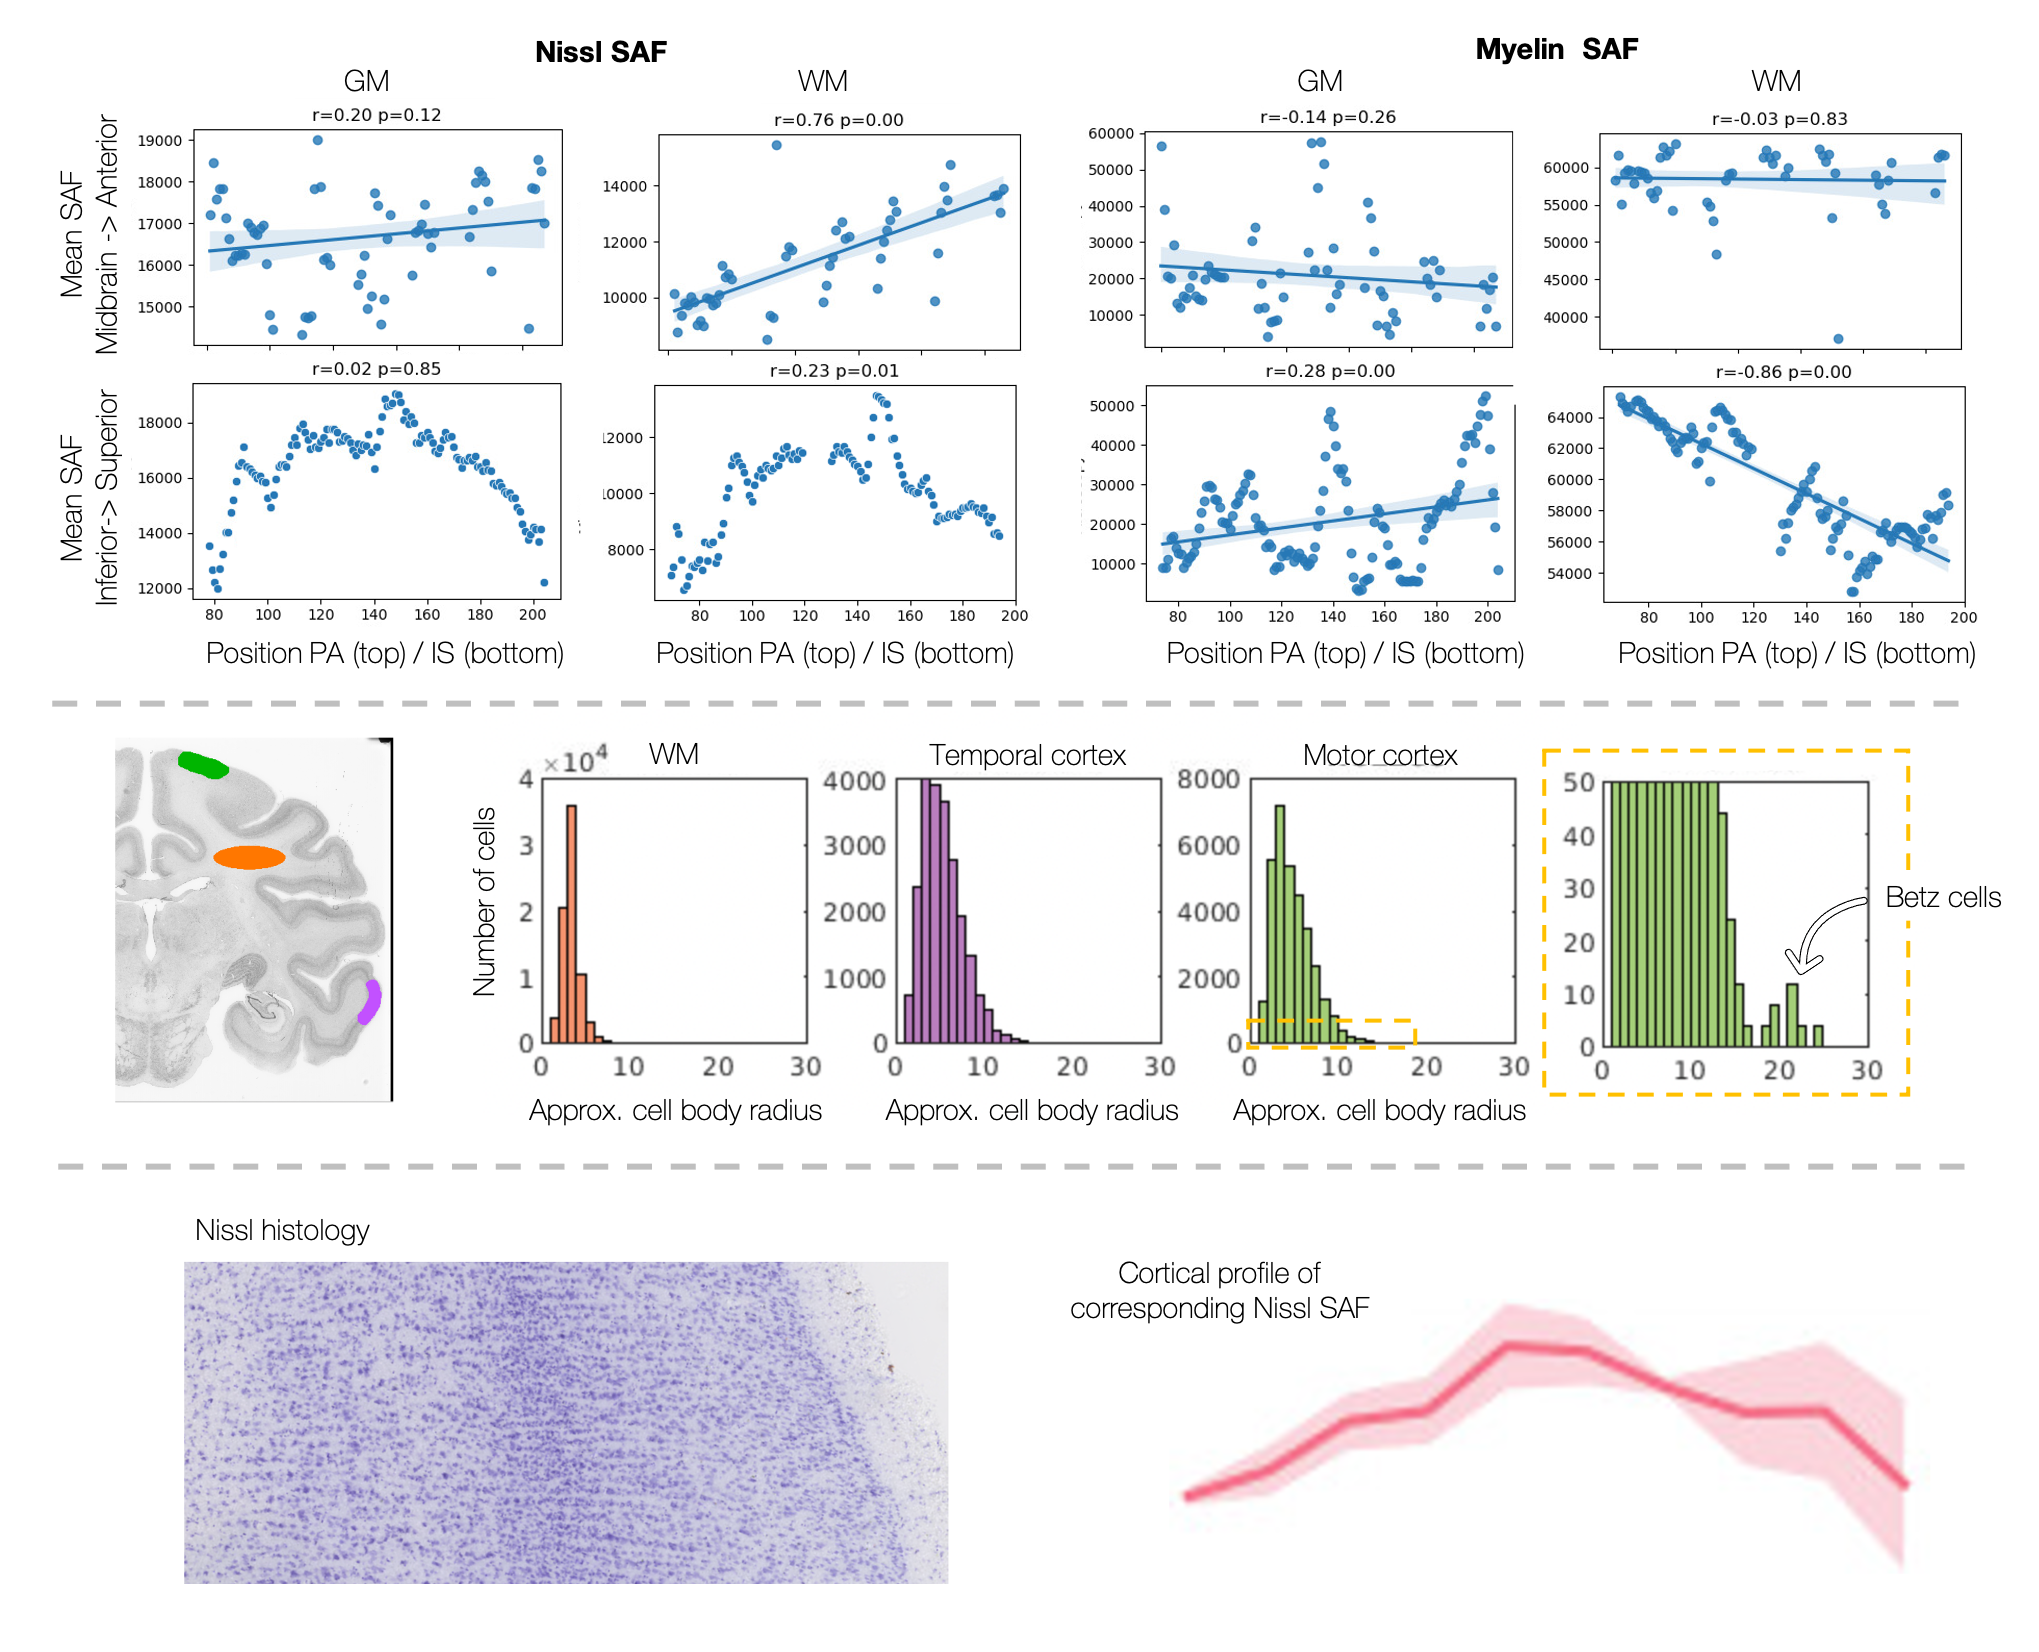
The microscopy metrics can describe cellular differences across a) brain axes (AP/IS), b) regions of interest and c) cortical columns. a) We observe linear increases in Nissl SAF in more anterior white matter regions, and decreases in myelin SAF in more superior white matter. b) The axon diameter distribution across different regions of interest (orange=white matter, purple=temporal cortex, and green=motor cortex). c) The myelin SAF cortical profile well represents cellular variations from histology.

Figure 5: MRI-microscopy correlation coefficients for the white/grey matter. Example correlations are shown. Top right: The nearest neighbour distance and DTI MD in the white matter. Bottom right: The myelin stained area fraction (SAF) and isotropic tissue diffusivity (Di) from the CODIVIDE model of combined linear and spherical tensor encoded data (LTE+STE) in the grey matter.
DOI: https://doi.org/10.58530/2023/0692