0687
Diffusional exchange versus microscopic kurtosis from CTI: Two conflicting interpretations of the same data1Medical Radiation Physics, Lund, Lund University, Lund, Sweden, 2Clinical Sciences Lund, Lund University, Lund, Sweden
Synopsis
Keywords: Diffusion/other diffusion imaging techniques, Microstructure
Correlation tensor magnetic resonance imaging (CTI) is a recently proposed technique that uses diffusion MRI with double diffusion encoding to disentangle microscopic from isotropic and anisotropic kurtosis. One assumption of the method is that intercompartmental exchange is negligible. Another approach that assumes multi-Gaussian exchange (MGE) can also be applied to data acquired with a CTI protocol, but it interprets the contrast as exchange rather than microscopic kurtosis. Using Monte Carlo simulations in substrates of permeable spheres, cylinders and ellipsoids, we observe that both the CTI parameter μK and the estimated exchange rate from MGE increase with the underlying exchange rate.Introduction
Diffusion MRI with non-conventional gradient waveforms such as double diffusion encoding1,2, or free gradient waveforms3 improves specificity to microstructure by disentangling different sources of diffusional kurtosis. So-called b-tensor encoding separates anisotropic and isotropic components of kurtosis4,5, and the more recently proposed correlation tensor imaging (CTI)6,7 separates an additional component that is interpreted as microscopic kurtosis. A completely different approach that assumes multi-Gaussian exchange (MGE) can be applied to the same DDE waveforms used in CTI, but will provide an estimate of the exchange rate rather than the microscopic kurtosis8,9. Since CTI and MGE can be applied to the same data but carry different interpretations of the same signal behaviour, it is relevant to compare the two. Here, we have investigated diffusion in systems with permeable spheres, cylinders, and ellipsoids to learn how metrics from CTI and MGE respond to changes in the exchange rate.Theory
The CTI signal representation is expressed as7$$\log(\bar{E}_ {DDE}(b_1,b_2,\theta))\approx -(b_1+b_2)\bar{D}+\frac{1}{6}(b_1^2+b_2^2)\bar{D}^2K_T+\frac{1}{2}b_1b_2\cos{^2}(\theta)\bar{D}^2K_{aniso}+\frac{1}{6}b_1b_2\bar{D}^2(2K_{iso}-K_{aniso})\quad\quad \text{(1)}$$
where $$$\bar{E}_ {DDE}$$$ is the powder-averaged DDE signal, $$$b_1$$$ and $$$b_2$$$ are the b-values of the first and second diffusion gradient pairs, $$$\theta$$$ is the angle between the pairs, $$$\bar{D}$$$ is the mean diffusivity, $$$K_T$$$ is the total kurtosis defined by the sum of the anisotropic, isotropic, and microscopic kurtosis according to $$$K_T=K_{aniso}+K_{iso}+\mu K$$$. Note that Eq.1 assumes the long mixing time regime where the DDE signal is fully described by the two b-values and the angle between the gradient pairs. Eq.1 also assumes exchange can be neglected.
Diffusion in multiple exchanging Gaussian environments has been analysed previously using a generalisation of the Kärger model8,9. For DDE, the theory, which we refer to as “multi-Gaussian exchange” (MGE), is given by the signal representation
$$\log(\bar{E}_ {DDE}(b_1,b_2,\theta =0))\approx -(b_1+b_2)\bar{D}+\frac{1}{6}(b_1+b_2)^2\bar{D}^2K_T(1 -k\Gamma)\quad\quad\text{(2)}$$
where k is the exchange rate and $$$\Gamma$$$ is the exchange-weighting parameter that is computed from the gradient waveform and is proportional to the mixing time8.
Equivalence between Eq.1 and 2 yields the following relationship between μK and k:
$$\mu K=\frac{(b_1+b_2)^2}{2b_1b_2}K_T\cdot k\Gamma\sim K_T\cdot k\Gamma\quad\quad\text{(3)}$$
This means that we expect negligible μK in systems that are well-described by multiple Gaussian environments with negligible exchange. Conversely, we expect μK to depend on the mixing time if there is exchange.
Methods
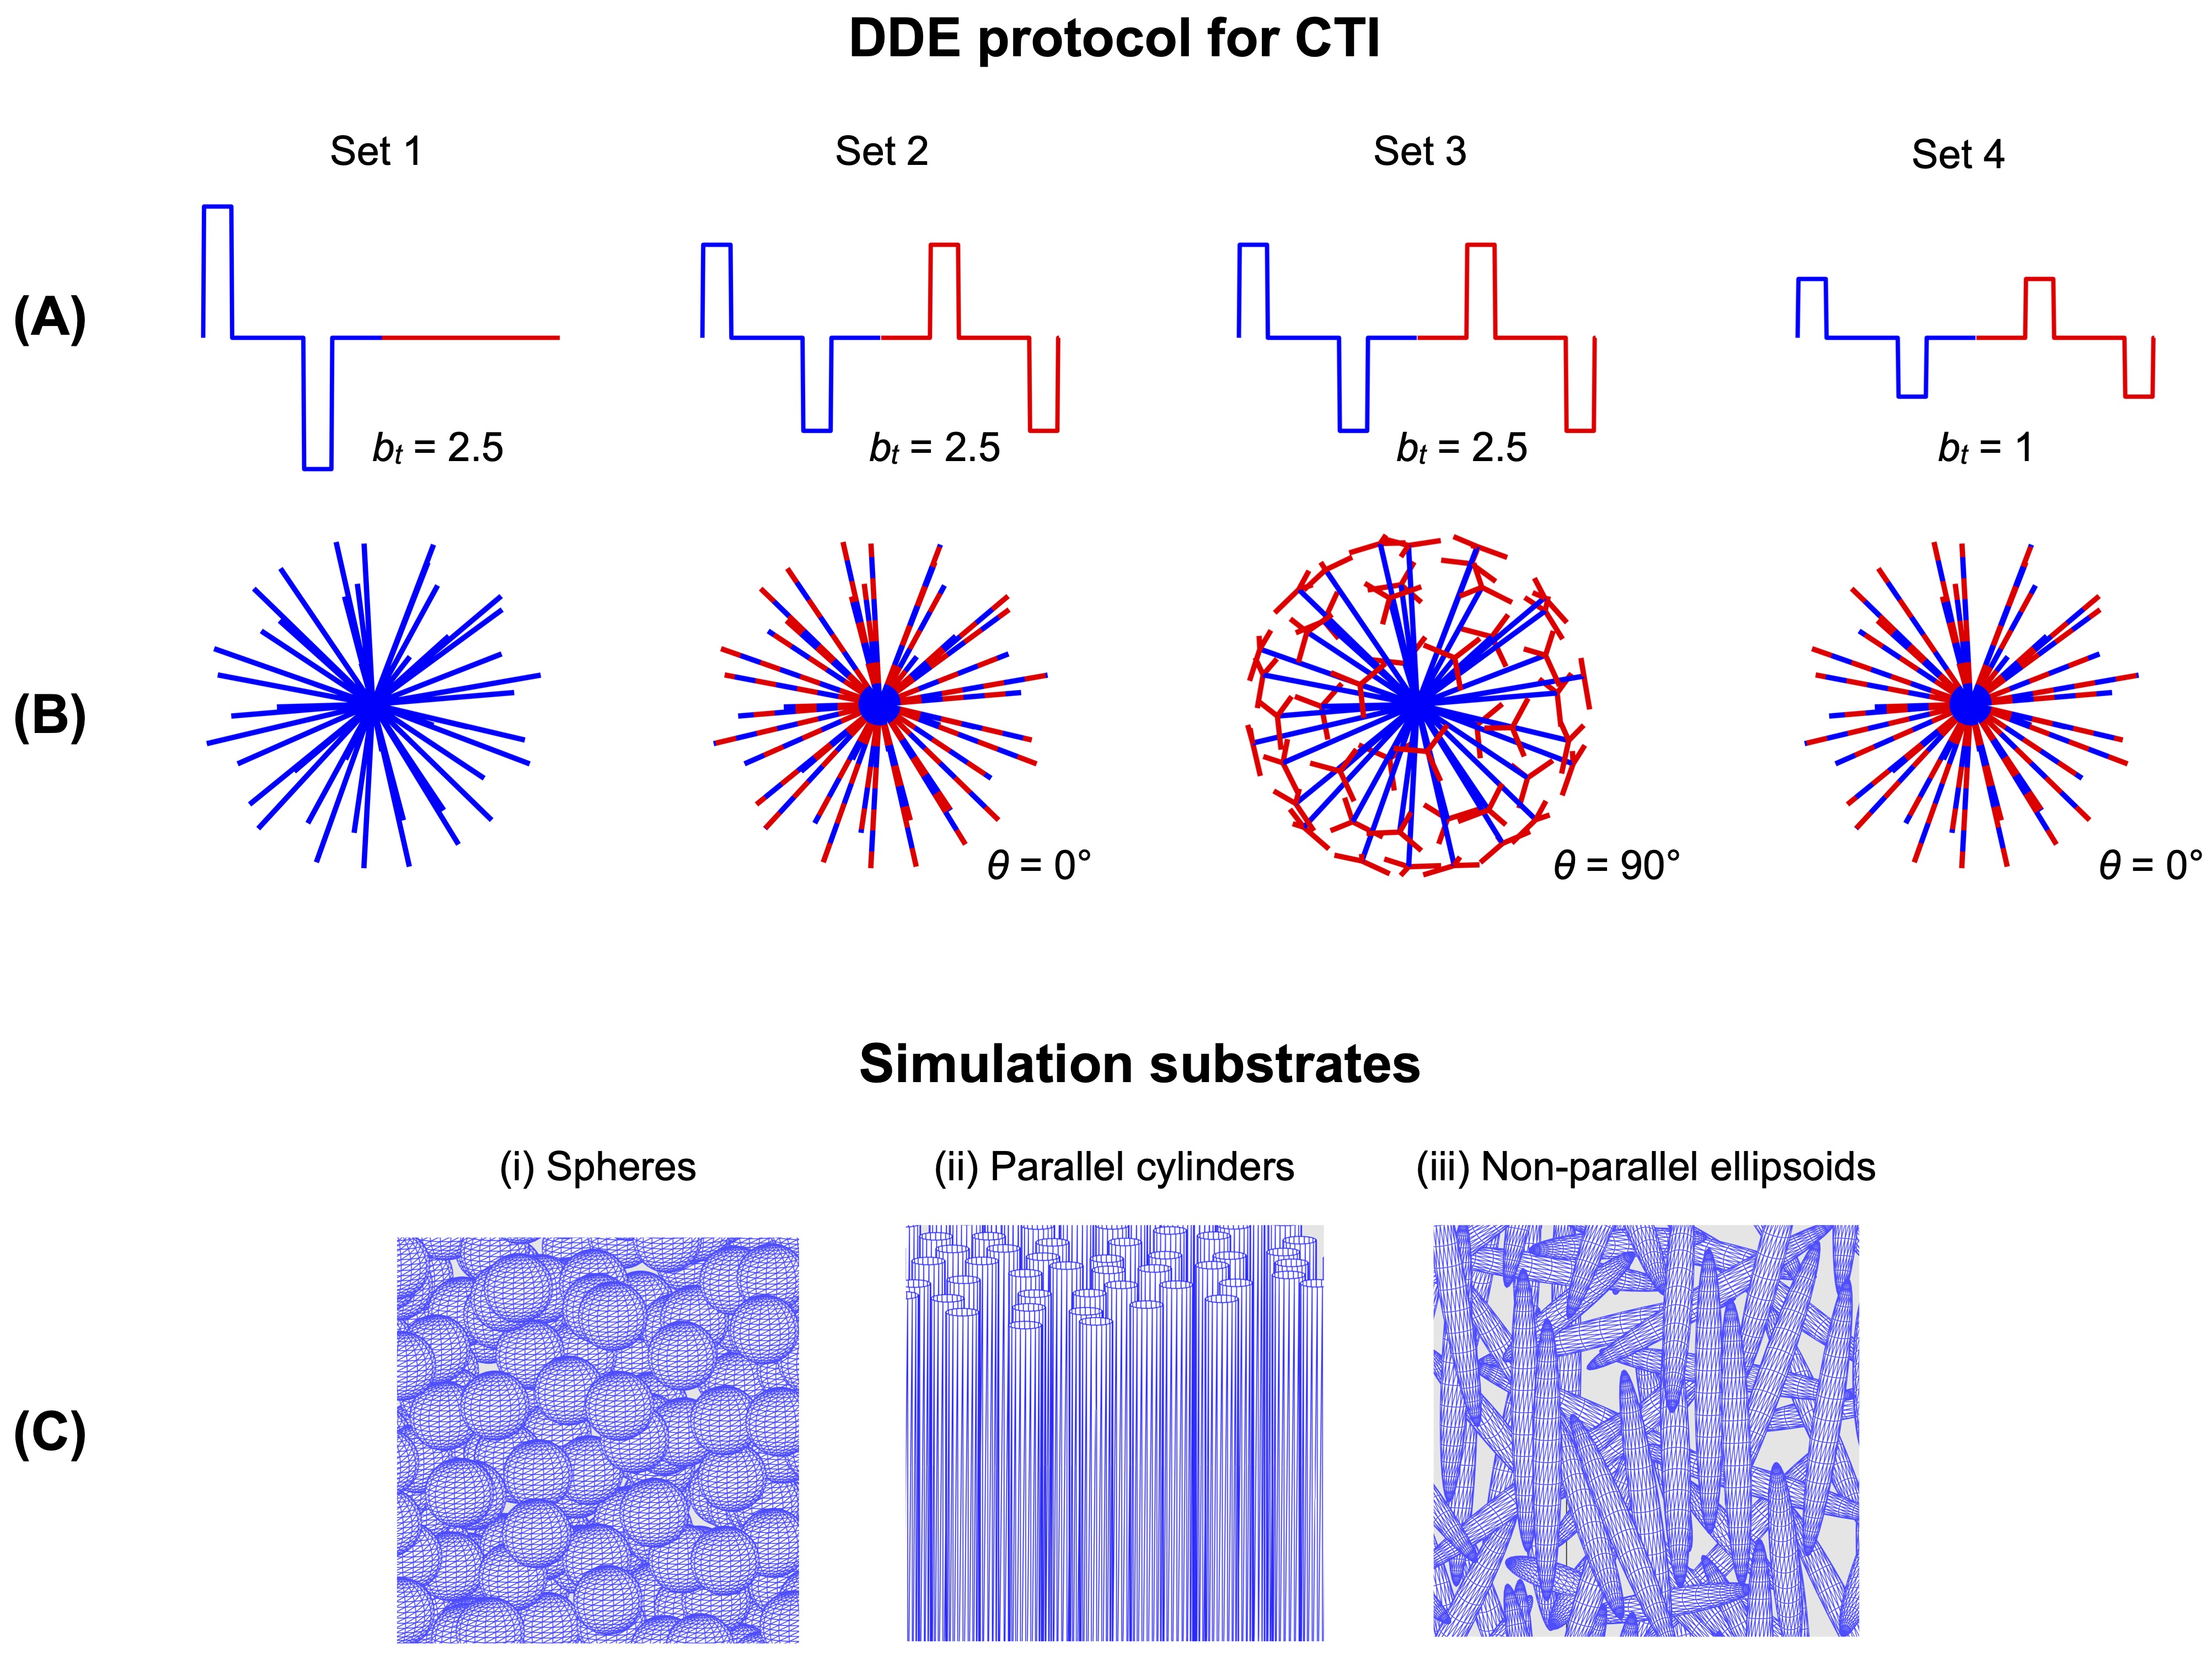
Protocol designThe CTI protocol used in this study is shown in Fig.1 and is, apart from the gradient rotation scheme, identical to the one used in ref 7 . The protocol features four sets of acquisitions with different combinations of $$$b_1,b_2\text{ and }\theta$$$ rotated in 45 directions. Additionally, to verify fulfilment of the long-mixing-time condition, two more protocols with parallel and antiparallel DDE acquisitions were created.
Numerical simulations
Monte Carlo simulations were performed in the three synthetic substrates shown in Fig.1C: spheres of diameter 6 μm, parallel cylinders of diameter 6 μm and randomly oriented ellipsoids with axis lengths 2,2 and 20 μm. Simulations utilised 105 particles, a simulation time step of 1 μs, intracellular = extracellular fraction = 0.5 and bulk diffusivity = 2 μm2/ms. The permeability was varied to yield exchange rates from 0 to 100 s-1.
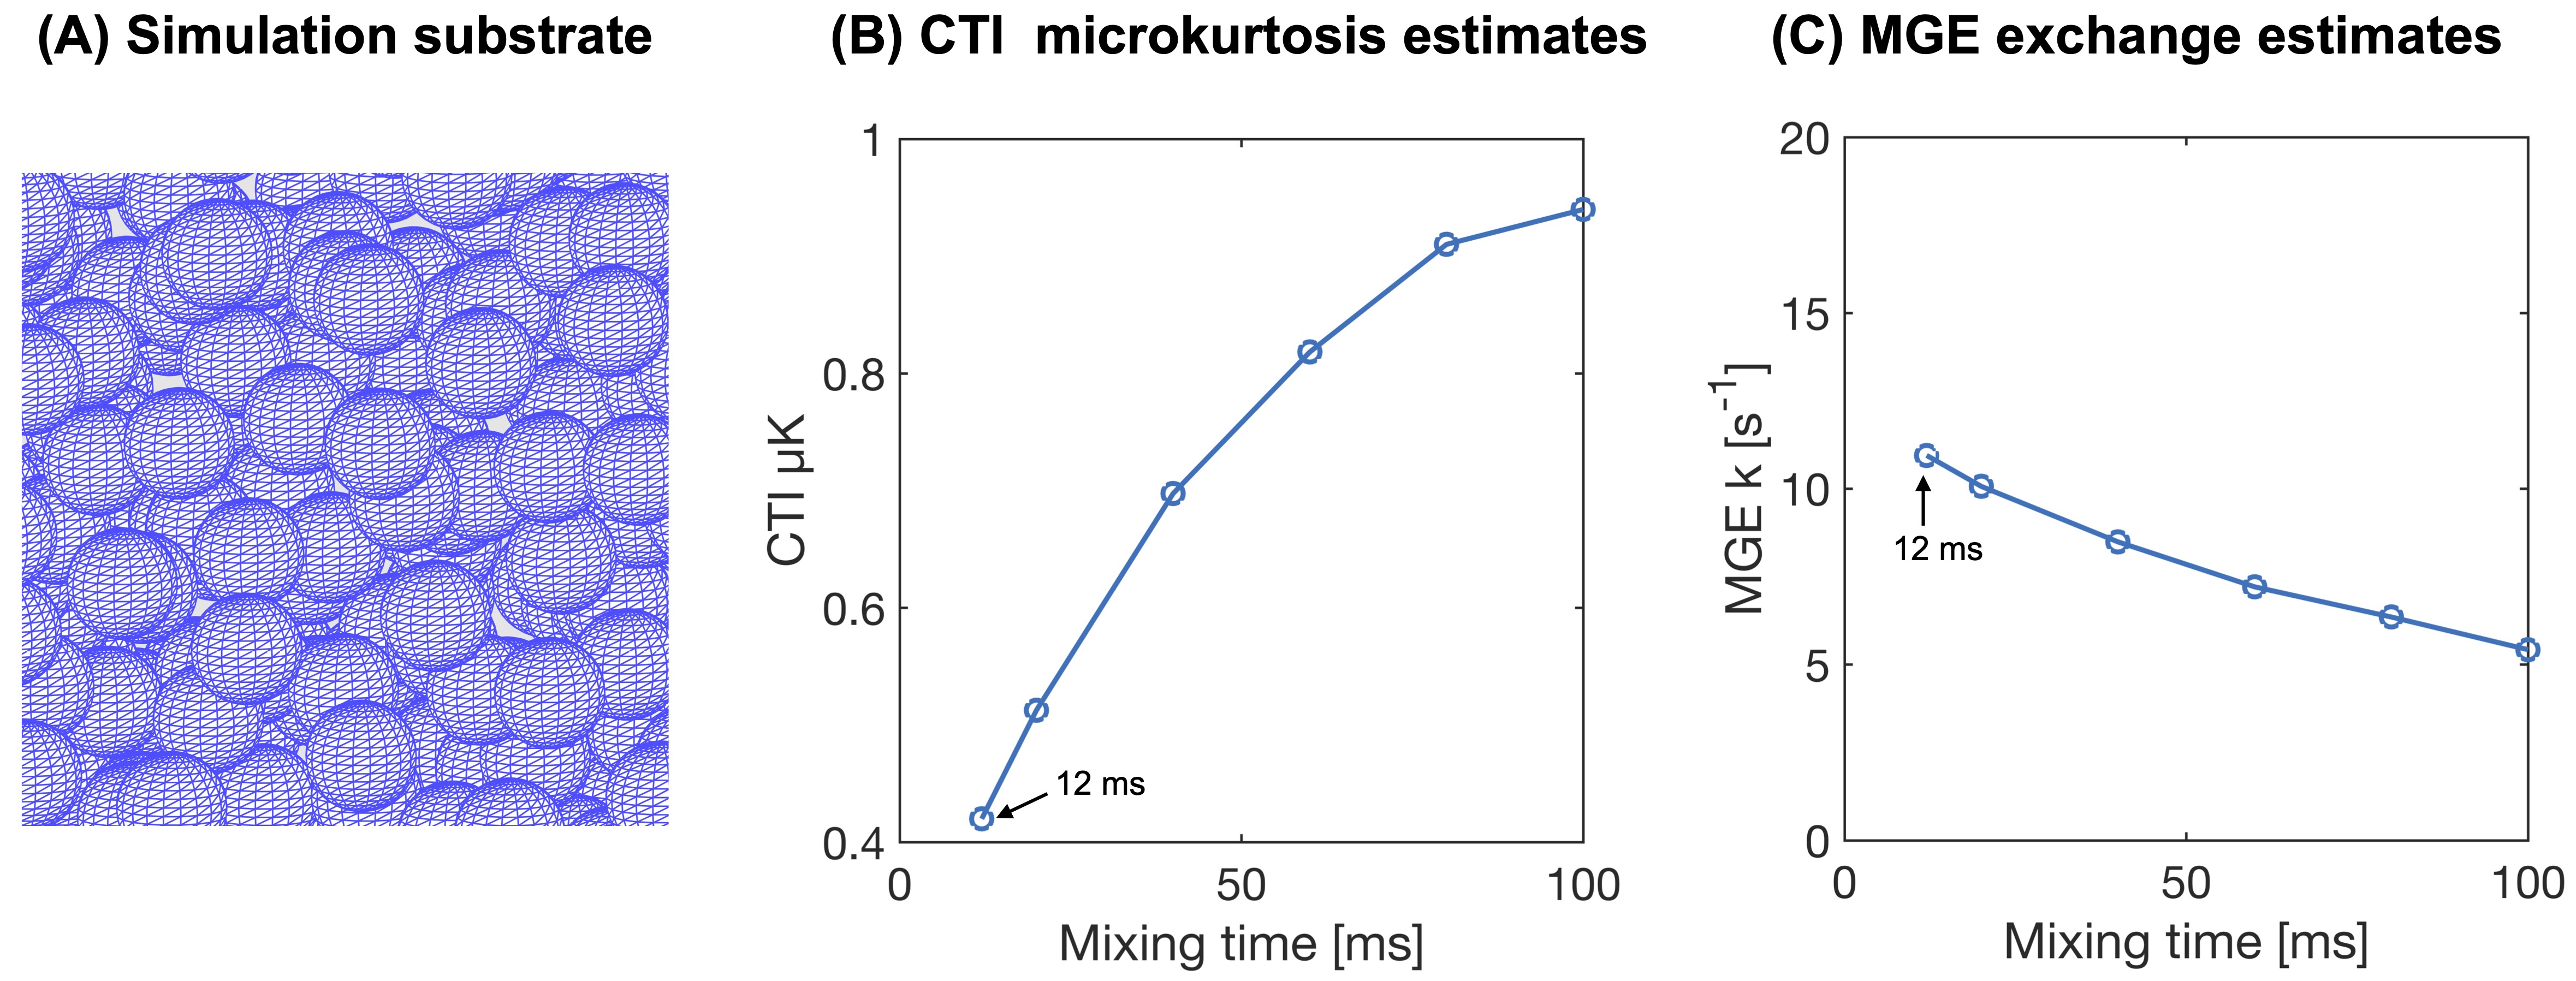
To study the effect of varying mixing time on CTI, the mixing time was varied from 12 ms (default) to 100 ms using the spheres substrate at an exchange rate of 20 s-1.
Data analysis
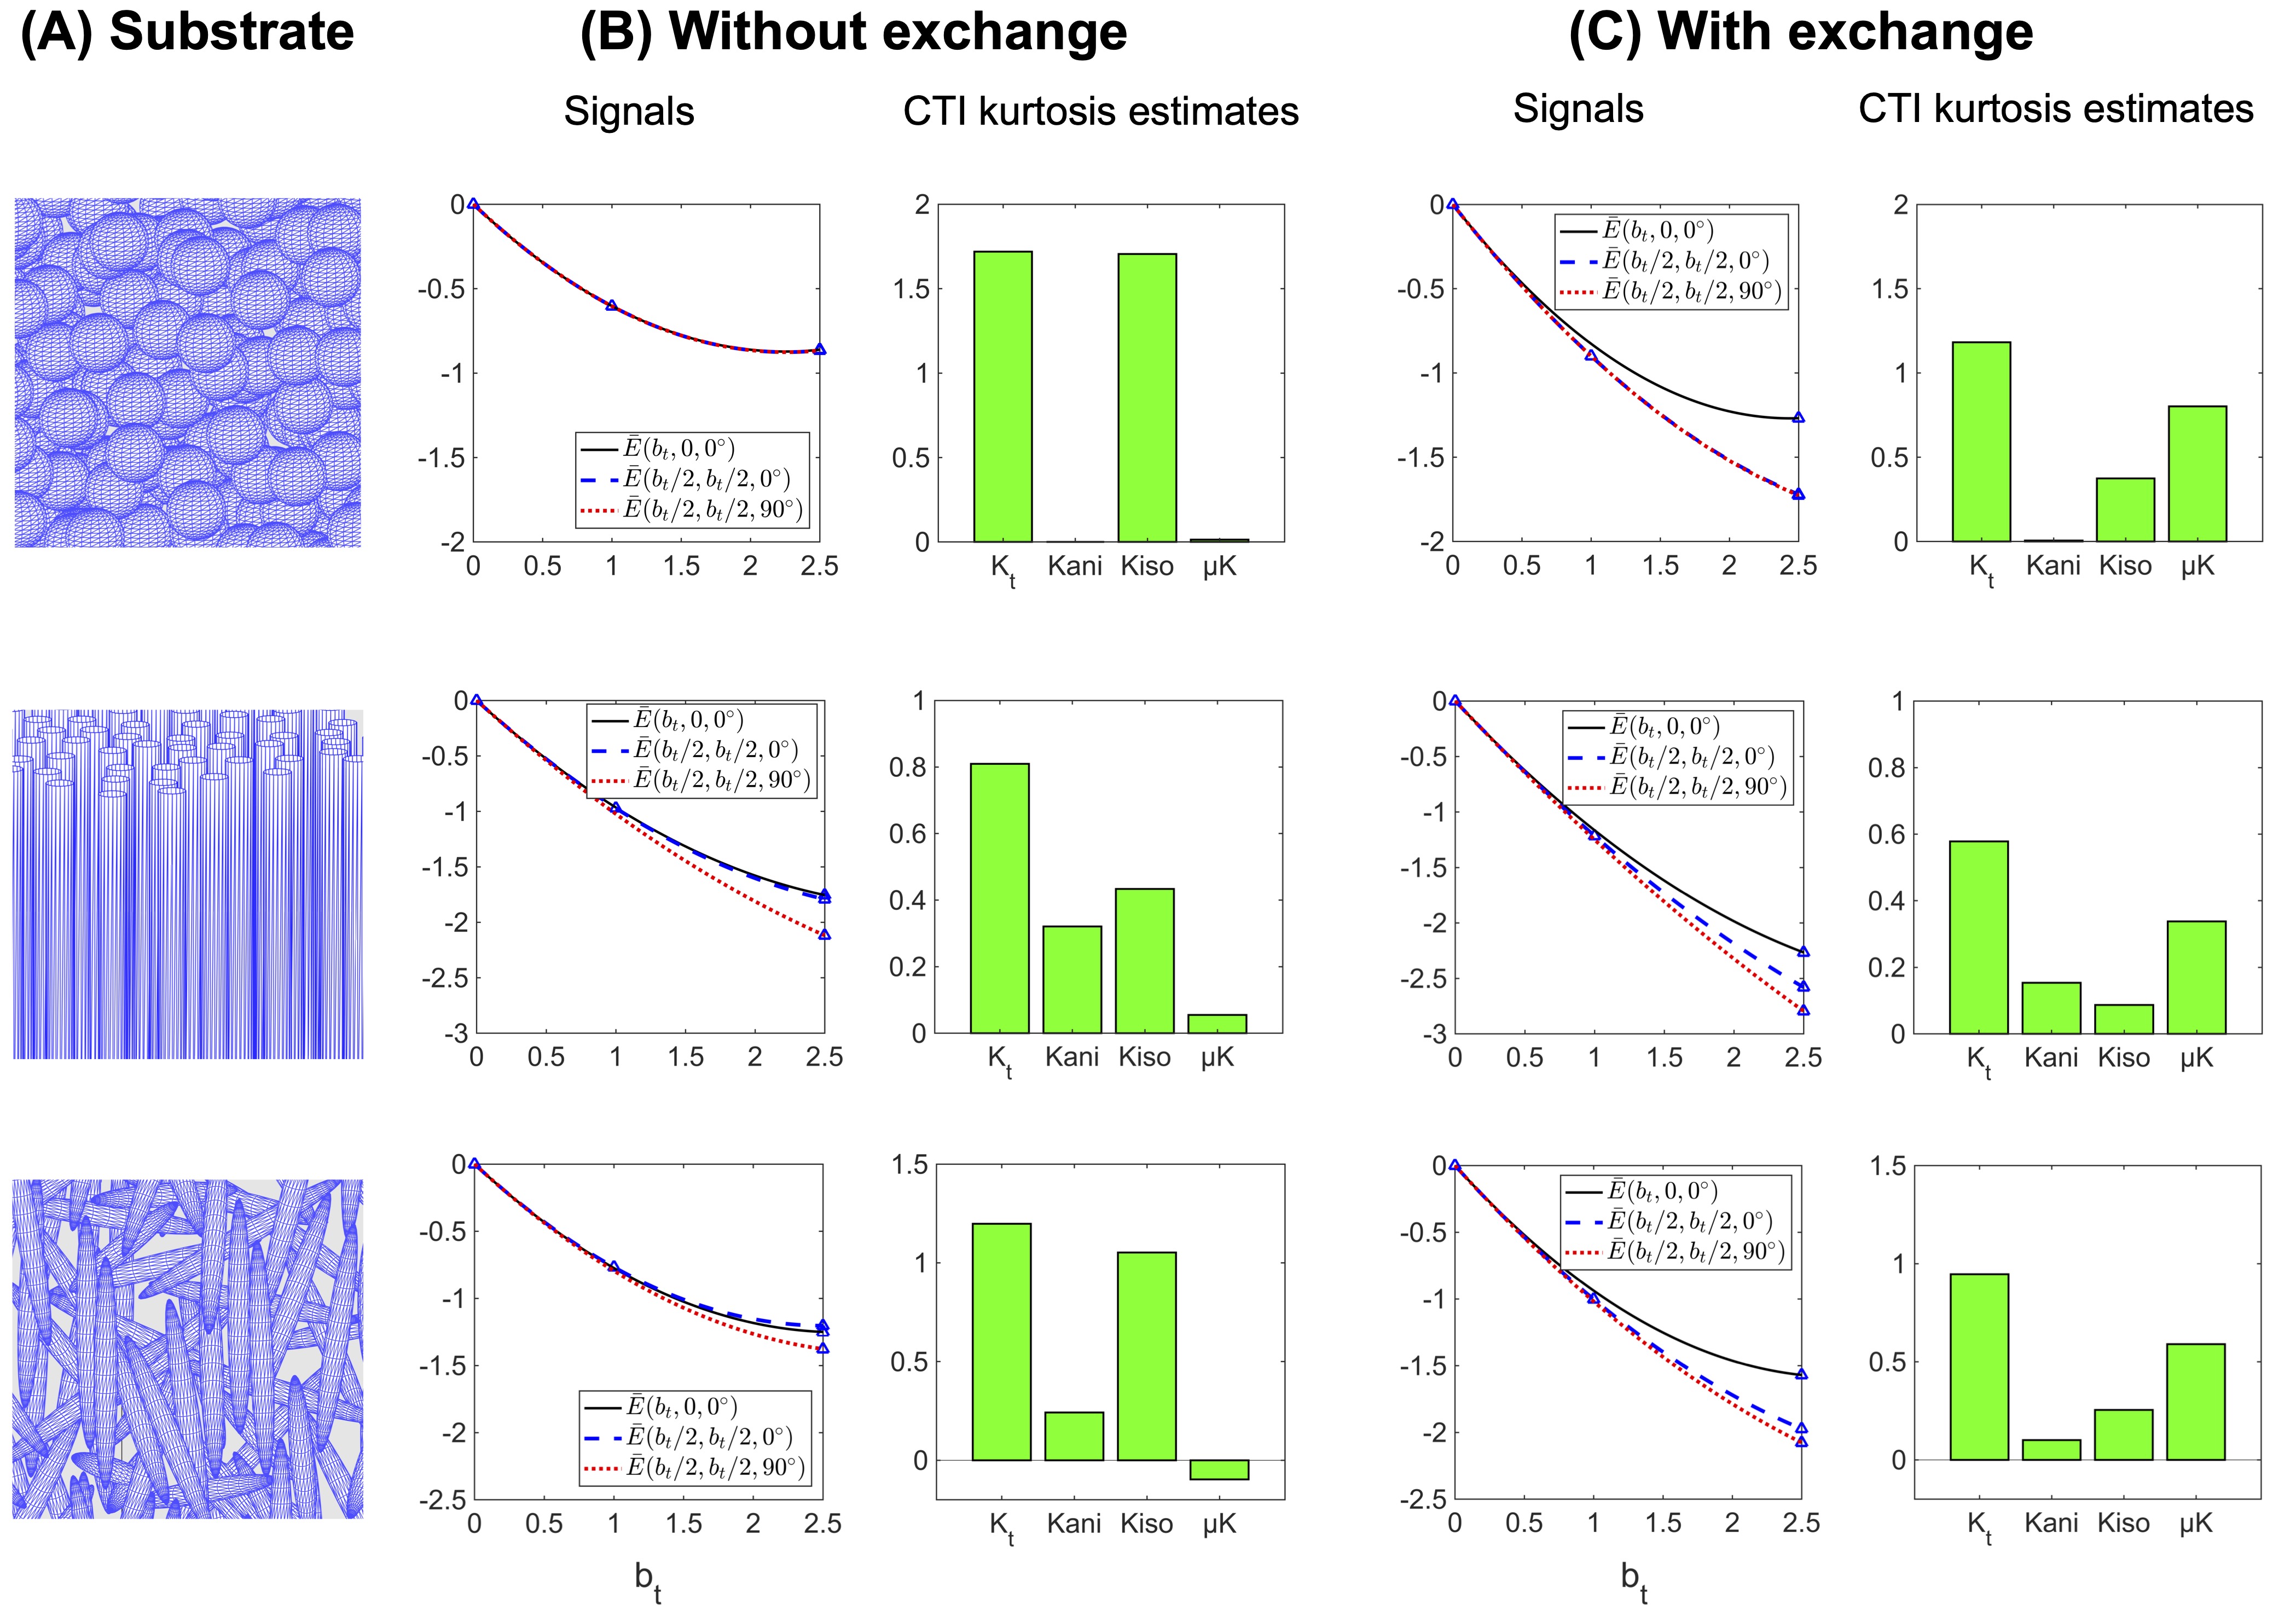
CTI parameters were estimated by fitting Eq.1 to powder-averaged signals simulated using the protocol in Fig.1. Fitting was done using lsqnonlin in MATLAB (MathWorks, Natick, MA, USA; R2019a). Fulfilment of the long mixing-time condition was assessed by subtracting the log of powder-averaged signals obtained with parallel vs antiparallel encoding blocks6. For MGE, exchange estimates were obtained by fitting Eq.2 to a subset of the powder-averaged data with $$$\theta=0^{\circ}$$$.
Results
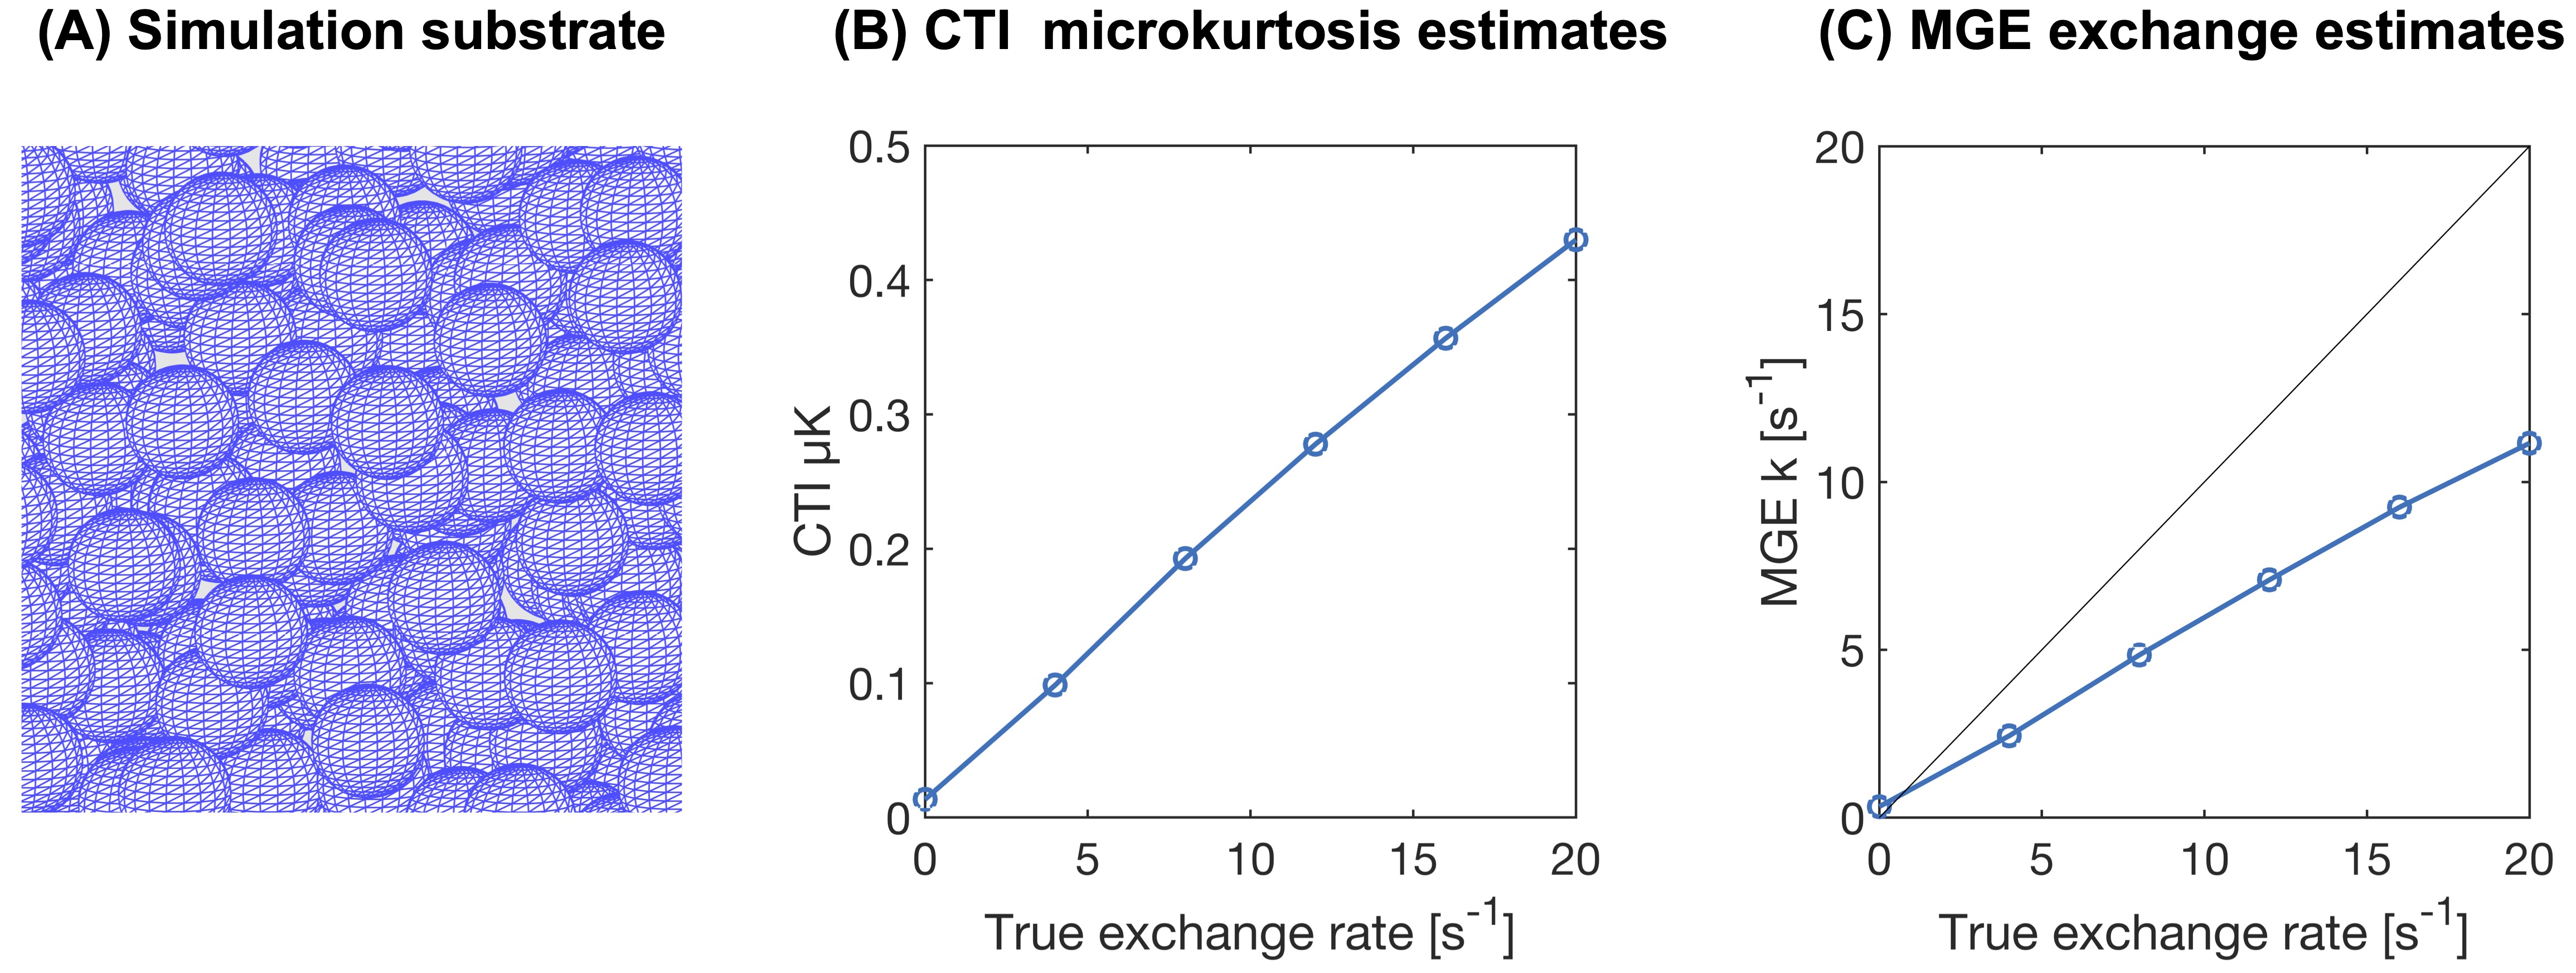
The influence of exchange on CTI parameter estimates is shown in Fig.2. Exchange decreases the total kurtosis—consistent with the view of exchange being a homogenisation process. Inspecting the kurtosis components, we note that μK increases when exchange is present. Fig.3 illustrates the dependence of μK on the exchange rate. It also shows the MGE-estimated exchange rate (k). Estimated values of k increase with the ground truth, but the values are generally negatively biased.The effect of varying mixing time on both μK and k is shown in Fig.4. µK increases with mixing time while k from MGE decreases somewhat. The log difference between parallel and antiparallel DDE signals at mixing time 12 ms was 0.0014, implying that the long-mixing-time condition of CTI was satisfied for all mixing times considered.
Discussion
Our results show that microscopic kurtosis from CTI increases with increasing permeability in a compartmentalised system. MGE applied to the same data yielded exchange rate estimates that correlated with the ground truth. Taken together, these observations suggest that where exchange is non-negligible, the MGE interpretation is more compatible with the microstructure than CTI. Examples of such microstructures include grey matter, tumours, and stroke lesions10–12. In structures with unknown exchange rates, DDE with variable mixing times can be used to determine if exchange is a likely confounder since CTI but not MGE predicts a constant kurtosis with increasing mixing time. In conclusion, non-negligible intercompartmental exchange induces a positive bias on the microscopic kurtosis obtained with CTI.Acknowledgements
No acknowledgement found.References
1. Cory DG. Measurement of translational displacement probabilities by NMR: An indicator of compartmentation. Magnetic Resonance in Medicine. 1990;14(3):435-444. doi:10.1002/mrm.1910140303
2. Shemesh N, Jespersen SN, Alexander DC, et al. Conventions and nomenclature for double diffusion encoding NMR and MRI. Magnetic Resonance in Medicine. 2016;75(1):82-87. doi:10.1002/mrm.25901
3. Szczepankiewicz F, Westin CF, Nilsson M. Gradient waveform design for tensor-valued encoding in diffusion MRI. Journal of Neuroscience Methods. 2021;348:109007. doi:10.1016/j.jneumeth.2020.109007
4. Westin CF, Knutsson H, Pasternak O, et al. Q-space trajectory imaging for multidimensional diffusion MRI of the human brain. NeuroImage. 2016;135:345-362. doi:10.1016/j.neuroimage.2016.02.039
5. Topgaard D. Multidimensional diffusion MRI. J Magn Reson. 2017;275:98-113. doi:10.1016/j.jmr.2016.12.007
6. Henriques RN, Jespersen SN, Shemesh N. Correlation tensor magnetic resonance imaging. NeuroImage. 2020;211:116605. doi:10.1016/j.neuroimage.2020.116605
7. Henriques RN, Jespersen SN, Shemesh N. Evidence for microscopic kurtosis in neural tissue revealed by correlation tensor MRI. Magnetic Resonance in Medicine. 2021;86(6):3111-3130. doi:10.1002/mrm.28938
8. Ning L, Nilsson M, Lasič S, Westin CF, Rathi Y. Cumulant expansions for measuring water exchange using diffusion MRI. J Chem Phys. 2018;148(7):074109. doi:10.1063/1.5014044
9. Chakwizira A, Westin CF, Brabec J, et al. Diffusion MRI with pulsed and free gradient waveforms: Effects of restricted diffusion and exchange. NMR in Biomedicine. n/a(n/a):e4827. doi:10.1002/nbm.4827
10. Olesen JL, Østergaard L, Shemesh N, Jespersen SN. Diffusion time dependence, power-law scaling, and exchange in gray matter. arXiv:210809983 [physics]. Published online August 23, 2021. Accessed October 3, 2021. http://arxiv.org/abs/2108.09983
11. Zhang J, Lemberskiy G, Moy L, Fieremans E, Novikov DS, Kim SG. Measurement of cellular-interstitial water exchange time in tumors based on diffusion-time-dependent diffusional kurtosis imaging. NMR Biomed. 2021;34(6):e4496. doi:10.1002/nbm.4496
12. Lampinen B, Lätt J, Wasselius J, Westen D van, Nilsson M. Time dependence in diffusion MRI predicts tissue outcome in ischemic stroke patients. Magnetic Resonance in Medicine. 2021;86(2):754-764. doi:10.1002/mrm.28743
Figures