0686
Exchange-driven Microscopic Kurtosis in Correlation Tensor MRI1Department of Physics and Astronomy, Aarhus University, Aarhus, Denmark, 2Center of Functionally Integrative Neuroscience (CFIN) and MINDLab, Department of Clinical Medicine, Aarhus University, Aarhus, Denmark, 3Champalimaud Research, Champalimaud Foundation, Lisboa, Portugal
Synopsis
Keywords: Microstructure, Microstructure
Correlation Tensor MRI (CTI) provided strong evidence for non-vanishing microscopic kurtosis (µK) in neural tissues, both in animals and in humans. However, µK sources remain to be elucidated. Standard Model with Exchange (SMEX) contrasts have been recently proposed by Olesen et al. for mapping exchange properties, especially in gray matter. Here, we derive an expression for µK originating from the SMEX biophysical model due to exchange, and in a model of stroke compare µK derived from SMEX to µK measured with CTI. Our findings suggest that µK(CTI)>µK(SMEX), suggesting a degree of microstructural origin for the CTI contrast.Introduction
In Diffusional Kurtosis Imaging (DKI)1, the total kurtosis includes contributions from anisotropic, isotropic and microscopic kurtosis (Kaniso, Kiso, and µK, respectively) sources. Correlation Tensor Imaging (CTI)2,3 has been recently developed to resolve these different kurtosis sources in tissues, and revealed– contrary to expectations – nonvanishing µK in the healthy brain2-4; furthermore, µK was shown to dramatically increase in stroke5. However, µK itself can arise from multiple sources: restricted diffusion, cross-sectional variance, and exchange. Given that exchange effects are becoming increasingly evident in dMRI signals, especially in gray matter6,7 and in stroked tissue8, where µK is high2-5, we sought to test its potential contribution to µK.To achieve this, we analyze the SMEX (Standard Model with Exchange) biophysical model6 in terms of kurtosis. SMEX assumes a 2 component Karger model9 (neurite fraction fn with diffusivity Dn, extracellular fraction fe with diffusivity De) and a neurite exchange rate, rn, and it can be shown that in such a system:
Eq.1 $${\mu}K=\frac{2}{5}\frac{f_nf_e}{(f_n+f_e)}\frac{(3D_n^2+15D_e^2-10D_nD_e)}{\overline{D}^2}\left(\frac{r_nt-(1-e^{-r_nt})}{(r_nt)^2}\right)$$
where $$\overline{D}=f_n\frac{D_n}{3}+f_eD_e$$ and a dot fraction is already accounted for.
Hence, Eq. 1 offers means to predict µK from SMEX measurements, which can then be compared with µK measured by CTI.
Methods
All animal experiments were preapproved by institutional and national authorities and carried out according to European Directive 2010/63.Stroke Induction and sample preparation. N=3 adult mice underwent stroke induction using an established protocol5. After 3h, the animals were transcardially perfusion fixed; brains were extracted and kept in fixative for 24h, washed in PBS for 48h, and then placed in a 10mm NMR tube filled with Fluorinert.
MRI. All MRI experiments were performed on a Bruker Aeon Ascend 16.4T scanner equipped with a Micro5 probe capable of delivering up to 3000 mT/m. Samples were kept at 37°C during diffusion experiments, which were all acquired with EPI (384 kHz bandwidth, 2 double-sampled shots, 1.38 pFT undersampling), TR/TE = 3000/54 ms, in-plane resolution 100×100 µm2, slice thickness = 600 µm.
SMEX experiments were acquired with 30 b0s, 32 b-value shells up to 60 ms/µm2, 30 directions per shell, δ=6ms, and 8 different Δs ranging from 8.5-35 ms. CTI experiments were conducted with δ1= δ2=1.5 ms, Δ1 = Δ2 = τm = 12 ms and the balanced shell scheme from 3 and 5 to minimize higher order terms with max b value of 3.4 ms/µm2.
Data Analysis. Tensor MPPCA10 denoising was applied prior to reconstruction of EPI data. SMEX parameters, including neurite fraction and exchange rate, were extracted as in Olesen et al6. CTI data was powder averaged and analyzed according to 6.
Results
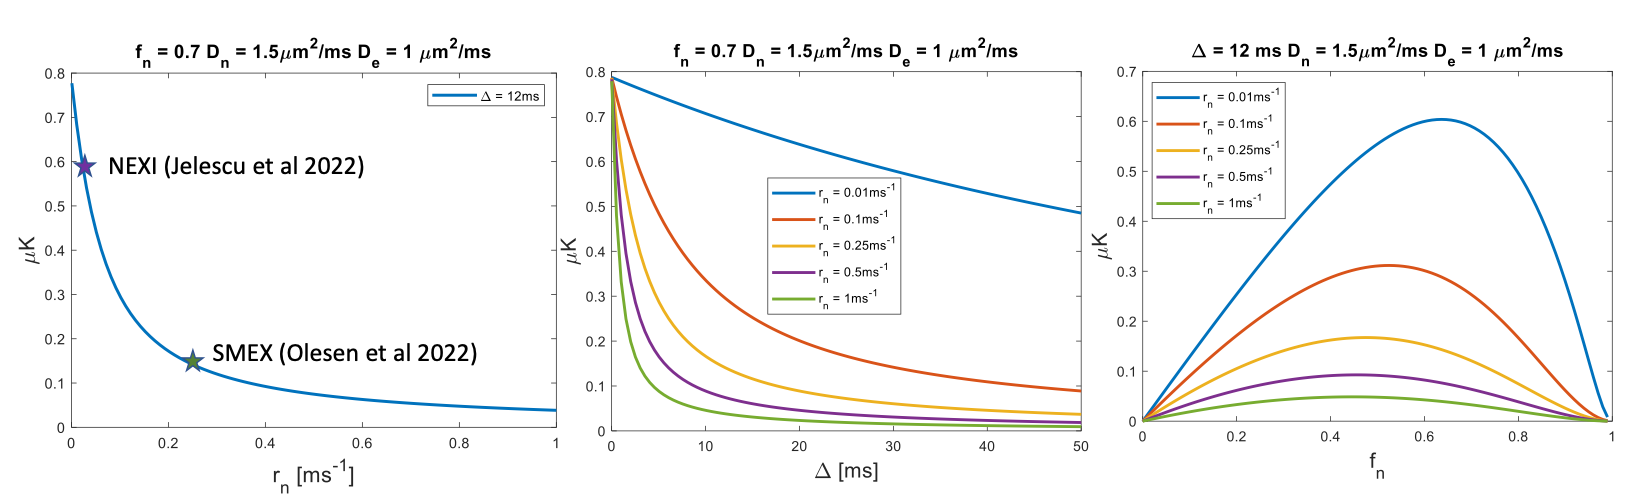
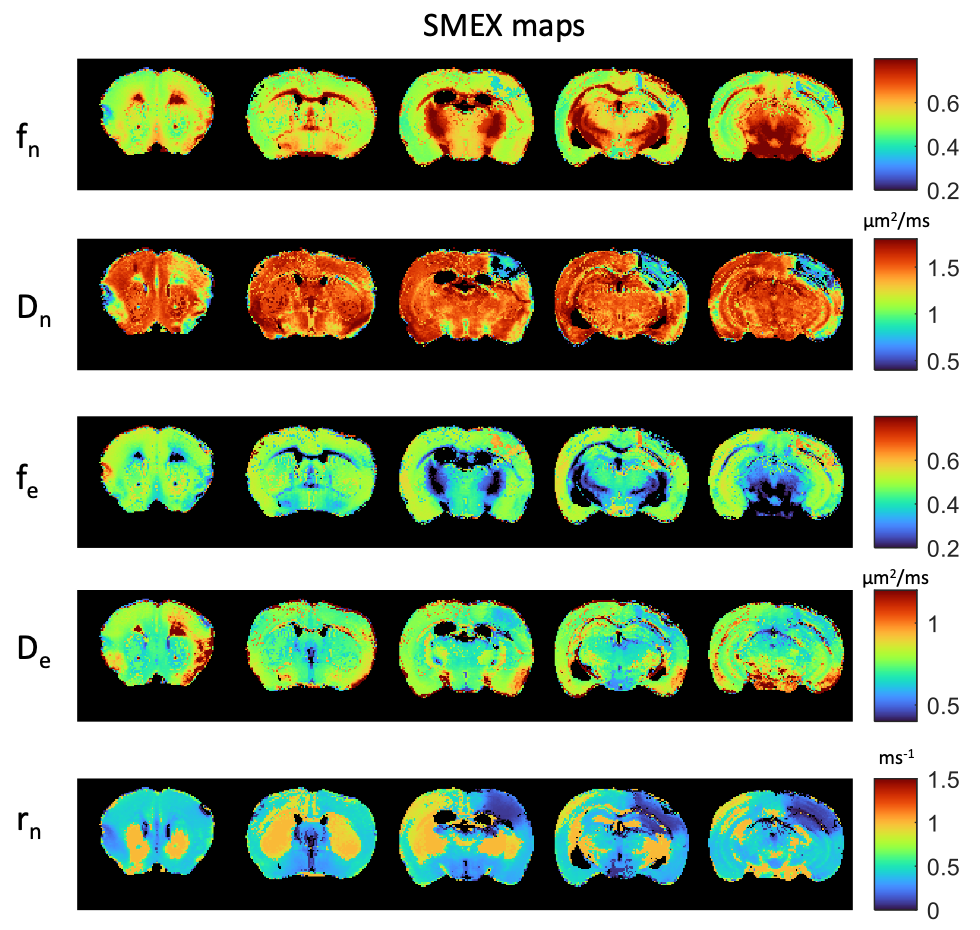
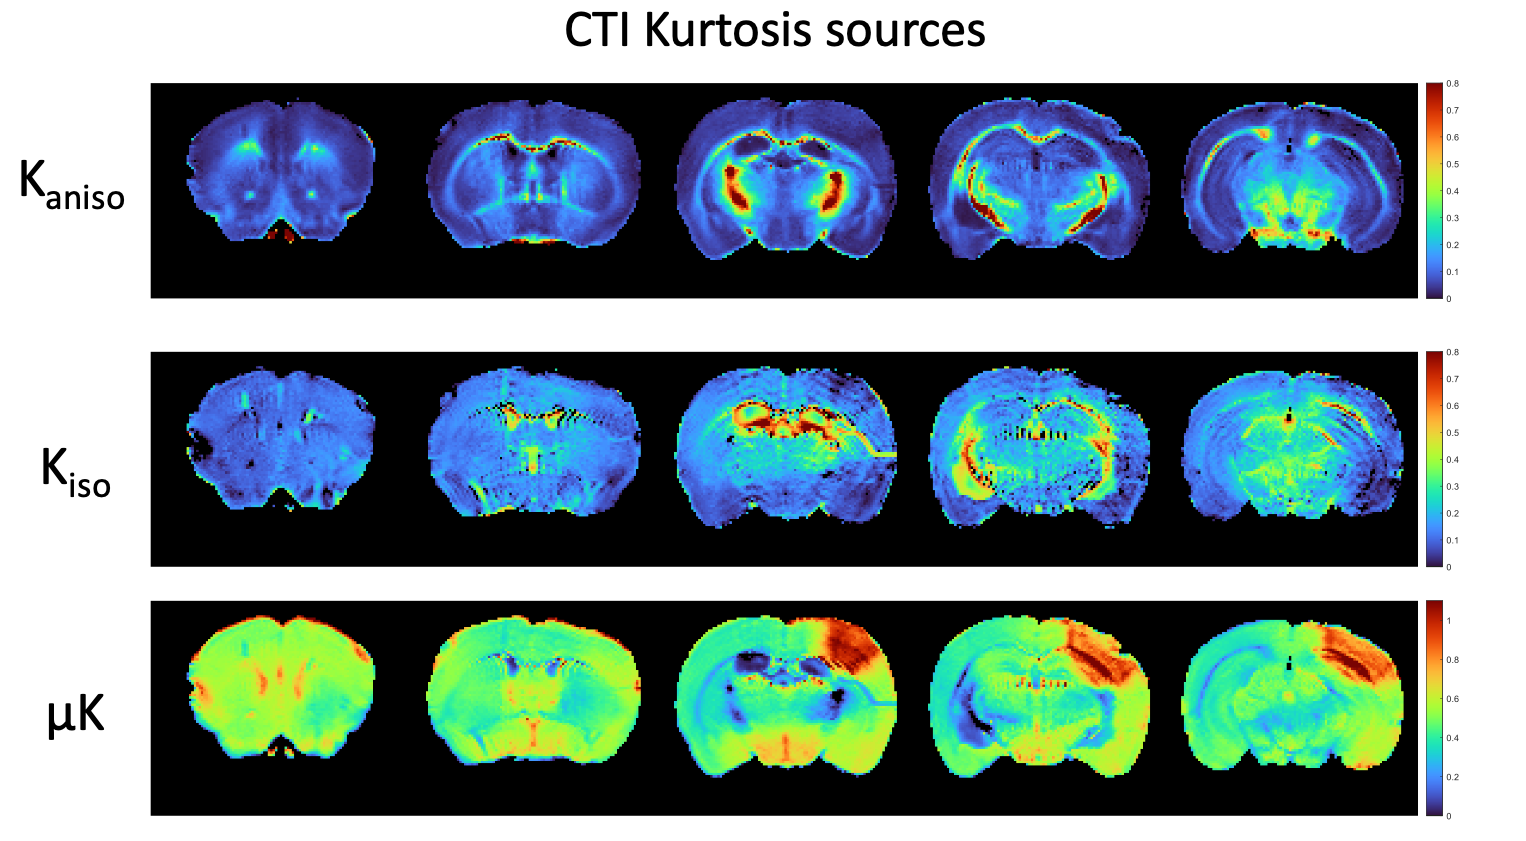
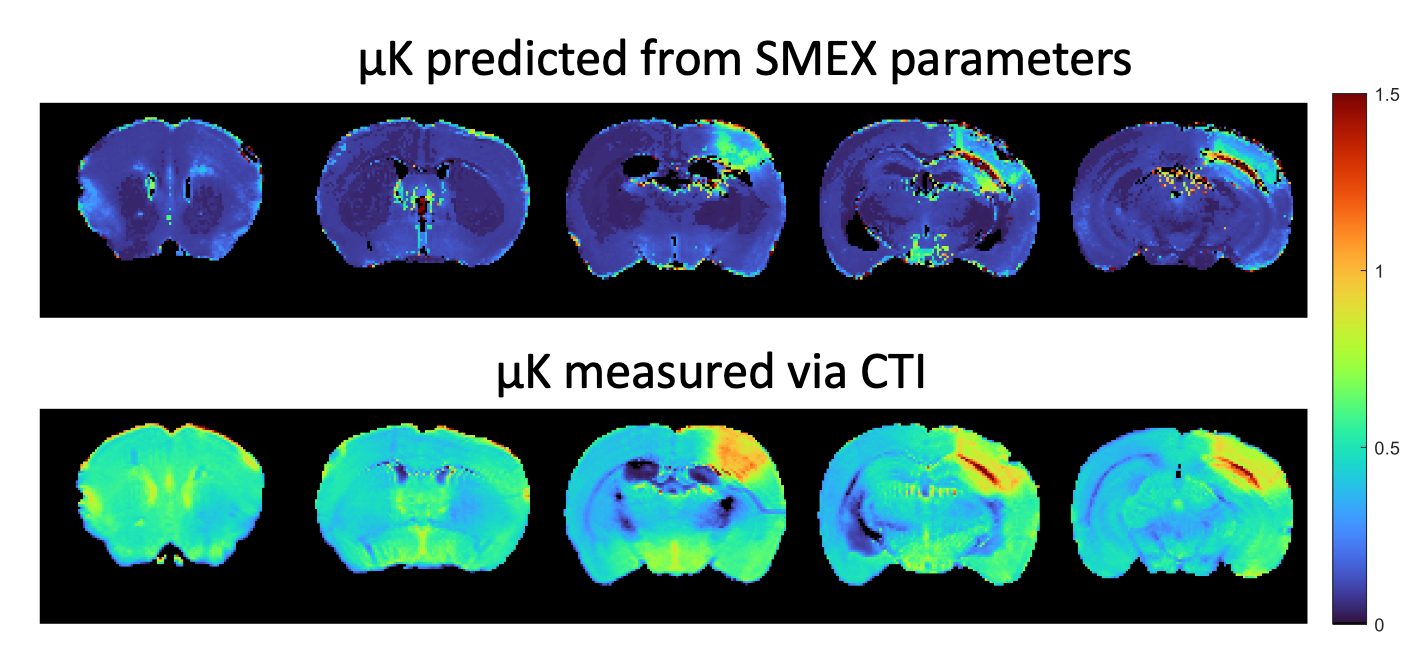
Figure 1 shows simulations for the extent of µK that could be expected in CTI measurements with a diffusion time of 12 ms (Figure A) for different exchange rates and plausible parameters for neural tissue. The stars mark the estimates of exchange rates in Jelescu et al’s NEXI work7 and Olesen et al’s SMEX work6 as indicated. The range of µK arising purely due to exchange varies between 0.8 (very slow exchange) and decreases towards zero for very fast exchange. Figure 1B plots the diffusion time dependence for different exchange rates. Note that the longer the diffusion time, the smaller the µK due to exchange. Finally, a maximum in µK is observed as the fraction of neurites increases depending on exchange rates, and then µK decreases back to zero as the system becomes again unimodal given that the dot compartment does not effectively contribute to µK.Figure 2 shows the SMEX-driven maps obtained from a representative stroked mouse brain, evidencing contrasts consistent with those in Olesen6 but with altered parameters in the stroke (c.f. separate abstract on SMEX contrasts in stroke). Figure 3 shows the CTI-driven kurtosis source maps, consistent with Alves et al5. Figure 4 compares on the same scale the µK predicted from the SMEX measurements and the CTI-driven µK. Clearly, µK(CTI)>µK(SMEX) nearly everywhere.
Discussion
We presented the first attempt in deciphering the origin of µK in CTI. Assuming the SMEX model holds and that the Karger model is a good representation of exchange processes in tissues, CTI’s µK should be predominantly due to exchange, and the two metrics should be similar. However, in practice, µK(SMEX) is underestimated by a factor of >2 nearly everywhere, suggesting that e.g. cross-sectional variance in dendrites and/or beading in stroke11,12 could contribute significantly to CTI’s µK estimates. Alternatively, potential violations of CTI assumptions2,3, such as the long mixing time regime or finite δ, and higher order terms could also bias µK measurements in CTI. Still, previous CTI experiments suggest that these effects would be relatively small in the brain.Conclusion
CTI’s µK likely arises from a combination of exchange and restriction effects, which future work should aim to disentangle13.Acknowledgements
CONGENTO, PORTUGAL 2020 European Regional Development Fund (ERDF) and Fundação para a Ciência e Tecnologia LISBOA-01-0145-FEDER-022170. RNH was supported by the ScientificEmployment Stimulus 4th Edition from Fundação para a Ciência e Tecnologia, Portugal, ref2021.02777.CEECIND.References
1. Jensen J, Helpern J. MRI quantification of non-Gaussian water diffusion by kurtosis analysis. NMR Biomed. 2010; 23(7):698-710.
2. Henriques R, Jespersen S, Shemesh N. Correlation tensor magnetic resonance imaging. Neuroimage. 2020 ;211:116605.
3. Henriques R, Jespersen S, Shemesh N. Evidence for microscopic kurtosis in neural tissue revealed by correlation tensor MRI. Magn Reson Med. 2021 Dec;86(6):3111-3130.
4. Novello L, Henriques RN, Ianuş A, Feiweier T, Shemesh N, Jovicich J. In vivo Correlation Tensor MRI reveals microscopic kurtosis in the human brain on a clinical 3T scanner. Neuroimage. 2022;254:119137.
5. Alves R, Henriques R, Kerkelä L, Chavarrías C, Jespersen S, Shemesh N. Correlation Tensor MRI deciphers underlying kurtosis sources in stroke. Neuroimage. 2022;247:118833.
6. Olesen J, Østergaard L, Shemesh N, Jespersen S. Diffusion time dependence, power-law scaling, and exchange in gray matter. Neuroimage. 2022 ;251:118976.
7. Jelescu I, de Skowronski A, Geffroy F, Palombo M, Novikov D. Neurite Exchange Imaging (NEXI): A minimal model of diffusion in gray matter with inter-compartment water exchange. Neuroimage. 2022;256:119277.
8. Lätt J, Nilsson M, van Westen D, et al. Diffusion-weighted MRI measurements on stroke patients reveal water-exchange mechanisms in sub-acute ischaemic lesions. NMR Biomed. 2009; 22(6):619-628.
9. Kärger J. NMR self-diffusion studies in heterogeneous systems. Adv Colloid Interface Sci. 1985; 23:129-148.
10. Olesen J, Ianus A, Østergaard L, Shemesh N, Jespersen S. Tensor denoising of multidimensional MRI data. Magnetic Resonance in Medicine. 2022, 1-13.
11. Budde M, Frank J. Neurite beading is sufficient to decrease the apparent diffusion coefficient after ischemic stroke. Proc Natl Acad Sci U S A. 2010;107(32):14472-14477.
12. Skinner N, Kurpad S, Schmit B, Budde M. Detection of acute nervous system injury with advanced diffusion-weighted MRI: a simulation and sensitivity analysis. NMR Biomed. 2015;28(11):1489-1506.
13. Williamson N et al, https://www.biorxiv.org/content/10.1101/2022.09.23.483116v1.
Figures